Calistoga, CA (California) Houses and Residents
| Calistoga: | $774,382 |
| California: | $715,900 |
Mean price in 2022:
Detached houses: $1,237,554
Here: $1,237,554 State: $988,808 Mobile homes: $207,408
Here: $207,408 State: $184,506
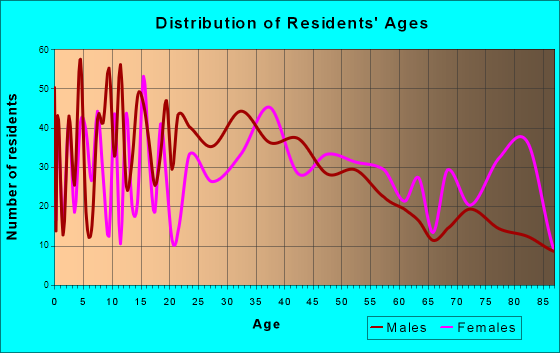
Total population: 5,303 (Urban population: 5,190 (all inside urban clusters), Rural population: 0)
Houses: 2,368 (2,150 occupied: 1,389 owner occupied, 804 renter occupied)
| % of renters here: | 37% |
| State: | 44% |
Housing density: 911 houses/condos per square mile
Median price asked for vacant for-sale houses and condos in 2022 in this county: $1,177,232.
Median contract rent in 2022: $1,531 (lower quartile is $948, upper quartile is over $2,000)
Median rent asked for vacant for-rent units in 2022: $1,449
Median gross rent in Calistoga, CA in 2022: $1,565
Housing units in Calistoga with a mortgage: 582 (94 second mortgage, 0 home equity loan, 103 both second mortgage and home equity loan)
Houses without a mortgage: 0
Median household income for houses/condos with a mortgage: $112,299
Median household income for apartments without a mortgage: $64,918
Median monthly housing costs: $1,456
Compare current foreclosures near Calistoga, CA:
| Photo | Address | Area | Beds / Baths | Price | Details |
|---|---|---|---|---|---|

|
#1
Foothill Blvd
Calistoga, CA 94515
|
3,158 sq. feet
|
3 baths 4 beds |
show details | |

|
#2
Washington St Apt 8
Calistoga, CA 94515
|
- sq. feet
|
- baths - beds |
show details | |

|
#3
Pinnacle Ct
Hidden Valley Lake, CA 95467
|
1,725 sq. feet
|
3 baths 3 beds |
$379,000
|
show details |

|
#4
Mcconnell Ave
Santa Rosa, CA 95404
|
1,216 sq. feet
|
2 baths 4 beds |
show details | |

|
#5
Montecito Ave
Santa Rosa, CA 95404
|
1,537 sq. feet
|
2 baths 2 beds |
show details | |

|
#6
Ravenhill Rd
Hidden Valley Lake, CA 95467
|
1,870 sq. feet
|
2 baths 4 beds |
show details | |

|
#7
Deer Hollow Rd
Hidden Valley Lake, CA 95467
|
1,516 sq. feet
|
2 baths 3 beds |
show details | |

|
#8
Maxwell St
Healdsburg, CA 95448
|
2,060 sq. feet
|
2 baths 3 beds |
show details | |

|
#9
Spyglass Rd
Hidden Valley Lake, CA 95467
|
1,246 sq. feet
|
2 baths 3 beds |
show details | |

|
#10
Enterprise Rd
Glen Ellen, CA 95442
|
1,220 sq. feet
|
3 baths 3 beds |
show details |
| Photo | Address | Area | Beds / Baths | Price | Details |
|---|---|---|---|---|---|

|
#11
Malibu Cir
Santa Rosa, CA 95401
|
1,300 sq. feet
|
3 baths 3 beds |
show details | |

|
#12
Harness Dr
Pope Valley, CA 94567
|
2,195 sq. feet
|
2 baths 4 beds |
show details | |

|
#13
Decanter Cir
Windsor, CA 95492
|
2,855 sq. feet
|
2 baths 4 beds |
show details | |

|
#14
Corby Ave
Santa Rosa, CA 95407
|
836 sq. feet
|
1 baths 2 beds |
show details | |

|
#15
Ridgway Ave
Santa Rosa, CA 95401
|
1,603 sq. feet
|
2 baths 3 beds |
show details | |

|
#16
Carson St
Santa Rosa, CA 95403
|
1,408 sq. feet
|
2 baths 3 beds |
show details | |

|
#17
Robbie Way
Windsor, CA 95492
|
948 sq. feet
|
1 baths 2 beds |
show details | |

|
#18
De Meo St
Santa Rosa, CA 95407
|
1,901 sq. feet
|
3 baths 4 beds |
show details | |

|
#19
Autumn Walk Dr
Santa Rosa, CA 95403
|
- sq. feet
|
2 baths 3 beds |
show details | |

|
#20
Ridgway Ave
Santa Rosa, CA 95401
|
1,603 sq. feet
|
2 baths 3 beds |
show details |
| Photo | Address | Area | Beds / Baths | Price | Details |
|---|---|---|---|---|---|

|
#21
Erland Rd
Santa Rosa, CA 95404
|
1,016 sq. feet
|
1 baths 2 beds |
show details | |

|
#22
Wilcox Rd
Windsor, CA 95492
|
- sq. feet
|
1 baths 2 beds |
show details | |

|
#23
Billington Ln
Windsor, CA 95492
|
1,467 sq. feet
|
2 baths 3 beds |
show details | |

|
#24
W Hearn Ave
Santa Rosa, CA 95407
|
1,050 sq. feet
|
2 baths 3 beds |
show details | |

|
#25
Ventana Dr
Windsor, CA 95492
|
2,018 sq. feet
|
3 baths 4 beds |
show details | |

|
#26
Match Point Ave
Santa Rosa, CA 95407
|
2,942 sq. feet
|
3 baths 3 beds |
show details | |

|
#27
Grange Rd
Santa Rosa, CA 95404
|
3,732 sq. feet
|
3 baths 3 beds |
show details | |

|
#28
Debbie Dr
Santa Rosa, CA 95407
|
1,077 sq. feet
|
2 baths 3 beds |
show details | |

|
#29
Donahue Ave
Santa Rosa, CA 95401
|
1,587 sq. feet
|
3 baths 3 beds |
show details | |

|
#30
Lemur St
Santa Rosa, CA 95401
|
1,262 sq. feet
|
2 baths 3 beds |
show details |
| Photo | Address | Area | Beds / Baths | Price | Details |
|---|---|---|---|---|---|

|
#31
Lord Dr
Windsor, CA 95492
|
1,619 sq. feet
|
3 baths 3 beds |
show details | |

|
#32
Trombetta St
Santa Rosa, CA 95407
|
1,616 sq. feet
|
2 baths 3 beds |
show details | |

|
#33
Cactus Ave
Santa Rosa, CA 95405
|
1,505 sq. feet
|
2 baths 3 beds |
show details | |

|
#34
Leo Dr
Santa Rosa, CA 95407
|
1,873 sq. feet
|
2 baths 3 beds |
show details | |

|
#35
Tokay St
Santa Rosa, CA 95404
|
1,569 sq. feet
|
3 baths 4 beds |
show details | |

|
#36
Starr Rd
Windsor, CA 95492
|
3,026 sq. feet
|
2 baths 3 beds |
show details | |

|
#37
Hewett St
Santa Rosa, CA 95401
|
2,432 sq. feet
|
2 baths 4 beds |
show details | |

|
#38
Rose Ave
Santa Rosa, CA 95407
|
1,407 sq. feet
|
1 baths 3 beds |
show details | |

|
#39
Everglade Dr
Santa Rosa, CA 95409
|
1,344 sq. feet
|
2 baths 4 beds |
show details | |

|
#40
Wooded Glen Ct
Windsor, CA 95492
|
1,633 sq. feet
|
3 baths 4 beds |
show details |
| Photo | Address | Area | Beds / Baths | Price | Details |
|---|---|---|---|---|---|

|
#41
Pollard Way
Windsor, CA 95492
|
1,438 sq. feet
|
2 baths 3 beds |
show details | |

|
#42
Pollard Way
Windsor, CA 95492
|
1,235 sq. feet
|
2 baths 3 beds |
show details | |

|
#43
Lariat St
Pope Valley, CA 94567
|
- sq. feet
|
2 baths 3 beds |
show details | |

|
#44
Rose Meadow Ct
Santa Rosa, CA 95407
|
1,262 sq. feet
|
2 baths 3 beds |
show details | |

|
#45
Santa Barbara Dr
Santa Rosa, CA 95404
|
877 sq. feet
|
1 baths 2 beds |
show details | |

|
#46
Wood Rd
Fulton, CA 95439
|
2,864 sq. feet
|
3 baths 3 beds |
show details | |

|
#47
Colgan Ave
Santa Rosa, CA 95404
|
1,340 sq. feet
|
1 baths 2 beds |
show details | |

|
#48
Raccoon Ln
Santa Rosa, CA 95401
|
1,163 sq. feet
|
3 baths 2 beds |
show details | |

|
#49
Parkside Dr
Santa Rosa, CA 95404
|
1,198 sq. feet
|
2 baths 3 beds |
show details | |

|
Check over 1 million property listings on Foreclosure.com!
|
browse all offers | |||

Latest news about housing in Calistoga, CA collected exclusively by city-data.com from local newspapers, TV, and radio stations

 | GET REAL About San Diego Rental and Real Estate Prices (751 replies) |
| Seaside towns with housing for $1.5M or less? (10 replies) |
| US News: SF-Oakland Metro Area ranks 7th Best Place to Live (403 replies) |
| Placer-Ville or Yount-Ville? (23 replies) |
| New job in Foster City, where to live? (30 replies) |
| why is there really no tech industry in north bay areas (45 replies) |
Median year apartment built: 1967
Household type by relationship:
Households: 5,074- Male householders: 863 (250 living alone), Female householders: 1,205 (491 living alone)
959 spouses (944 opposite-sex spouses), 159 unmarried partners, (159 opposite-sex unmarried partners), 997 children (997 natural, 0 adopted, 0 stepchildren), 11 grandchildren, 95 brothers or sisters, 206 parents, 0 foster children, 174 other relatives, 327 non-relatives
- In group quarters: 73
Size of family households: 523 2-persons, 240 3-persons, 320 4-persons, 18 5-persons, 73 7-or-more-persons.
Size of nonfamily households: 871 1-person, 96 2-persons, 114 4-persons.
553 married couples with children.
37 single-parent households (7 men, 30 women).
61.2% of residents of Calistoga speak English at home.
34.7% of residents speak Spanish at home (47% speak English very well, 25% speak English well, 16% speak English not well, 13% don't speak English at all).
4.1% of residents speak other Indo-European language at home (72% speak English very well, 18% speak English well, 9% speak English not well).
0.2% of residents speak Asian or Pacific Island language at home (30% speak English well, 70% speak English not well).
Foreign born population: 1,543 (30.4%)
(43.4% of them are naturalized citizens)
| Here: | 5.9 |
| State: | 6.0 |
| Here: | 4.0 |
| State: | 3.9 |

- Bedrooms in owner-occupied houses and condos in Calistoga, California
- 16no bedroom
- 01 bedroom
- 6252 bedrooms
- 4413 bedrooms
- 2284 bedrooms
- 805+ bedrooms

- Bedrooms in renter-occupied apartments in Calistoga, California
- 73no bedroom
- 2781 bedroom
- 852 bedrooms
- 3393 bedrooms
- 304 bedrooms
- 05+ bedrooms

- Cars and other vehicles available in Calistoga in owner-occupied houses/condos
- 76no vehicle
- 4521 vehicle
- 4482 vehicles
- 2913 vehicles
- 1224 vehicles
- 05+ vehicles

- Cars and other vehicles available in Calistoga in renter-occupied apartments
- 10no vehicle
- 3161 vehicle
- 3172 vehicles
- 1613 vehicles
- 04 vehicles
- 05+ vehicles

- Rooms in owner-occupied houses in Calistoga, California
- 161 room
- 02 rooms
- 1263 rooms
- 2114 rooms
- 2555 rooms
- 2636 rooms
- 1937 rooms
- 2348 rooms
- 909+ rooms

- Rooms in renter-occupied apartments in Calistoga, California
- 541 room
- 2322 rooms
- 823 rooms
- 754 rooms
- 2265 rooms
- 286 rooms
- 407 rooms
- 528 rooms
- 169+ rooms


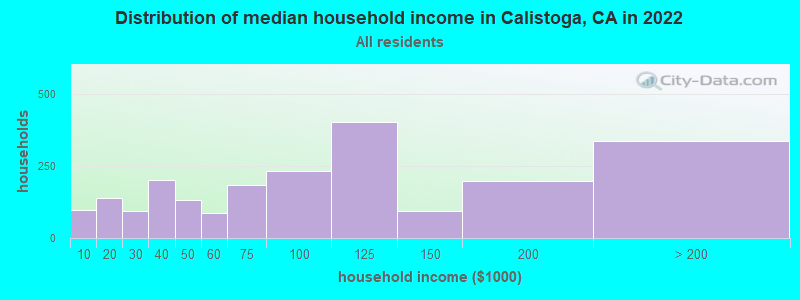
Calistoga, CA household income distribution

- 98Less than $10,000
- 137$10,000 to $19,999
- 95$20,000 to $29,999
- 201$30,000 to $39,999
- 131$40,000 to $49,999
- 87$50,000 to $59,999
- 182$60,000 to $74,999
- 232$75,000 to $99,999
- 402$100,000 to $124,999
- 92$125,000 to $149,999
- 196$150,000 to $199,999
- 336$200,000 or more
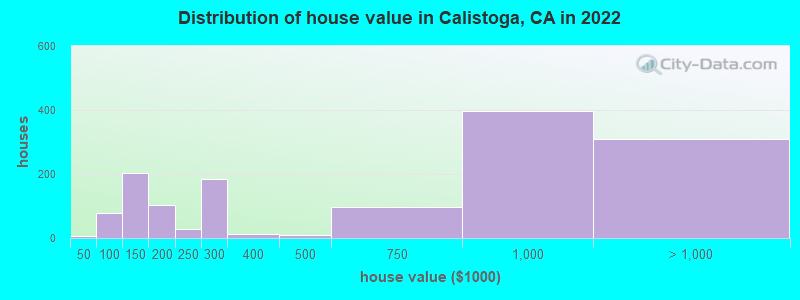
Home value of owner - occupied houses in 2022 in Calistoga, CA
-
- 6Less than $10,000
- 26$50,000 to $59,999
- 51$90,000 to $99,999
- 173$100,000 to $124,999
- 29$125,000 to $149,999
- 58$150,000 to $174,999
- 43$175,000 to $199,999
- 27$200,000 to $249,999
- 183$250,000 to $299,999
- 10$300,000 to $399,999
- 8$400,000 to $499,999
- 95$500,000 to $749,999
- 398$750,000 to $999,999
- 175$1,000,000 to $1,499,999
- 41$1,500,000 to $1,999,999
- 93$2,000,000 or more
Rent paid by renters in 2022 in Calistoga, CA
-
- 26$300 to $349
- 119$500 to $549
- 33$750 to $799
- 35$800 to $899
- 172$900 to $999
- 32$1,000 to $1,249
- 57$1,250 to $1,499
- 287$1,500 to $1,999
- 48$2,000 to $2,499
- 123$2,500 to $2,999
- 24$3,000 to $3,499
- 21$3,500 or more

Percentage of workers working in this county: 72.4%
Number of people working at home: 205 (8.1% of all workers)
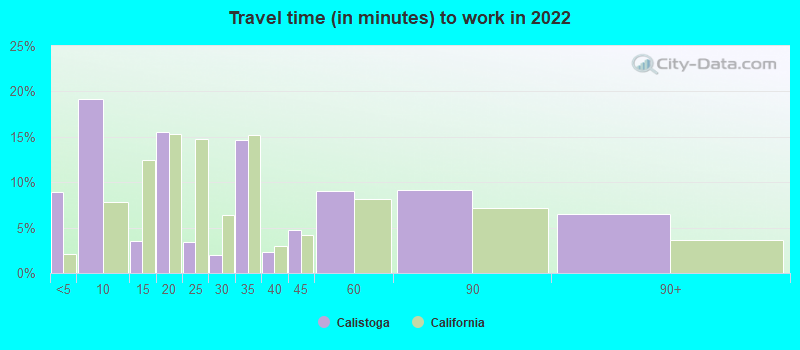
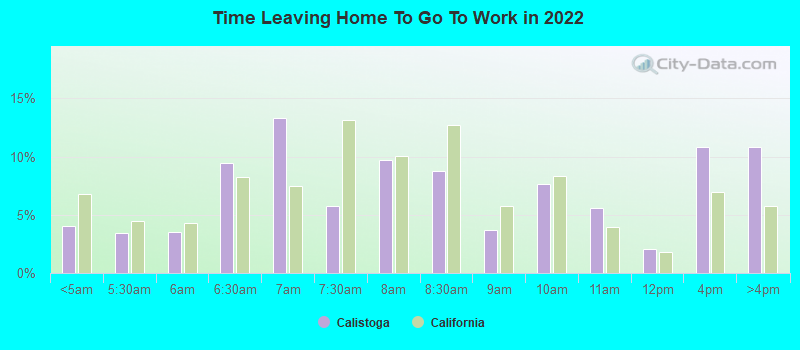
Travel time to work (commute)
- Less than 5 minutes: 225
- 5 to 9 minutes: 401
- 10 to 14 minutes: 410
- 15 to 19 minutes: 199
- 20 to 24 minutes: 31
- 25 to 29 minutes: 120
- 30 to 34 minutes: 532
- 35 to 39 minutes: 0
- 40 to 44 minutes: 71
- 45 to 59 minutes: 163
- 60 to 89 minutes: 110
- 90 or more minutes: 42
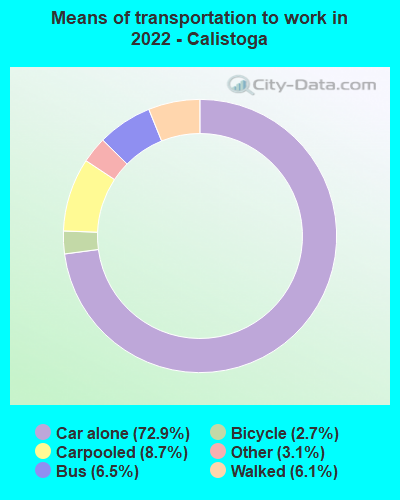
Means of transportation to work:
- Drove a car alone: 1,547 (64.7%)
- Carpooled: 221 (9.2%)
- Bus: 92 (3.8%)
- Taxi: 83 (3.5%)
- Bicycle: 75 (3.1%)
- Walked: 131 (5.5%)
- Worked at home: 205 (8.6%)
- Unemployment by race in 2022
- Unemployment rate for Hispanic or Latino residents
- 6.3%Females

- Year of entry for the foreign-born population in Calistoga, California
- 1762010 or later
- 3882000 to 2009
- 5011990 to 1999
- 4011980 to 1989
- 2291970 to 1979
- 263Before 1970
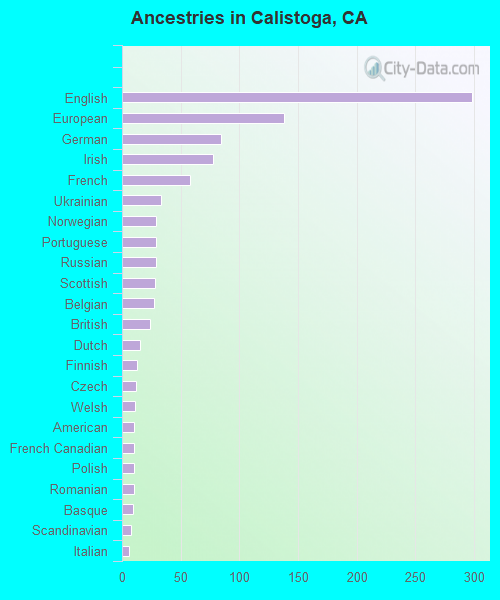
First ancestries reported:
- English: 298 (10.1%)
- European: 138 (4.7%)
- German: 84 (2.8%)
- Irish: 78 (2.6%)
- French: 58 (2.0%)
- Ukrainian: 33 (1.1%)
- Norwegian: 29 (1.0%)
- Portuguese: 29 (1.0%)
- Russian: 29 (1.0%)
- Scottish: 28 (0.9%)
- Belgian: 27 (0.9%)
- British: 24 (0.8%)
- Dutch: 15 (0.5%)
- Finnish: 13 (0.4%)
- Czech: 12 (0.4%)
- Welsh: 11 (0.4%)
- American: 10 (0.3%)
- French Canadian: 10 (0.3%)
- Polish: 10 (0.3%)
- Romanian: 10 (0.3%)
- Basque: 9 (0.3%)
- Scandinavian: 8 (0.3%)
- Italian: 6 (0.2%)
Most common places of birth for foreign-born residents (%):
| Calistoga: | 72.0% (1,096) |
| California: | 37.2% (3,881,193) |
| Calistoga: | 6.4% (98) |
| California: | 2.8% (290,436) |
| Calistoga: | 4.3% (66) |
| California: | 0.4% (40,224) |
| Calistoga: | 4.0% (61) |
| California: | 1.2% (127,477) |
| Calistoga: | 2.2% (33) |
| California: | 0.7% (71,932) |
| Calistoga: | 2.0% (31) |
| California: | 0.6% (60,761) |
| Calistoga: | 1.6% (25) |
| California: | 0.2% (17,699) |
Place of birth for U.S.-born residents:
- This state: 2,459
- Other state: 980
- Northeast: 161
- Midwest: 483
- South: 134
- West: 173
89.7% of Calistoga residents lived in the same house 1 years ago.
Out of people who lived in different houses, 33.0% lived in this county.
Out of people who lived in different counties, 87.2% lived in California.
| Calistoga: | 89.7% |
| State average: | 88.9% |
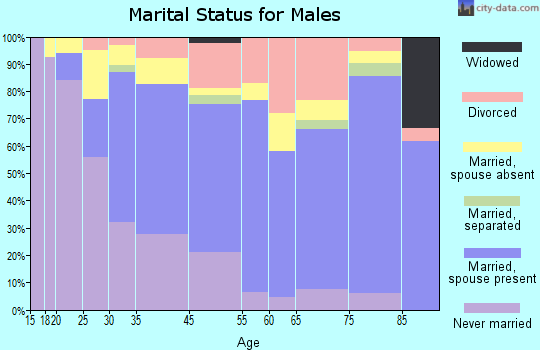
Education attainment for males 25 years and older:
- No schooling: 167
- Nursery to 4th grade: 14
- 5th and 6th grade: 127
- 7th and 8th grade: 0
- 9th grade: 81
- 10th grade: 0
- 11th grade: 0
- 12th grade, no diploma: 379
- High school graduate (or equivalency): 325
- Less than 1 year of college: 104
- Some college more than 1 year, no degree: 375
- Associate degree: 97
- Bachelor's degree: 329
- Master's degree: 119
- Professional school degree: 33
- Doctorate degree: 12

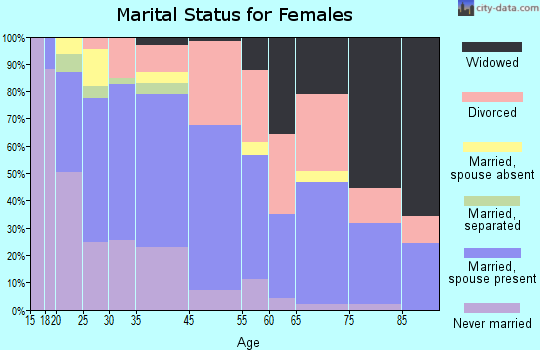
Education attainment for females 25 years and older:
- No schooling: 89
- Nursery to 4th grade: 3
- 5th and 6th grade: 197
- 7th and 8th grade: 0
- 9th grade: 0
- 10th grade: 0
- 11th grade: 6
- 12th grade, no diploma: 12
- High school graduate (or equivalency): 158
- Less than 1 year of college: 117
- Some college more than 1 year, no degree: 175
- Associate degree: 369
- Bachelor's degree: 444
- Master's degree: 300
- Professional school degree: 65
- Doctorate degree: 74

Housing units in structures:
- One, detached: 1,308
- One, attached: 84
- Two: 21
- 3 or 4: 6
- 5 to 9: 164
- 10 to 19: 26
- 20 to 49: 200
- Mobile homes: 557
Median worth of mobile homes: $189,325
House/condo owner moved in on average 8 years ago
Renter moved in on average 6 years ago


- 68.7%Utility gas
- 31.3%Electricity
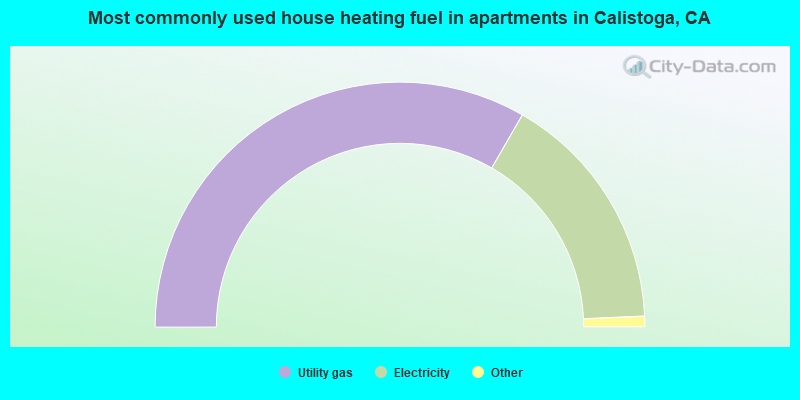
- 66.8%Utility gas
- 32.0%Electricity
- 0.8%No fuel used
- 0.5%Solar energy
Private vs. public school enrollment:
| Here: | 0.0% |
| California: | 10.5% |
| Here: | 0.0% |
| California: | 8.5% |
| Here: | 5.9% |
| California: | 15.9% |


