Calvert City, KY (Kentucky) Houses and Residents
| Calvert City: | $167,021 |
| Kentucky: | $196,300 |
Mean price in 2022:
Detached houses: $181,952
Here: $181,952 State: $256,452 Mobile homes: $37,324
Here: $37,324 State: $84,635
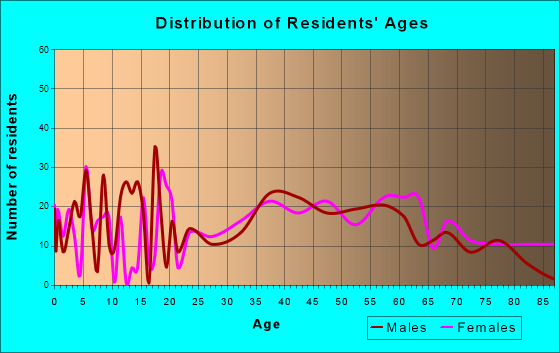
Total population: 2,498 (Urban population: 0, Rural population: 2,758 (all nonfarm))
Houses: 1,247 (1,066 occupied: 598 owner occupied, 490 renter occupied)
| % of renters here: | 45% |
| State: | 31% |
Housing density: 90 houses/condos per square mile
Median price asked for vacant for-sale houses and condos in 2022: $137,308.
Median contract rent in 2022: $755 (lower quartile is $329, upper quartile is $1,097)
Median rent asked for vacant for-rent units in 2022: $700
Median gross rent in Calvert City, KY in 2022: $963
Housing units in Calvert City with a mortgage: 337 (35 second mortgage, 0 home equity loan, 35 both second mortgage and home equity loan)
Houses without a mortgage: 0
Median household income for houses/condos with a mortgage: $95,883
Median household income for apartments without a mortgage: $54,234
Median monthly housing costs: $799
Compare current foreclosures near Calvert City, KY:
| Photo | Address | Area | Beds / Baths | Price | Details |
|---|---|---|---|---|---|

|
#1
Alaska St
Calvert City, KY 42029
|
1,000 sq. feet
|
1 baths 3 beds |
show details | |

|
#2
Hawthorne St
Calvert City, KY 42029
|
1,096 sq. feet
|
1 baths 3 beds |
show details | |

|
#3
Grand Oaks Rd
Calvert City, KY 42029
|
1,410 sq. feet
|
2 baths 2 beds |
show details | |

|
#4
Dr Smith Ln
Calvert City, KY 42029
|
1,347 sq. feet
|
1 baths 2 beds |
show details | |

|
#5
Elder St
Calvert City, KY 42029
|
1,530 sq. feet
|
2 baths 2 beds |
show details | |

|
#6
Helena Rd
Calvert City, KY 42029
|
1,456 sq. feet
|
2 baths 3 beds |
show details | |

|
#7
Cedar St
Calvert City, KY 42029
|
1,394 sq. feet
|
1 baths 3 beds |
show details | |

|
#8
Butler Ln
Calvert City, KY 42029
|
948 sq. feet
|
1 baths 2 beds |
show details | |

|
#9
Industrial Pkwy
Calvert City, KY 42029
|
1,128 sq. feet
|
2 baths 3 beds |
show details | |

|
#10
Dr Smith Ln
Calvert City, KY 42029
|
2,468 sq. feet
|
1 baths 3 beds |
show details |
| Photo | Address | Area | Beds / Baths | Price | Details |
|---|---|---|---|---|---|

|
#11
E 7th Ave Apt 4
Calvert City, KY 42029
|
- sq. feet
|
- baths - beds |
show details | |

|
#12
Sharpe School Rd
Calvert City, KY 42029
|
- sq. feet
|
- baths - beds |
show details | |

|
#13
Dr Smith Ln
Calvert City, KY 42029
|
- sq. feet
|
- baths - beds |
show details | |

|
#14
Scale Rd
Calvert City, KY 42029
|
- sq. feet
|
- baths - beds |
show details | |

|
#15
President Ln
Calvert City, KY 42029
|
- sq. feet
|
- baths - beds |
show details | |

|
#16
Whispering Hills Ln
Benton, KY 42025
|
2,240 sq. feet
|
2 baths 3 beds |
$32,900
|
show details |

|
#17
Shelly Dr
Ledbetter, KY 42058
|
1,163 sq. feet
|
1 baths 3 beds |
show details | |

|
#18
State Rt 348 W
Symsonia, KY 42082
|
1,108 sq. feet
|
1 baths 3 beds |
show details | |

|
#19
Riverside Dr
Paducah, KY 42003
|
1,504 sq. feet
|
1 baths 3 beds |
show details | |

|
#20
N 13th St
Paducah, KY 42001
|
1,400 sq. feet
|
1 baths 3 beds |
show details |
| Photo | Address | Area | Beds / Baths | Price | Details |
|---|---|---|---|---|---|

|
#21
Us Highway 60 W
Ledbetter, KY 42058
|
1,365 sq. feet
|
1 baths 3 beds |
show details | |

|
#22
Clark Line Rd
Paducah, KY 42003
|
1,600 sq. feet
|
1 baths 3 beds |
show details | |

|
#23
Houser Rd
Benton, KY 42025
|
1,148 sq. feet
|
1 baths 2 beds |
show details | |

|
#24
Us Highway 68 W
Benton, KY 42025
|
1,776 sq. feet
|
1 baths 3 beds |
show details | |

|
#25
Greyhound Cir
Paducah, KY 42003
|
1,591 sq. feet
|
2 baths 3 beds |
show details | |

|
#26
Johnston Subdivision Rd
Benton, KY 42025
|
1,296 sq. feet
|
2 baths 3 beds |
show details | |

|
#27
Main St
Benton, KY 42025
|
896 sq. feet
|
1 baths 2 beds |
show details | |

|
#28
Lakeview Dr
Ledbetter, KY 42058
|
1,755 sq. feet
|
1 baths 3 beds |
show details | |

|
#29
Heather Ln
Benton, KY 42025
|
1,344 sq. feet
|
2 baths 3 beds |
show details | |

|
#30
Scale Rd
Benton, KY 42025
|
2,220 sq. feet
|
1 baths 3 beds |
show details |
| Photo | Address | Area | Beds / Baths | Price | Details |
|---|---|---|---|---|---|

|
#31
Jarvis Ln
Symsonia, KY 42082
|
2,184 sq. feet
|
2 baths 3 beds |
show details | |

|
#32
Loretta Dr
Ledbetter, KY 42058
|
1,790 sq. feet
|
2 baths 2 beds |
show details | |

|
#33
Cedar Grove Rd
Burna, KY 42028
|
1,076 sq. feet
|
1 baths 1 beds |
show details | |

|
#34
Cold Springs Rd
Paducah, KY 42003
|
2,318 sq. feet
|
2 baths 3 beds |
show details | |

|
#35
Oak Grove Cir
Benton, KY 42025
|
1,524 sq. feet
|
2 baths 3 beds |
show details | |

|
#36
Miller Ct
Paducah, KY 42003
|
1,850 sq. feet
|
2 baths 2 beds |
show details | |

|
#37
Lisa Ln
Symsonia, KY 42082
|
2,228 sq. feet
|
2 baths 3 beds |
show details | |

|
#38
Us Highway 641 N
Benton, KY 42025
|
1,904 sq. feet
|
2 baths 3 beds |
show details | |

|
#39
Six Oaks Dr
Paducah, KY 42003
|
2,240 sq. feet
|
2 baths 3 beds |
show details | |

|
#40
Geraldine Dr
Paducah, KY 42003
|
1,775 sq. feet
|
2 baths 3 beds |
show details |
| Photo | Address | Area | Beds / Baths | Price | Details |
|---|---|---|---|---|---|

|
#41
Myrna Dr
Paducah, KY 42003
|
1,342 sq. feet
|
2 baths 3 beds |
show details | |

|
#42
Jack Thomason Rd
Kuttawa, KY 42055
|
1,974 sq. feet
|
2 baths 3 beds |
show details | |

|
#43
Morningside Dr
Benton, KY 42025
|
1,500 sq. feet
|
1 baths 3 beds |
show details | |

|
#44
Christian Fellowship Rd
Benton, KY 42025
|
1,800 sq. feet
|
1 baths 3 beds |
show details | |

|
#45
Culp Rd
Paducah, KY 42003
|
1,778 sq. feet
|
1 baths 3 beds |
show details | |

|
#46
Wilton Cir
Paducah, KY 42003
|
1,482 sq. feet
|
2 baths 3 beds |
show details | |

|
#47
Heritage Ln
Benton, KY 42025
|
2,100 sq. feet
|
2 baths 3 beds |
show details | |

|
#48
S Hayden Ave
Salem, KY 42078
|
1,048 sq. feet
|
1 baths 2 beds |
show details | |

|
#49
Caldwell Springs Rd
Marion, KY 42064
|
1,952 sq. feet
|
1 baths 3 beds |
show details | |

|
Check over 1 million property listings on Foreclosure.com!
|
browse all offers | |||


 | Looking for rental in Calvert city ky (1 reply) |
| LBLfor family and in-laws - Maybe Grand Rivers? (6 replies) |
| Please help us find somewhere to move in Kentucky! (11 replies) |
| A good rural county (30 replies) |
| Seriously considering a move to Paducah, KY (8 replies) |
| Making the move!! (17 replies) |
Median year apartment built: 1974
Household type by relationship:
Households: 2,529- Male householders: 391 (102 living alone), Female householders: 664 (112 living alone)
449 spouses (449 opposite-sex spouses), 33 unmarried partners, (33 opposite-sex unmarried partners), 775 children (730 natural, 13 adopted, 32 stepchildren), 44 grandchildren, 7 brothers or sisters, 0 parents, 0 foster children, 15 other relatives, 54 non-relatives
- In group quarters: 94
Size of family households: 329 2-persons, 272 3-persons, 170 4-persons, 50 5-persons, 4 6-persons.
Size of nonfamily households: 226 1-person, 30 2-persons, 2 5-persons.
350 married couples with children.
227 single-parent households (20 men, 207 women).
99.7% of residents of Calvert City speak English at home.
0.2% of residents speak Spanish at home (100% speak English very well).
Foreign born population: 12 (0.5%)
(108.3% of them are naturalized citizens)
| Here: | 6.3 |
| State: | 6.4 |
| Here: | 4.6 |
| State: | 4.4 |

- Bedrooms in owner-occupied houses and condos in Calvert City, Kentucky
- 0no bedroom
- 141 bedroom
- 1132 bedrooms
- 3423 bedrooms
- 1114 bedrooms
- 195+ bedrooms

- Bedrooms in renter-occupied apartments in Calvert City, Kentucky
- 4no bedroom
- 591 bedroom
- 2022 bedrooms
- 2263 bedrooms
- 04 bedrooms
- 05+ bedrooms

- Cars and other vehicles available in Calvert City in owner-occupied houses/condos
- 23no vehicle
- 1271 vehicle
- 2972 vehicles
- 973 vehicles
- 484 vehicles
- 75+ vehicles

- Cars and other vehicles available in Calvert City in renter-occupied apartments
- 28no vehicle
- 3491 vehicle
- 1012 vehicles
- 123 vehicles
- 04 vehicles
- 05+ vehicles

- Rooms in owner-occupied houses in Calvert City, Kentucky
- 01 room
- 02 rooms
- 363 rooms
- 294 rooms
- 975 rooms
- 1766 rooms
- 887 rooms
- 938 rooms
- 809+ rooms

- Rooms in renter-occupied apartments in Calvert City, Kentucky
- 41 room
- 32 rooms
- 1143 rooms
- 1094 rooms
- 2405 rooms
- 166 rooms
- 07 rooms
- 68 rooms
- 09+ rooms


Calvert City, KY household income distribution

- 64Less than $10,000
- 151$10,000 to $19,999
- 103$20,000 to $29,999
- 244$30,000 to $39,999
- 42$40,000 to $49,999
- 52$50,000 to $59,999
- 78$60,000 to $74,999
- 124$75,000 to $99,999
- 89$100,000 to $124,999
- 57$125,000 to $149,999
- 67$150,000 to $199,999
- 28$200,000 or more

Home value of owner - occupied houses in 2022 in Calvert City, KY
-
- 17$15,000 to $19,999
- 5$20,000 to $24,999
- 10$40,000 to $49,999
- 3$50,000 to $59,999
- 4$60,000 to $69,999
- 15$70,000 to $79,999
- 17$80,000 to $89,999
- 39$90,000 to $99,999
- 57$100,000 to $124,999
- 70$125,000 to $149,999
- 63$150,000 to $174,999
- 72$175,000 to $199,999
- 54$200,000 to $249,999
- 52$250,000 to $299,999
- 57$300,000 to $399,999
- 3$400,000 to $499,999
- 6$500,000 to $749,999
- 4$2,000,000 or more

Rent paid by renters in 2022 in Calvert City, KY
-
- 16Less than $100
- 72$200 to $249
- 13$250 to $299
- 27$300 to $349
- 24$350 to $399
- 5$400 to $449
- 3$450 to $499
- 33$500 to $549
- 6$550 to $599
- 4$600 to $649
- 14$650 to $699
- 12$700 to $749
- 18$750 to $799
- 37$800 to $899
- 177$1,000 to $1,249
- 30No cash rent

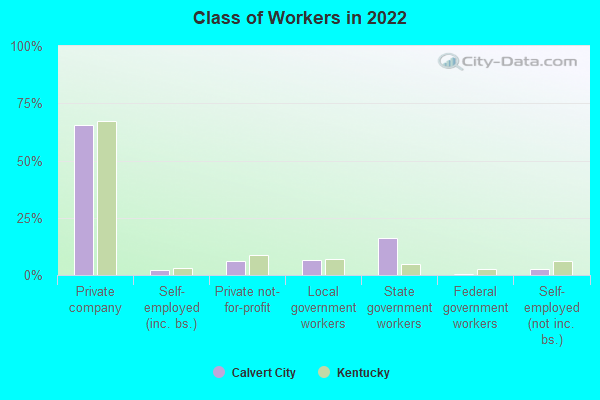
Percentage of workers working in this county: 62.2%
Number of people working at home: 37 (3.1% of all workers)
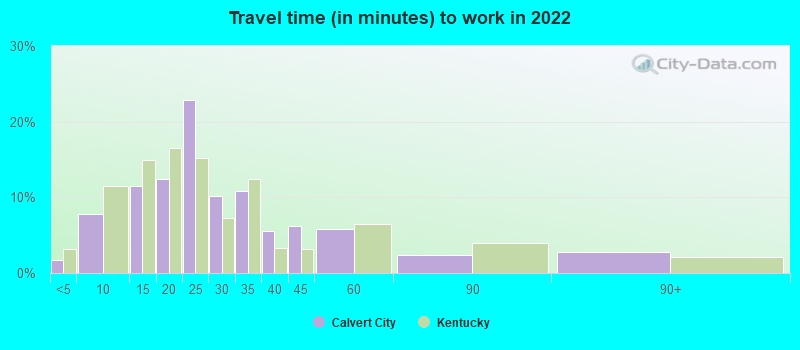
Travel time to work (commute)
- Less than 5 minutes: 46
- 5 to 9 minutes: 225
- 10 to 14 minutes: 230
- 15 to 19 minutes: 256
- 20 to 24 minutes: 61
- 25 to 29 minutes: 97
- 30 to 34 minutes: 133
- 35 to 39 minutes: 22
- 40 to 44 minutes: 23
- 45 to 59 minutes: 32
- 60 to 89 minutes: 4
- 90 or more minutes: 0
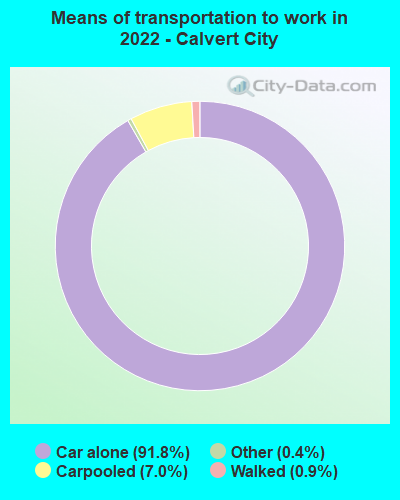
Means of transportation to work:
- Drove a car alone: 4,043 (87.9%)
- Carpooled: 338 (7.4%)
- Taxi: 18 (0.4%)
- Walked: 39 (0.8%)
- Worked at home: 37 (0.8%)
- Unemployment by race in 2022
- Unemployment rate for White non-Hispanic residents
- 3.9%Males
- 1.9%Females
- Unemployment rate for American Indian and Alaska Native residents
- 100.0%Males
- Unemployment rate for two or more race residents
- 100.0%Females

- Year of entry for the foreign-born population in Calvert City, Kentucky
- 02010 or later
- 02000 to 2009
- 01990 to 1999
- 01980 to 1989
- 51970 to 1979
- 7Before 1970

First ancestries reported:
- English: 306 (28.8%)
- American: 220 (20.7%)
- German: 120 (11.3%)
- Scottish: 92 (8.7%)
- European: 53 (5.0%)
- Irish: 39 (3.7%)
- Welsh: 30 (2.8%)
- Scotch-Irish: 25 (2.4%)
- British: 24 (2.3%)
- Italian: 7 (0.7%)
- Hungarian: 5 (0.5%)
- French: 4 (0.4%)
- French Canadian: 4 (0.4%)
Most common places of birth for foreign-born residents (%):
| Calvert City: | 92.3% (12) |
| Kentucky: | 2.9% (5,302) |
Place of birth for U.S.-born residents:
- This state: 1,645
- Other state: 879
- Northeast: 100
- Midwest: 209
- South: 503
- West: 67
89.7% of Calvert City residents lived in the same house 1 years ago.
Out of people who lived in different houses, 40.0% lived in this county.
Out of people who lived in different counties, 41.9% lived in Kentucky.
| Calvert City: | 89.7% |
| State average: | 87.2% |
Education attainment for males 25 years and older:
- No schooling: 3
- Nursery to 4th grade: 0
- 5th and 6th grade: 9
- 7th and 8th grade: 2
- 9th grade: 10
- 10th grade: 5
- 11th grade: 17
- 12th grade, no diploma: 12
- High school graduate (or equivalency): 168
- Less than 1 year of college: 75
- Some college more than 1 year, no degree: 126
- Associate degree: 65
- Bachelor's degree: 115
- Master's degree: 67
- Professional school degree: 11
- Doctorate degree: 3

Education attainment for females 25 years and older:
- No schooling: 4
- Nursery to 4th grade: 0
- 5th and 6th grade: 14
- 7th and 8th grade: 22
- 9th grade: 2
- 10th grade: 49
- 11th grade: 2
- 12th grade, no diploma: 0
- High school graduate (or equivalency): 262
- Less than 1 year of college: 273
- Some college more than 1 year, no degree: 98
- Associate degree: 65
- Bachelor's degree: 112
- Master's degree: 71
- Professional school degree: 16
- Doctorate degree: 4

Housing units in structures:
- One, detached: 964
- Two: 32
- 3 or 4: 29
- 5 to 9: 99
- 20 to 49: 32
- Mobile homes: 89
House/condo owner moved in on average 14 years ago
Renter moved in on average 1 years ago


- 57.3%Utility gas
- 39.6%Electricity
- 1.7%Bottled, tank, or LP gas
- 0.7%Coal or coke
- 0.7%Wood

- 51.8%Electricity
- 44.4%Utility gas
- 2.9%Bottled, tank, or LP gas
- 0.8%No fuel used
Private vs. public school enrollment:
| Here: | 30.3% |
| Kentucky: | 17.2% |
| Here: | 7.2% |
| Kentucky: | 15.2% |
| Here: | 0.0% |
| Kentucky: | 19.6% |


