Camp Pendleton South, CA (California) Houses and Residents
| Camp Pendleton South: | |
| California: |
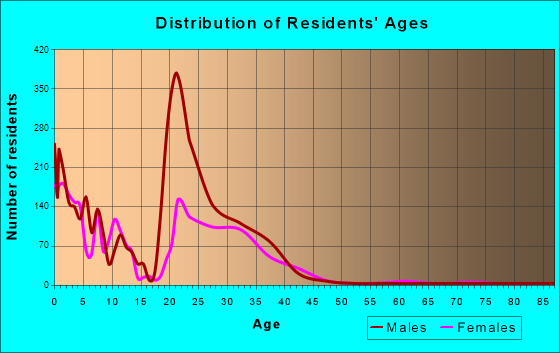
Total population: 10,616 (Urban population: 8,938, Rural population: 0)
Houses: 5,013 (4,308 occupied: 45 owner occupied, 4,289 renter occupied)
| % of renters here: | 99% |
| State: | 44% |
Housing density: 1,307 houses/condos per square mile
Median price asked for vacant for-sale houses and condos in 2022 in this county: $1,340,665.
Median contract rent in 2022: over $2,000 (lower quartile is over $2,000, upper quartile is over $2,000)
Median rent asked for vacant for-rent units in 2022: $2,291
Median gross rent in Camp Pendleton South, CA in 2022: over $2,000
Housing units in Camp Pendleton South with a mortgage: 0 (0 second mortgage, 0 home equity loan, 0 both second mortgage and home equity loan)
Houses without a mortgage: 0
Compare current foreclosures near Camp Pendleton South, CA:
| Photo | Address | Area | Beds / Baths | Price | Details |
|---|---|---|---|---|---|

|
#1
Diamond Way Apt 249
Vista, CA 92083
|
878 sq. feet
|
2 baths 2 beds |
show details | |

|
#2
Playa Rd
Carlsbad, CA 92009
|
3,476 sq. feet
|
3 baths 4 beds |
show details | |

|
#3
Vista Del Rio Way Unit 2
Oceanside, CA 92057
|
1,224 sq. feet
|
2 baths 2 beds |
show details | |

|
#4
La Morre Rd #11
San Marcos, CA 92078
|
1,792 sq. feet
|
2 baths 3 beds |
show details | |

|
#5
Seacrest Ct
Vista, CA 92081
|
1,535 sq. feet
|
2 baths 3 beds |
show details | |

|
#6
Palomar Dr
San Marcos, CA 92069
|
1,515 sq. feet
|
2 baths 4 beds |
show details | |

|
#7
Dartmoor Cir
Oceanside, CA 92057
|
2,136 sq. feet
|
3 baths 4 beds |
show details | |

|
#8
Sitio Caliente
Carlsbad, CA 92009
|
3,563 sq. feet
|
5 baths 5 beds |
show details | |

|
#9
Via Oeste Dr
Fallbrook, CA 92028
|
4,650 sq. feet
|
3 baths 5 beds |
show details | |

|
#10
Avocado Ln
Carlsbad, CA 92008
|
2,062 sq. feet
|
3 baths 4 beds |
show details |
| Photo | Address | Area | Beds / Baths | Price | Details |
|---|---|---|---|---|---|

|
#11
Parkview Dr
Oceanside, CA 92057
|
3,014 sq. feet
|
4 baths 4 beds |
show details | |

|
#12
Calle Buena Ventura
Oceanside, CA 92056
|
1,498 sq. feet
|
2 baths 3 beds |
show details | |

|
#13
Longfellow Ct
Oceanside, CA 92057
|
2,394 sq. feet
|
2 baths 3 beds |
show details | |

|
#14
Amber Ln
Carlsbad, CA 92009
|
4,745 sq. feet
|
5 baths 5 beds |
show details | |

|
#15
Harriet St
Oceanside, CA 92056
|
1,612 sq. feet
|
2 baths 3 beds |
show details | |

|
#16
Montage Rd
Oceanside, CA 92057
|
1,957 sq. feet
|
2 baths 4 beds |
show details | |

|
#17
Fieldgate Rd
Oceanside, CA 92056
|
1,658 sq. feet
|
2 baths 3 beds |
show details | |

|
#18
Goldstone Rd
Carlsbad, CA 92009
|
3,424 sq. feet
|
4 baths 4 beds |
show details | |

|
#19
Marabou Ln
Vista, CA 92083
|
1,177 sq. feet
|
2 baths 3 beds |
show details | |

|
#20
Ranch View Rd
Oceanside, CA 92057
|
2,747 sq. feet
|
3 baths 4 beds |
show details |
| Photo | Address | Area | Beds / Baths | Price | Details |
|---|---|---|---|---|---|

|
#21
Tylee St
Vista, CA 92083
|
1,120 sq. feet
|
1 baths 3 beds |
show details | |

|
#22
Kipling Ln
Carlsbad, CA 92008
|
1,440 sq. feet
|
2 baths 2 beds |
show details | |

|
#23
Triton Cir
Encinitas, CA 92024
|
1,815 sq. feet
|
2 baths 3 beds |
show details | |

|
#24
Shetland Way
Fallbrook, CA 92028
|
1,564 sq. feet
|
2 baths 3 beds |
show details | |

|
#25
Majella Rd
Vista, CA 92084
|
1,676 sq. feet
|
3 baths 4 beds |
show details | |

|
#26
Discovery St Spc 41
San Marcos, CA 92078
|
1,536 sq. feet
|
2 baths 2 beds |
show details | |

|
#27
Spring Creek Ln
Oceanside, CA 92057
|
1,304 sq. feet
|
2 baths 3 beds |
show details | |

|
#28
Athos Way
Oceanside, CA 92056
|
1,807 sq. feet
|
2 baths 2 beds |
show details | |

|
#29
Weatherwood Ct
San Marcos, CA 92078
|
2,847 sq. feet
|
2 baths 4 beds |
show details | |

|
#30
Nanday Ct
Oceanside, CA 92057
|
3,136 sq. feet
|
3 baths 4 beds |
show details |
| Photo | Address | Area | Beds / Baths | Price | Details |
|---|---|---|---|---|---|

|
#31
Sunbeam Ln
Fallbrook, CA 92028
|
2,496 sq. feet
|
4 baths 3 beds |
show details | |

|
#32
El Vallecito
Vista, CA 92083
|
1,318 sq. feet
|
2 baths 3 beds |
show details | |

|
#33
W Fig St
Fallbrook, CA 92028
|
1,350 sq. feet
|
2 baths 3 beds |
show details | |

|
#34
Hancock Cir
Oceanside, CA 92056
|
1,370 sq. feet
|
2 baths 3 beds |
show details | |

|
#35
Knollwood Dr
Carlsbad, CA 92010
|
3,102 sq. feet
|
3 baths 5 beds |
show details | |

|
#36
Seabreeze Walk
Oceanside, CA 92056
|
1,101 sq. feet
|
2 baths 3 beds |
show details | |

|
#37
Raquel Dr
Oceanside, CA 92056
|
827 sq. feet
|
1 baths 2 beds |
show details | |

|
#38
Terrace Pl
Carlsbad, CA 92010
|
3,315 sq. feet
|
3 baths 5 beds |
show details | |

|
#39
Del Este Way
Oceanside, CA 92056
|
1,101 sq. feet
|
2 baths 3 beds |
show details | |

|
#40
Cameo Dr
Vista, CA 92083
|
2,049 sq. feet
|
3 baths 4 beds |
show details |
| Photo | Address | Area | Beds / Baths | Price | Details |
|---|---|---|---|---|---|

|
#41
Avenida Campana
Fallbrook, CA 92028
|
1,518 sq. feet
|
2 baths 3 beds |
show details | |

|
#42
Angelina Rd
Oceanside, CA 92056
|
2,312 sq. feet
|
2 baths 4 beds |
show details | |

|
#43
Promenade Cir
Vista, CA 92083
|
1,426 sq. feet
|
2 baths 3 beds |
show details | |

|
#44
Arcadia Rd
Encinitas, CA 92024
|
2,276 sq. feet
|
3 baths 5 beds |
show details | |

|
#45
Tennis Match Way
Encinitas, CA 92024
|
1,929 sq. feet
|
2 baths 4 beds |
show details | |

|
#46
E Clemmens Ln
Fallbrook, CA 92028
|
1,600 sq. feet
|
2 baths 3 beds |
show details | |

|
#47
Greenway Rd
Oceanside, CA 92057
|
3,300 sq. feet
|
4 baths 4 beds |
show details | |

|
#48
Aubergine Ct
Oceanside, CA 92056
|
1,839 sq. feet
|
2 baths 4 beds |
show details | |

|
#49
Palmera Dr
Oceanside, CA 92056
|
2,057 sq. feet
|
2 baths 4 beds |
show details | |

|
Check over 1 million property listings on Foreclosure.com!
|
browse all offers | |||


 | Military Move/Dilemma (19 replies) |
Household type by relationship:
Households: 13,878- Male householders: 3,384 (139 living alone), Female householders: 848 (95 living alone)
3,818 spouses (3,818 opposite-sex spouses), 0 unmarried partners, (0 opposite-sex unmarried partners), 4,868 children (4,179 natural, 0 adopted, 689 stepchildren), 0 grandchildren, 0 brothers or sisters, 51 parents, 0 foster children, 0 other relatives, 51 non-relatives
- In group quarters: 855
Size of family households: 1,537 2-persons, 1,131 3-persons, 605 4-persons, 424 5-persons, 331 6-persons.
Size of nonfamily households: 241 1-person, 37 2-persons.
4,553 married couples with children.
231 single-parent households (39 men, 192 women).
75.3% of residents of Camp Pendleton South speak English at home.
19.1% of residents speak Spanish at home (83% speak English very well, 16% speak English well, 1% speak English not well).
0.6% of residents speak other Indo-European language at home (100% speak English very well).
3.5% of residents speak Asian or Pacific Island language at home (70% speak English very well, 30% speak English well).
Foreign born population: 867 (6.2%)
(85.6% of them are naturalized citizens)
| Here: | -666666666.0 |
| State: | 6.0 |
| Here: | 6.1 |
| State: | 3.9 |

- Bedrooms in owner-occupied houses and condos in Camp Pendleton South, California
- 0no bedroom
- 01 bedroom
- 462 bedrooms
- 03 bedrooms
- 04 bedrooms
- 05+ bedrooms

- Bedrooms in renter-occupied apartments in Camp Pendleton South, California
- 64no bedroom
- 01 bedroom
- 1,0652 bedrooms
- 2,1743 bedrooms
- 9874 bedrooms
- 05+ bedrooms

- Cars and other vehicles available in Camp Pendleton South in owner-occupied houses/condos
- 0no vehicle
- 461 vehicle
- 02 vehicles
- 03 vehicles
- 04 vehicles
- 05+ vehicles

- Cars and other vehicles available in Camp Pendleton South in renter-occupied apartments
- 91no vehicle
- 3761 vehicle
- 3,3432 vehicles
- 3373 vehicles
- 1304 vehicles
- 135+ vehicles

- Rooms in owner-occupied houses in Camp Pendleton South, California
- 01 room
- 02 rooms
- 03 rooms
- 04 rooms
- 05 rooms
- 06 rooms
- 07 rooms
- 468 rooms
- 09+ rooms

- Rooms in renter-occupied apartments in Camp Pendleton South, California
- 01 room
- 642 rooms
- 953 rooms
- 4464 rooms
- 7635 rooms
- 1,3936 rooms
- 9457 rooms
- 3528 rooms
- 2339+ rooms

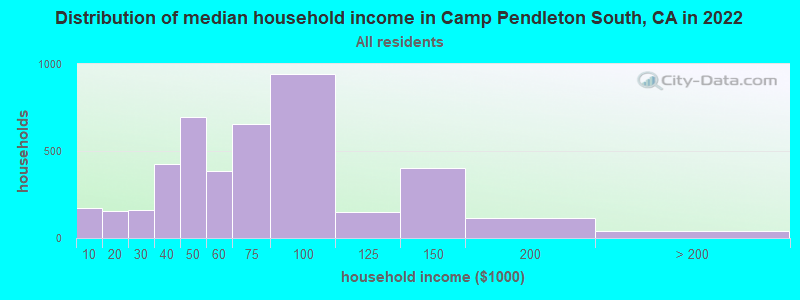
Camp Pendleton South, CA household income distribution

- 171Less than $10,000
- 155$10,000 to $19,999
- 163$20,000 to $29,999
- 428$30,000 to $39,999
- 698$40,000 to $49,999
- 387$50,000 to $59,999
- 658$60,000 to $74,999
- 944$75,000 to $99,999
- 150$100,000 to $124,999
- 404$125,000 to $149,999
- 114$150,000 to $199,999
- 40$200,000 or more
Rent paid by renters in 2022 in Camp Pendleton South, CA
-
- 59Less than $100
- 74$750 to $799
- 46$1,000 to $1,249
- 195$1,250 to $1,499
- 139$1,500 to $1,999
- 668$2,000 to $2,499
- 1,503$2,500 to $2,999
- 1,068$3,000 to $3,499
- 700$3,500 or more
- 70No cash rent


Percentage of workers working in this county: 97.3%
Number of people working at home: 552 (8.0% of all workers)
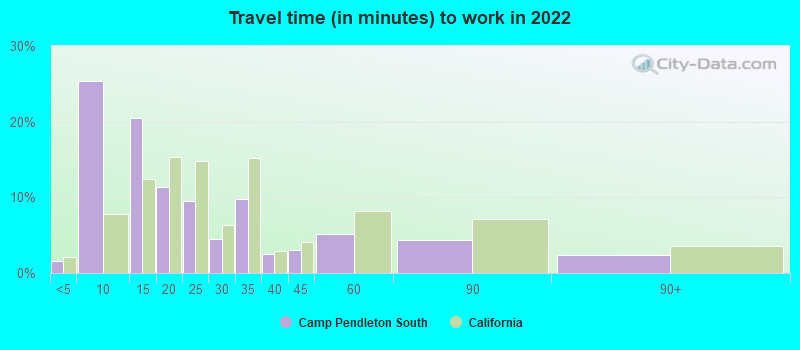
Travel time to work (commute)
- Less than 5 minutes: 82
- 5 to 9 minutes: 776
- 10 to 14 minutes: 985
- 15 to 19 minutes: 935
- 20 to 24 minutes: 1,050
- 25 to 29 minutes: 318
- 30 to 34 minutes: 832
- 35 to 39 minutes: 236
- 40 to 44 minutes: 193
- 45 to 59 minutes: 383
- 60 to 89 minutes: 309
- 90 or more minutes: 26
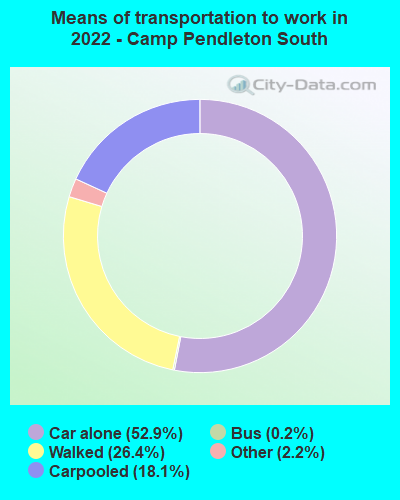
Means of transportation to work:
- Drove a car alone: 14,644 (49.5%)
- Carpooled: 5,237 (17.7%)
- Bus: 62 (0.2%)
- Long-distance train or commuter rail: 9 (0.0%)
- Light rail, streetcar or trolley: 10 (0.0%)
- Taxi: 635 (2.1%)
- Bicycle: 18 (0.1%)
- Walked: 8,084 (27.3%)
- Worked at home: 552 (1.9%)

- Unemployment by race in 2022
- Unemployment rate for White non-Hispanic residents
- 9.5%Females
- Unemployment rate for American Indian and Alaska Native residents
- 93.3%Males
- Unemployment rate for two or more race residents
- 40.2%Females
- Unemployment rate for Hispanic or Latino residents
- 41.6%Males
- 20.1%Females

- Year of entry for the foreign-born population in Camp Pendleton South, California
- 3852010 or later
- 1712000 to 2009
- 1701990 to 1999
- 2391980 to 1989
- 1251970 to 1979
- 31Before 1970

First ancestries reported:
- Jamaican: 510 (7.4%)
- German: 422 (6.1%)
- European: 315 (4.6%)
- Norwegian: 299 (4.3%)
- American: 248 (3.6%)
- Irish: 223 (3.2%)
- English: 219 (3.2%)
- African: 102 (1.5%)
- Ukrainian: 80 (1.2%)
- Italian: 71 (1.0%)
- Dutch: 61 (0.9%)
- Scandinavian: 41 (0.6%)
- French Canadian: 37 (0.5%)
- Czech: 33 (0.5%)
- Czechoslovakian: 33 (0.5%)
- Scottish: 31 (0.5%)
- Macedonian: 14 (0.2%)
- Polish: 13 (0.2%)
- Kenyan: 11 (0.2%)
- French: 9 (0.1%)
- Brazilian: 6 (0.09%)
- Slovene: 4 (0.06%)
- Swedish: 4 (0.06%)
Most common places of birth for foreign-born residents (%):
| Camp Pendleton South: | 34.8% (302) |
| California: | 0.2% (15,939) |
| Camp Pendleton South: | 30.8% (267) |
| California: | 7.8% (818,297) |
| Camp Pendleton South: | 26.1% (226) |
| California: | 37.2% (3,881,193) |
| Camp Pendleton South: | 22.7% (197) |
| California: | 0.1% (5,643) |
| Camp Pendleton South: | 4.4% (38) |
| California: | 6.6% (684,672) |
| Camp Pendleton South: | 4.2% (36) |
| California: | 0.3% (30,441) |
Place of birth for U.S.-born residents:
- This state: 3,829
- Other state: 7,952
- Northeast: 657
- Midwest: 1,780
- South: 3,174
- West: 2,318
58.5% of Camp Pendleton South residents lived in the same house 1 years ago.
Out of people who lived in different houses, 20.3% lived in this county.
Out of people who lived in different counties, 25.2% lived in California.
| Camp Pendleton South: | 58.5% |
| State average: | 88.9% |
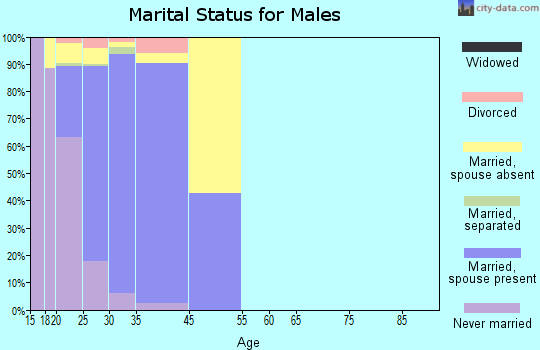
Education attainment for males 25 years and older:
- No schooling: 13
- Nursery to 4th grade: 0
- 5th and 6th grade: 0
- 7th and 8th grade: 0
- 9th grade: 0
- 10th grade: 0
- 11th grade: 0
- 12th grade, no diploma: 0
- High school graduate (or equivalency): 909
- Less than 1 year of college: 469
- Some college more than 1 year, no degree: 374
- Associate degree: 252
- Bachelor's degree: 660
- Master's degree: 161
- Professional school degree: 53
- Doctorate degree: 0

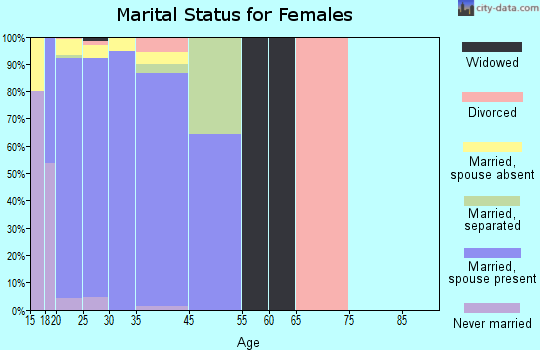
Education attainment for females 25 years and older:
- No schooling: 0
- Nursery to 4th grade: 0
- 5th and 6th grade: 0
- 7th and 8th grade: 0
- 9th grade: 26
- 10th grade: 0
- 11th grade: 0
- 12th grade, no diploma: 59
- High school graduate (or equivalency): 465
- Less than 1 year of college: 469
- Some college more than 1 year, no degree: 670
- Associate degree: 309
- Bachelor's degree: 476
- Master's degree: 167
- Professional school degree: 40
- Doctorate degree: 0

Housing units in structures:
- One, detached: 590
- One, attached: 3,257
- Two: 412
- 3 or 4: 664
- 5 to 9: 89

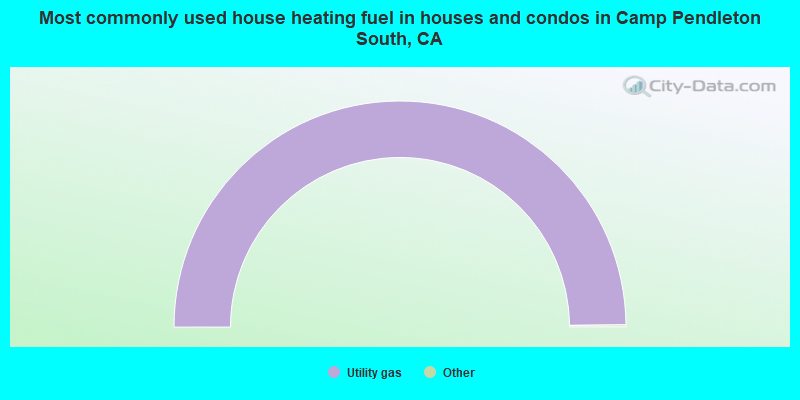
- 100.0%Utility gas
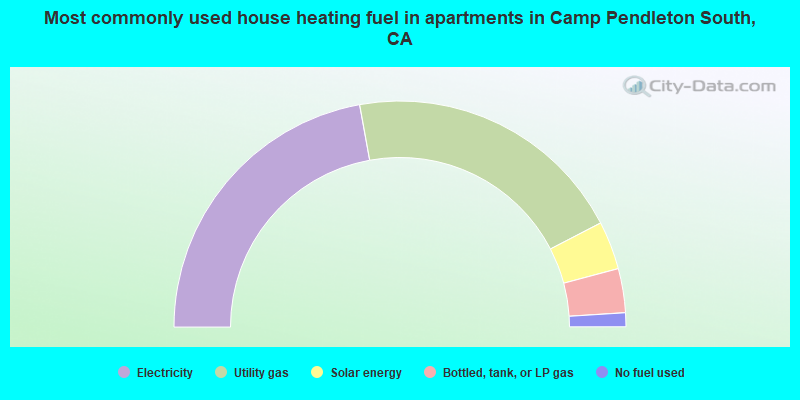
- 44.3%Electricity
- 40.5%Utility gas
- 6.9%Solar energy
- 6.3%Bottled, tank, or LP gas
- 2.0%No fuel used
Private vs. public school enrollment:
| Here: | 14.6% |
| California: | 10.5% |
| Here: | 0.0% |
| California: | 8.5% |
| Here: | 32.9% |
| California: | 15.9% |


