Camp Springs, MD (Maryland) Houses and Residents
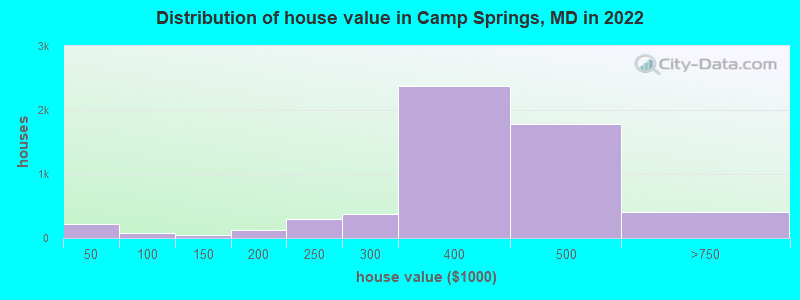
Estimated median house or condo value in 2022: $385,321 (it was $157,000 in 2000 )
Camp Springs:
$385,321Maryland:
$398,100
Lower value quartile - upper value quartile: $321,007 - $455,946Mean price in 2022: Detached houses: $342,646 Here:
$342,646State:
$526,819
Townhouses or other attached units: $369,593 Here:
$369,593State:
$328,305
In 5-or-more-unit structures: $255,264 Here:
$255,264State:
$350,378
Total population: 19,096 (Urban population: 17,814, Rural population: 0)
Houses: 9,044 (8,590 occupied: 5,991 owner occupied, 2,638 renter occupied )
% of renters here:
31%State:
32%
Housing density: 1,246 houses/condos per square mile
Median price asked for vacant for-sale houses and condos in 2022: $276,403.
Median contract rent in 2022: $1,989 (lower quartile is $1,644, upper quartile is over $2,000)
Median rent asked for vacant for-rent units in 2022: $2,589
Median gross rent in Camp Springs, MD in 2022: over $2,000
Housing units in Camp Springs with a mortgage: 4,863 (431 second mortgage, 22 home equity loan, 264 both second mortgage and home equity loan )Houses without a mortgage: 75
Median household income for houses/condos with a mortgage: $126,096
Median household income for apartments without a mortgage: $106,021
Median monthly housing costs: $1,994
Data:
Median house or condo value ($)
Median house or condo value ($ change since 2000)
Median house or condo value ($) - White
Median house or condo value ($) - Black or African American
Median house or condo value ($) - Asian
Median house or condo value ($) - Hispanic or Latino
Median house or condo value ($) - American Indian and Alaska Native
Median house or condo value ($) - Multirace
Median house or condo value ($) - Other Race
Median price asked for mobile homes ($)
Household density (households per square mile)
Mean house or condo value by units in structure - 1, detached ($)
Mean house or condo value by units in structure - 1, attached ($)
Mean house or condo value by units in structure - 2 ($)
Mean house or condo value by units in structure by units in structure - 3 or 4 ($)
Mean house or condo value by units in structure - 5 or more ($)
Mean house or condo value by units in structure - Boat, RV, van, etc. ($)
Mean house or condo value by units in structure - Mobile home ($)
Median contract rent ($)
Median contract rent - Lower quartile ($)
Median contract rent - Upper quartile ($)
Median gross rent ($)
Urban houses (%)
Rural houses (%)
Houses occupied (%)
Houses occupied (% change since 2000)
Houses owner occupied (%)
Houses owner occupied (% change since 2000)
Houses renter occupied (%)
Houses renter occupied (% change since 2000)
Vacant housing units - For rent (%)
Vacant housing units - For rent (% change since 2000)
Vacant housing units - For sale only (%)
Vacant housing units - For sale only (% change since 2000)
Vacant housing units - Rented or sold, not occupied (%)
Vacant housing units - Rented or sold, not occupied (% change since 2000)
Vacant housing units - For seasonal, recreational, or occasional use (%)
Vacant housing units - For seasonal, recreational, or occasional use (% change since 2000)
Vacant housing units - For migrant workers (%)
Vacant housing units - For migrant workers (% change since 2000)
Vacant housing units - Other vacant (%)
Vacant housing units - Other vacant (% change since 2000)
Median monthly housing costs ($)
Median household income for houses/condos with a mortgage ($)
Median household income for houses/condos without a mortgage ($)
Median household income ($)
Median household income ($) - White
Median household income ($) - Black or African American
Median household income ($) - Asian
Median household income ($) - Hispanic or Latino
Median household income ($) - American Indian and Alaska Native
Median household income ($) - Multirace
Median household income ($) - Other Race
Mortgage status - with mortgage (%)
Mortgage status - with second mortgage (%)
Mortgage status - with home equity loan (%)
Mortgage status - with both second mortgage and home equity loan (%)
Mortgage status - without a mortgage (%)
Median year house/condo built
Median year apartment built
Household type by relationship - Male householder living alone (%)
Household type by relationship - Male householder not living alone (%)
Household type by relationship - Female householder living alone (%)
Household type by relationship - Female householder not living alone (%)
Household type by relationship - Opposite-Sex spouse (%)
Household type by relationship - Same-Sex spouse (%)
Household type by relationship - Opposite-Sex unmarried partner (%)
Household type by relationship - Same-Sex unmarried partner (%)
Household type by relationship - In group quarters (%)
Size of family households - 2-person household (%)
Size of family households - 3-person household (%)
Size of family households - 4-person household (%)
Size of family households - 5-person household (%)
Size of family households - 6-person household (%)
Size of family households - 7-or-more-person household (%)
Size of nonfamily households - 1-person household (%)
Size of nonfamily households - 2-person household (%)
Size of nonfamily households - 3-person household (%)
Size of nonfamily households - 4-person household (%)
Size of nonfamily households - 5-person household (%)
Size of nonfamily households - 6-person household (%)
Size of nonfamily households - 7-or-moreperson household (%)
Year house built - Built 2010 or later (%)
Year house built - Built 2000 to 2009 (%)
Year house built - Built 1990 to 1999 (%)
Year house built - Built 1980 to 1989 (%)
Year house built - Built 1970 to 1979 (%)
Year house built - Built 1960 to 1969 (%)
Year house built - Built 1950 to 1959 (%)
Year house built - Built 1940 to 1949 (%)
Year house built - Built 1939 or earlier (%)
Median number of rooms in houses and condos
Median number of rooms in apartments
Median number of bedrooms in owner occupied houses
Mean number of bedrooms in owner occupied houses
Median number of bedrooms in renter occupied houses
Mean number of bedrooms in renter occupied houses
Median number of vehichles in owner occupied houses
Mean number of vehichles in owner occupied houses
Median number of vehichles in renter occupied houses
Mean number of vehichles in renter occupied houses
Rooms in owner-occupied houses - 1 room (%)
Rooms in owner-occupied houses - 2 rooms (%)
Rooms in owner-occupied houses - 3 rooms (%)
Rooms in owner-occupied houses - 4 rooms (%)
Rooms in owner-occupied houses - 5 rooms (%)
Rooms in owner-occupied houses - 6 rooms (%)
Rooms in owner-occupied houses - 7 rooms (%)
Rooms in owner-occupied houses - 8 rooms (%)
Rooms in owner-occupied houses - 9+ rooms (%)
Rooms in renter-occupied houses - 1 room (%)
Rooms in renter-occupied houses - 2 rooms (%)
Rooms in renter-occupied houses - 3 rooms (%)
Rooms in renter-occupied houses - 4 rooms (%)
Rooms in renter-occupied houses - 5 rooms (%)
Rooms in renter-occupied houses - 6 rooms (%)
Rooms in renter-occupied houses - 7 rooms (%)
Rooms in renter-occupied houses - 8 rooms (%)
Rooms in renter-occupied houses - 9+ rooms (%)
Bedrooms in owner-occupied houses - no bedrooms (%)
Bedrooms in owner-occupied houses - 1 bedroom (%)
Bedrooms in owner-occupied houses - 2 bedrooms (%)
Bedrooms in owner-occupied houses - 3 bedrooms (%)
Bedrooms in owner-occupied houses - 4 bedrooms (%)
Bedrooms in owner-occupied houses - 5+ bedrooms (%)
Bedrooms in renter-occupied houses - no bedrooms (%)
Bedrooms in renter-occupied houses - 1 bedroom (%)
Bedrooms in renter-occupied houses - 2 bedrooms (%)
Bedrooms in renter-occupied houses - 3 bedrooms (%)
Bedrooms in renter-occupied houses - 4 bedrooms (%)
Bedrooms in renter-occupied houses - 5+ bedrooms (%)
Vehicles available in owner-occupied houses - no vehicle available (%)
Vehicles available in owner-occupied houses - 1 vehicle available(%)
Vehicles available in owner-occupied houses - 2 Vehicles available (%)
Vehicles available in owner-occupied houses - 3 Vehicles available (%)
Vehicles available in owner-occupied houses - 4 Vehicles available (%)
Vehicles available in owner-occupied houses - 5+ Vehicles available (%)
Vehicles available in renter-occupied houses - no vehicle available (%)
Vehicles available in renter-occupied houses - 1 vehicle available (%)
Vehicles available in renter-occupied houses - 2 Vehicles available (%)
Vehicles available in renter-occupied houses - 3 Vehicles available (%)
Vehicles available in renter-occupied houses - 4 Vehicles available (%)
Vehicles available in renter-occupied houses - 5+ Vehicles available (%)
Housing units in structures - 1, detached (%)
Housing units in structures - 1, attached (%)
Housing units in structures - 2 (%)
Housing units in structures - 3 or 4 (%)
Housing units in structures - 5 to 9 (%)
Housing units in structures - 10 to 19 (%)
Housing units in structures - 20 to 49 (%)
Housing units in structures - 50 or more (%)
Housing units in structures - Mobile home (%)
Housing units in structures - Boat, RV, van, etc. (%)
Housing units in structures - Owners - 1, detached (%)
Housing units in structures - Owners - 1, attached (%)
Housing units in structures - Owners - 2 (%)
Housing units in structures - Owners - 3 or 4 (%)
Housing units in structures - Owners - 5 to 9 (%)
Housing units in structures - Owners - 10 to 19 (%)
Housing units in structures - Owners - 20 to 49 (%)
Housing units in structures - Owners - 50 or more (%)
Housing units in structures - Owners - Mobile home (%)
Housing units in structures - Owners - Boat, RV, van, etc. (%)
Housing units in structures - Renters - 1, detached (%)
Housing units in structures - Renters - 1, attached (%)
Housing units in structures - Renters - 2 (%)
Housing units in structures - Renters - 3 or 4 (%)
Housing units in structures - Renters - 5 to 9 (%)
Housing units in structures - Renters - 10 to 19 (%)
Housing units in structures - Renters - 20 to 49 (%)
Housing units in structures - Renters - 50 or more (%)
Housing units in structures - Renters - Mobile home (%)
Housing units in structures - Renters - Boat, RV, van, etc. (%)
House/condo owner moved in on average (years ago)
Renter moved in on average (years ago)
Year householder moved into unit - Moved in 1999 to March 2000 (%)
Year householder moved into unit - Moved in 1999 to March 2000 (%) - White
Year householder moved into unit - Moved in 1999 to March 2000 (%) - Black or African American
Year householder moved into unit - Moved in 1999 to March 2000 (%) - Asian
Year householder moved into unit - Moved in 1999 to March 2000 (%) - Hispanic or Latino
Year householder moved into unit - Moved in 1999 to March 2000 (%) - American Indian and Alaska Native
Year householder moved into unit - Moved in 1999 to March 2000 (%) - Multirace
Year householder moved into unit - Moved in 1999 to March 2000 (%) - Other Race
Year householder moved into unit - Moved in 1995 to 1998 (%)
Year householder moved into unit - Moved in 1995 to 1998 (%) - White
Year householder moved into unit - Moved in 1995 to 1998 (%) - Black or African American
Year householder moved into unit - Moved in 1995 to 1998 (%) - Asian
Year householder moved into unit - Moved in 1995 to 1998 (%) - Hispanic or Latino
Year householder moved into unit - Moved in 1995 to 1998 (%) - American Indian and Alaska Native
Year householder moved into unit - Moved in 1995 to 1998 (%) - Multirace
Year householder moved into unit - Moved in 1995 to 1998 (%) - Other Race
Year householder moved into unit - Moved in 1990 to 1994 (%)
Year householder moved into unit - Moved in 1990 to 1994 (%) - White
Year householder moved into unit - Moved in 1990 to 1994 (%) - Black or African American
Year householder moved into unit - Moved in 1990 to 1994 (%) - Asian
Year householder moved into unit - Moved in 1990 to 1994 (%) - Hispanic or Latino
Year householder moved into unit - Moved in 1990 to 1994 (%) - American Indian and Alaska Native
Year householder moved into unit - Moved in 1990 to 1994 (%) - Multirace
Year householder moved into unit - Moved in 1990 to 1994 (%) - Other Race
Year householder moved into unit - Moved in 1980 to 1989 (%)
Year householder moved into unit - Moved in 1980 to 1989 (%) - White
Year householder moved into unit - Moved in 1980 to 1989 (%) - Black or African American
Year householder moved into unit - Moved in 1980 to 1989 (%) - Asian
Year householder moved into unit - Moved in 1980 to 1989 (%) - Hispanic or Latino
Year householder moved into unit - Moved in 1980 to 1989 (%) - American Indian and Alaska Native
Year householder moved into unit - Moved in 1980 to 1989 (%) - Multirace
Year householder moved into unit - Moved in 1980 to 1989 (%) - Other Race
Year householder moved into unit - Moved in 1970 to 1979 (%)
Year householder moved into unit - Moved in 1970 to 1979 (%) - White
Year householder moved into unit - Moved in 1970 to 1979 (%) - Black or African American
Year householder moved into unit - Moved in 1970 to 1979 (%) - Asian
Year householder moved into unit - Moved in 1970 to 1979 (%) - Hispanic or Latino
Year householder moved into unit - Moved in 1970 to 1979 (%) - American Indian and Alaska Native
Year householder moved into unit - Moved in 1970 to 1979 (%) - Multirace
Year householder moved into unit - Moved in 1970 to 1979 (%) - Other Race
Year householder moved into unit - Moved in 1969 or earlier (%)
Year householder moved into unit - Moved in 1969 or earlier (%) - White
Year householder moved into unit - Moved in 1969 or earlier (%) - Black or African American
Year householder moved into unit - Moved in 1969 or earlier (%) - Asian
Year householder moved into unit - Moved in 1969 or earlier (%) - Hispanic or Latino
Year householder moved into unit - Moved in 1969 or earlier (%) - American Indian and Alaska Native
Year householder moved into unit - Moved in 1969 or earlier (%) - Multirace
Year householder moved into unit - Moved in 1969 or earlier (%) - Other Race
Housing units lacking complete plumbing facilities (%)
Housing units lacking complete kitchen facilities (%)
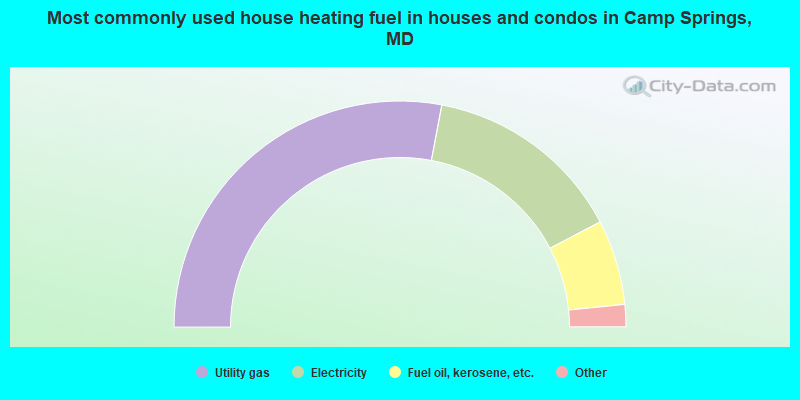
House heating fuel used in houses and condos - Utility gas (%)
House heating fuel used in houses and condos - Bottled, tank, or LP gas (%)
House heating fuel used in houses and condos - Electricity (%)
House heating fuel used in houses and condos - Fuel oil, kerosene, etc. (%)
House heating fuel used in houses and condos - Coal or coke (%)
House heating fuel used in houses and condos - Wood (%)
House heating fuel used in houses and condos - Solar energy (%)
House heating fuel used in houses and condos - Other fuel (%)
House heating fuel used in houses and condos - No fuel used (%)
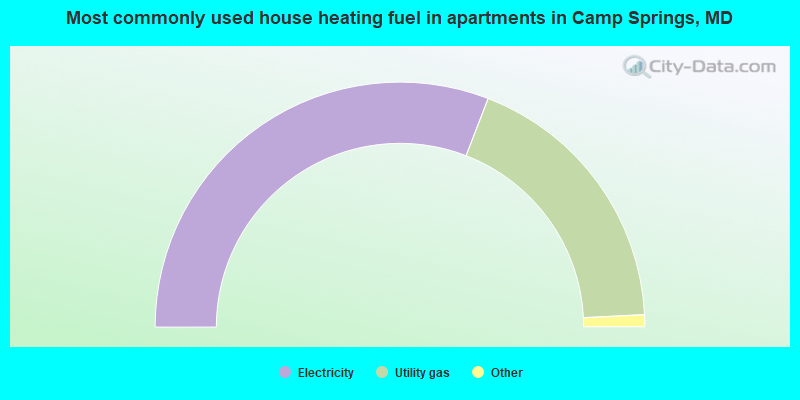
House heating fuel used in apartments - Utility gas (%)
House heating fuel used in apartments - Bottled, tank, or LP gas (%)
House heating fuel used in apartments - Electricity (%)
House heating fuel used in apartments - Fuel oil, kerosene, etc. (%)
House heating fuel used in apartments - Coal or coke (%)
House heating fuel used in apartments - Wood (%)
House heating fuel used in apartments - Solar energy (%)
House heating fuel used in apartments - Other fuel (%)
House heating fuel used in apartments - No fuel used (%)
Median year house/condo built: 1967Median year apartment built: 2002Household type by relationship:
Households: 23,020
Male householders: 4,101 (1,253 living alone ), Female householders: 4,284 (1,363 living alone )3,844 spouses (3,784 opposite-sex spouses ), 478 unmarried partners , (478 opposite-sex unmarried partners ), 6,665 children (6,088 natural , 189 adopted , 386 stepchildren ), 1,195 grandchildren , 409 brothers or sisters , 340 parents , 16 foster children , 773 other relatives , 832 non-relatives In group quarters: 78
Size of family households: 2,033 2-persons , 1,412 3-persons , 1,153 4-persons , 402 5-persons , 246 6-persons , 338 7-or-more-persons .
Size of nonfamily households: 2,575 1-person , 355 2-persons , 78 3-persons , 10 5-persons .
2,315 married couples with children. single-parent households (191 men , 442 women ).
83.6% of residents of Camp Springs speak English at home. of residents speak Spanish at home (37% speak English very well , 30% speak English well , 24% speak English not well , 9% don't speak English at all ).of residents speak other Indo-European language at home (50% speak English very well , 25% speak English well , 25% speak English not well ).of residents speak Asian or Pacific Island language at home (52% speak English very well , 48% speak English well ).of residents speak other language at home (77% speak English very well , 20% speak English well , 3% speak English not well ).
Foreign born population: 2,693 (11.7%)of them are naturalized citizens )
Median number of rooms in houses and condos:
Median number of rooms in apartments
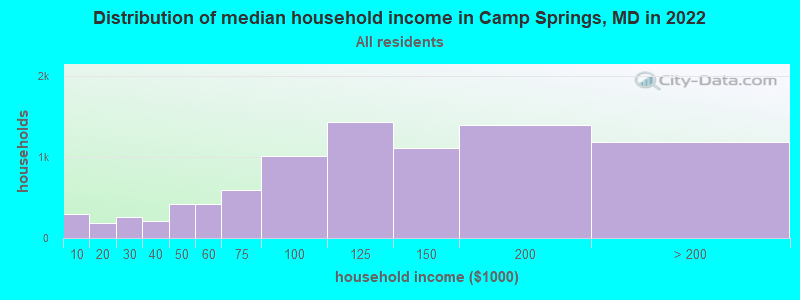
Camp Springs, MD household income distribution 300 Less than $10,000182 $10,000 to $19,999258 $20,000 to $29,999210 $30,000 to $39,999417 $40,000 to $49,999422 $50,000 to $59,999590 $60,000 to $74,9991,015 $75,000 to $99,9991,431 $100,000 to $124,9991,115 $125,000 to $149,9991,400 $150,000 to $199,9991,184 $200,000 or more
Home value of owner - occupied houses in 2022 in Camp Springs, MD 154 Less than $10,00054 $30,000 to $34,9993 $35,000 to $39,9997 $40,000 to $49,99914 $50,000 to $59,99926 $60,000 to $69,99912 $70,000 to $79,99911 $80,000 to $89,99919 $100,000 to $124,99933 $125,000 to $149,99948 $150,000 to $174,99981 $175,000 to $199,999300 $200,000 to $249,999377 $250,000 to $299,9992,375 $300,000 to $399,9991,783 $400,000 to $499,999386 $500,000 to $749,99918 $750,000 to $999,9998 $1,000,000 to $1,499,999Rent paid by renters in 2022 in Camp Springs, MD 92 $1,000 to $1,249189 $1,250 to $1,499738 $1,500 to $1,9991,157 $2,000 to $2,499147 $2,500 to $2,999196 No cash rent
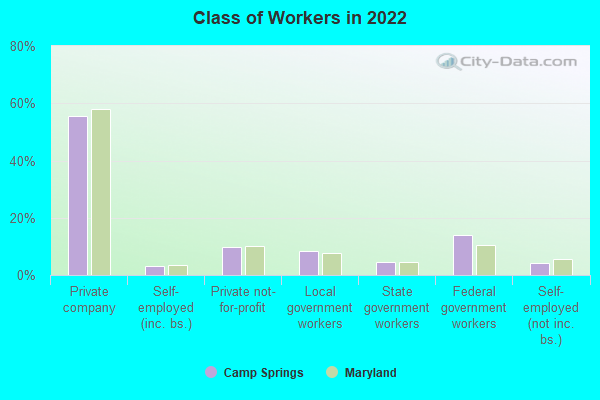
Percentage of workers working in this county: 47.3%Number of people working at home: 1,905 (15.5% of all workers )
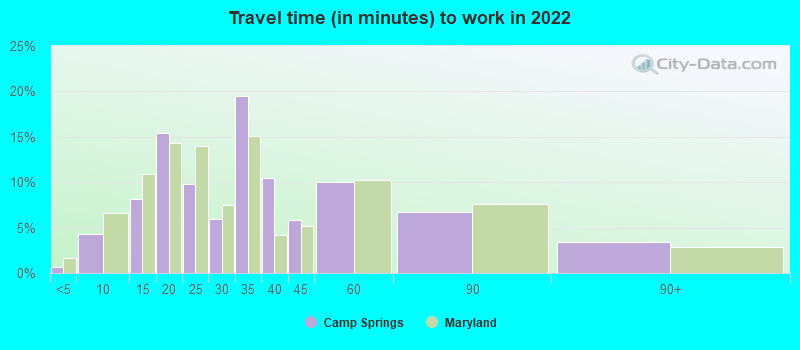
Travel time to work (commute)
Less than 5 minutes: 615 to 9 minutes: 26810 to 14 minutes: 66915 to 19 minutes: 90320 to 24 minutes: 77425 to 29 minutes: 60130 to 34 minutes: 1,86735 to 39 minutes: 58040 to 44 minutes: 63945 to 59 minutes: 1,96760 to 89 minutes: 1,31890 or more minutes: 578
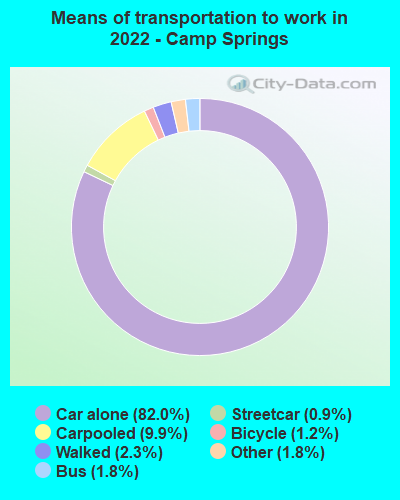
Means of transportation to work:
Drove a car alone: 3,583 (59.2%)Carpooled: 392 (6.5%)Bus : 57 (0.9%)Subway or elevated rail : 27 (0.4%)Taxi: 97 (1.6%)Bicycle: 56 (0.9%)Walked: 101 (1.7%)Worked at home: 1,905 (31.5%)
Unemployment by race in 2022
Unemployment rate for White non-Hispanic residents 8.8% FemalesUnemployment rate for Black residents 4.8% Males3.0% FemalesUnemployment rate for other race residents 1.7% MalesUnemployment rate for Hispanic or Latino residents 3.2% Males1.5% Females
Year of entry for the foreign-born population in Camp Springs, Maryland
891 2010 or later 880 2000 to 2009 478 1990 to 1999 300 1980 to 1989 168 1970 to 1979 208 Before 1970
First ancestries reported:
American: 271 (1.6%)
Kenyan: 210 (1.2%)
African: 152 (0.9%)
Irish: 116 (0.7%)
Jamaican: 107 (0.6%)
Nigerian: 94 (0.5%)
West Indian: 87 (0.5%)
Ethiopian: 76 (0.4%)
Swedish: 60 (0.3%)
English: 54 (0.3%)
Guyanese: 52 (0.3%)
Lebanese: 32 (0.2%)
Barbadian: 25 (0.1%)
Trinidadian and Tobagonian: 25 (0.1%)
Sierra Leonean: 23 (0.1%)
European: 19 (0.1%)
German: 11 (0.06%)
Norwegian: 11 (0.06%)
Italian: 10 (0.06%)
Scandinavian: 10 (0.06%)
Polish: 7 (0.04%) Most common places of birth for foreign-born residents (%): El Salvador Camp Springs:
29.7% (789)Maryland:
12.0% (115,412)
Philippines Camp Springs:
10.5% (278)Maryland:
3.8% (36,698)
Nigeria Camp Springs:
5.8% (155)Maryland:
4.6% (44,825)
Guatemala Camp Springs:
5.8% (154)Maryland:
4.4% (42,350)
Mexico Camp Springs:
5.0% (132)Maryland:
3.5% (34,065)
Sierra Leone Camp Springs:
4.1% (110)Maryland:
1.1% (10,233)
Trinidad and Tobago Camp Springs:
3.8% (102)Maryland:
1.2% (11,481)
Jamaica Camp Springs:
3.5% (94)Maryland:
2.8% (27,444)
Kenya Camp Springs:
3.3% (87)Maryland:
0.8% (7,497)
Eritrea Camp Springs:
2.5% (66)Maryland:
0.3% (2,915)
Other Eastern Africa Camp Springs:
2.4% (63)Maryland:
0.2% (2,108)
Cameroon Camp Springs:
2.2% (59)Maryland:
2.5% (23,969)
Ethiopia Camp Springs:
1.8% (49)Maryland:
3.2% (30,870)
Other Central America Camp Springs:
1.8% (48)Maryland:
0.0% (219)
Other Western Africa Camp Springs:
1.8% (47)Maryland:
0.7% (6,317)
Place of birth for U.S.-born residents:
This state: 6,788Other state: 12,904Northeast: 1,169Midwest: 801South: 10,394West: 340 93.1% of Camp Springs residents lived in the same house 1 years ago.
Out of people who lived in different houses, 36.0% lived in this county.
Out of people who lived in different counties, 39.7% lived in Maryland.
Camp Springs:
93.1%State average:
88.5%
Education attainment for males 25 years and older:
No schooling: 109Nursery to 4th grade: 865th and 6th grade: 07th and 8th grade: 979th grade: 6310th grade: 16911th grade: 3512th grade, no diploma: 137High school graduate (or equivalency): 2,693Less than 1 year of college: 521Some college more than 1 year, no degree: 1,293Associate degree: 586Bachelor's degree: 1,399Master's degree: 639Professional school degree: 211Doctorate degree: 43
Education attainment for females 25 years and older:
No schooling: 125Nursery to 4th grade: 05th and 6th grade: 547th and 8th grade: 09th grade: 910th grade: 911th grade: 5812th grade, no diploma: 34High school graduate (or equivalency): 2,257Less than 1 year of college: 799Some college more than 1 year, no degree: 1,337Associate degree: 620Bachelor's degree: 1,627Master's degree: 1,261Professional school degree: 132Doctorate degree: 146
Housing units in structures:
One, detached: 6,043One, attached: 713Two: 283 or 4: 1745 to 9: 28610 to 19: 4520 to 49: 31950 or more: 1,393Mobile homes: 39Housing units lacking complete plumbing facilities in 2022: 0.8%House/condo owner moved in on average 16 years ago
Renter moved in on average 3 years ago
Private vs. public school enrollment:
Students in private schools in grades 1 to 8 (elementary and middle school): 249 Students in private schools in grades 9 to 12 (high school): 102 Students in private undergraduate colleges: 206