Caney City, TX (Texas) Houses and Residents
| Caney City: | |
| Texas: |
Mean price in 2022:
Detached houses: $493,292
Here: $493,292 State: $369,058 Mobile homes: $86,819
Here: $86,819 State: $124,413
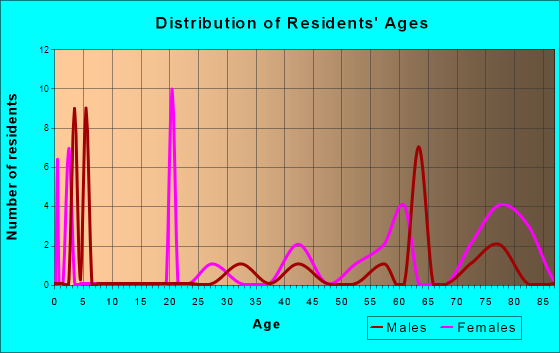
Total population: 217 (Urban population: 158 (all inside urban clusters), Rural population: 44 (all nonfarm))
Houses: 181 (85 occupied: 69 owner occupied, 18 renter occupied)
| % of renters here: | 21% |
| State: | 38% |
Housing density: 156 houses/condos per square mile
Median price asked for vacant for-sale houses and condos in 2022 in this county: $379,227.
Median contract rent in 2022: $612 (lower quartile is $522, upper quartile is $700)
Median gross rent in Caney City, TX in 2022: $756
Housing units in Caney City with a mortgage: 28 (0 second mortgage, 0 home equity loan, 0 both second mortgage and home equity loan)
Houses without a mortgage: 0
Median household income for apartments without a mortgage: $35,709
Median monthly housing costs: $852
Compare current foreclosures near Caney City, TX:
| Photo | Address | Area | Beds / Baths | Price | Details |
|---|---|---|---|---|---|

|
#1
Vz County Road 2816
Mabank, TX 75147
|
1,959 sq. feet
|
3 baths 4 beds |
$389,900
|
show details |

|
#2
State Highway 31 E
Athens, TX 75752
|
3,926 sq. feet
|
3 baths 3 beds |
show details | |

|
#3
State Highway 274
Kemp, TX 75143
|
1,730 sq. feet
|
2 baths 3 beds |
show details | |

|
#4
Guadalupe Dr
Athens, TX 75751
|
2,176 sq. feet
|
2 baths 3 beds |
show details | |

|
#5
Natchez Trl
Mabank, TX 75156
|
2,432 sq. feet
|
2 baths 5 beds |
show details | |

|
#6
Tahiti Ln
Kemp, TX 75143
|
2,100 sq. feet
|
2 baths 3 beds |
show details | |

|
#7
Fm 59
Athens, TX 75751
|
1,712 sq. feet
|
2 baths 3 beds |
show details | |

|
#8
Ivy St
Kerens, TX 75144
|
1,320 sq. feet
|
1 baths - beds |
show details | |

|
#9
SE 2nd St
Kerens, TX 75144
|
1,363 sq. feet
|
1 baths - beds |
show details | |

|
#10
Hickory Cir
Kemp, TX 75143
|
1,725 sq. feet
|
1 baths - beds |
show details |
| Photo | Address | Area | Beds / Baths | Price | Details |
|---|---|---|---|---|---|

|
#11
Vz County Road 2914
Eustace, TX 75124
|
1,026 sq. feet
|
- baths - beds |
show details | |

|
#12
NE County Road 3170b
Kerens, TX 75144
|
- sq. feet
|
- baths - beds |
show details | |

|
#13
County Road 2404
Kemp, TX 75143
|
3,838 sq. feet
|
- baths - beds |
show details | |

|
#14
Baker Ln
Mabank, TX 75147
|
- sq. feet
|
- baths - beds |
show details | |

|
#15
E Travis Ln
Malakoff, TX 75148
|
- sq. feet
|
- baths - beds |
show details | |

|
#16
Clay St
Mabank, TX 75147
|
- sq. feet
|
- baths - beds |
show details | |

|
#17
Jax St
Mabank, TX 75147
|
- sq. feet
|
- baths - beds |
show details | |

|
#18
Camryn Ln
Mabank, TX 75147
|
- sq. feet
|
- baths - beds |
show details | |

|
#19
Towering Oaks
Kemp, TX 75143
|
1,821 sq. feet
|
- baths - beds |
show details | |

|
#20
County Road 3911
Athens, TX 75752
|
- sq. feet
|
- baths - beds |
show details |
| Photo | Address | Area | Beds / Baths | Price | Details |
|---|---|---|---|---|---|

|
#21
Mcdonald Dr
Athens, TX 75751
|
- sq. feet
|
- baths - beds |
show details | |

|
#22
Springview Ln
Mabank, TX 75147
|
- sq. feet
|
- baths - beds |
show details | |

|
#23
Springview Ln
Mabank, TX 75147
|
- sq. feet
|
- baths - beds |
show details | |

|
#24
County Road 1113
Athens, TX 75751
|
1,642 sq. feet
|
- baths - beds |
show details | |

|
#25
Lake By Dr
Kemp, TX 75143
|
1,400 sq. feet
|
- baths - beds |
show details | |

|
#26
County Road 4619
Athens, TX 75752
|
1,096 sq. feet
|
- baths - beds |
show details | |

|
#27
State Highway 19 S
Athens, TX 75751
|
840 sq. feet
|
- baths - beds |
show details | |

|
#28
County Road 4819
Athens, TX 75752
|
- sq. feet
|
- baths - beds |
show details | |

|
#29
Cameron Blvd # 818
Kemp, TX 75143
|
- sq. feet
|
- baths - beds |
show details | |

|
#30
Cameron Blvd # 415
Kemp, TX 75143
|
- sq. feet
|
- baths - beds |
show details |
| Photo | Address | Area | Beds / Baths | Price | Details |
|---|---|---|---|---|---|

|
#31
Chambers Point Dr
Kerens, TX 75144
|
- sq. feet
|
- baths - beds |
show details | |

|
#32
Suncrest Dr
Athens, TX 75752
|
1,935 sq. feet
|
- baths - beds |
show details | |

|
#33
County Road 2101
Kemp, TX 75143
|
1,770 sq. feet
|
- baths - beds |
show details | |

|
#34
Northlake Cir
Kemp, TX 75143
|
- sq. feet
|
- baths - beds |
show details | |

|
#35
Vz County Road 2312
Mabank, TX 75147
|
- sq. feet
|
- baths - beds |
show details | |

|
#36
L S P Cir
Kerens, TX 75144
|
1,518 sq. feet
|
- baths - beds |
show details | |

|
#37
County Road 4614
Athens, TX 75752
|
- sq. feet
|
- baths - beds |
show details | |

|
#38
County Road 2138
Kemp, TX 75143
|
- sq. feet
|
- baths - beds |
show details | |

|
#39
County Road 1125
Athens, TX 75751
|
1,454 sq. feet
|
- baths - beds |
show details | |

|
#40
County Road 4613
Athens, TX 75752
|
- sq. feet
|
- baths - beds |
show details |
| Photo | Address | Area | Beds / Baths | Price | Details |
|---|---|---|---|---|---|

|
#41
County Road 3818
Athens, TX 75752
|
1,120 sq. feet
|
- baths - beds |
show details | |

|
#42
SW 3rd St
Kerens, TX 75144
|
1,190 sq. feet
|
- baths - beds |
show details | |

|
#43
N Wright Ave
Kerens, TX 75144
|
1,385 sq. feet
|
- baths - beds |
show details | |

|
#44
Springview Ln
Mabank, TX 75147
|
- sq. feet
|
- baths - beds |
show details | |

|
#45
Springview Ln
Mabank, TX 75147
|
- sq. feet
|
- baths - beds |
show details | |

|
#46
Flying Bridge Dr
Mabank, TX 75156
|
- sq. feet
|
- baths - beds |
show details | |

|
#47
Springview Ln
Mabank, TX 75147
|
- sq. feet
|
- baths - beds |
show details | |

|
#48
Tall Trees Dr
Trinidad, TX 75163
|
- sq. feet
|
- baths - beds |
show details | |

|
#49
Bandera Cir
Mabank, TX 75156
|
- sq. feet
|
- baths - beds |
show details | |

|
Check over 1 million property listings on Foreclosure.com!
|
browse all offers | |||


Median year apartment built: 1985
Household type by relationship:
Households: 152- Male householders: 43 (15 living alone), Female householders: 41 (8 living alone)
39 spouses (39 opposite-sex spouses), 0 unmarried partners, (0 opposite-sex unmarried partners), 25 children (25 natural, 0 adopted, 0 stepchildren), 1 grandchildren, 0 brothers or sisters, 0 parents, 0 foster children, 0 other relatives, 0 non-relatives
Size of family households: 52 2-persons, 1 3-persons, 6 4-persons.
Size of nonfamily households: 27 1-person.
14 married couples with children.
0 single-parent households (0 men, 0 women).
All residents speak only English at home
| Here: | 6.0 |
| State: | 6.3 |
| Here: | 5.2 |
| State: | 4.0 |

- Bedrooms in owner-occupied houses and condos in Caney City, Texas
- 0no bedroom
- 01 bedroom
- 82 bedrooms
- 533 bedrooms
- 24 bedrooms
- 65+ bedrooms

- Bedrooms in renter-occupied apartments in Caney City, Texas
- 0no bedroom
- 01 bedroom
- 182 bedrooms
- 03 bedrooms
- 04 bedrooms
- 15+ bedrooms

- Cars and other vehicles available in Caney City in owner-occupied houses/condos
- 3no vehicle
- 191 vehicle
- 332 vehicles
- 53 vehicles
- 24 vehicles
- 75+ vehicles

- Cars and other vehicles available in Caney City in renter-occupied apartments
- 0no vehicle
- 41 vehicle
- 152 vehicles
- 03 vehicles
- 04 vehicles
- 05+ vehicles

- Rooms in owner-occupied houses in Caney City, Texas
- 01 room
- 02 rooms
- 33 rooms
- 124 rooms
- 175 rooms
- 206 rooms
- 57 rooms
- 58 rooms
- 79+ rooms

- Rooms in renter-occupied apartments in Caney City, Texas
- 01 room
- 02 rooms
- 33 rooms
- 04 rooms
- 135 rooms
- 26 rooms
- 07 rooms
- 08 rooms
- 19+ rooms


Caney City, TX household income distribution

- 6Less than $10,000
- 5$10,000 to $19,999
- 14$20,000 to $29,999
- 5$30,000 to $39,999
- 4$40,000 to $49,999
- 5$50,000 to $59,999
- 14$60,000 to $74,999
- 11$75,000 to $99,999
- 4$100,000 to $124,999
- 5$150,000 to $199,999
- 11$200,000 or more

Home value of owner - occupied houses in 2022 in Caney City, TX
-
- 3Less than $10,000
- 0$10,000 to $14,999
- 8$25,000 to $29,999
- 1$30,000 to $34,999
- 0$40,000 to $49,999
- 4$50,000 to $59,999
- 12$100,000 to $124,999
- 1$150,000 to $174,999
- 2$200,000 to $249,999
- 10$300,000 to $399,999
- 4$400,000 to $499,999
- 9$500,000 to $749,999
- 2$750,000 to $999,999
- 6$1,000,000 to $1,499,999

Rent paid by renters in 2022 in Caney City, TX
-
- 7$450 to $499
- 3$600 to $649
- 1$1,000 to $1,249
- 4No cash rent


Percentage of workers working in this county: 61.5%
Number of people working at home: 1 (1.7% of all workers)
Travel time to work (commute)
- Less than 5 minutes: 4
- 5 to 9 minutes: 9
- 10 to 14 minutes: 5
- 15 to 19 minutes: 0
- 20 to 24 minutes: 1
- 25 to 29 minutes: 4
- 30 to 34 minutes: 32
- 35 to 39 minutes: 0
- 40 to 44 minutes: 0
- 45 to 59 minutes: 3
- 60 to 89 minutes: 3
- 90 or more minutes: 2
Means of transportation to work:
- Drove a car alone: 18 (54.5%)
- Carpooled: 15 (45.5%)


First ancestries reported:
- American: 13 (19.1%)
- German: 6 (8.8%)
- European: 4 (5.9%)
- Irish: 2 (2.9%)
- Danish: 1 (1.5%)
- Dutch: 1 (1.5%)
- English: 1 (1.5%)
- Italian: 1 (1.5%)
- Swiss: 1 (1.5%)
Place of birth for U.S.-born residents:
- This state: 107
- Other state: 42
- Northeast: 0
- Midwest: 19
- South: 13
- West: 6
97.4% of Caney City residents lived in the same house 1 years ago.
Out of people who lived in different houses, 0.0% lived in this county.
Out of people who lived in different counties, 100.0% lived in Texas.
| Caney City: | 97.4% |
| State average: | 85.7% |
Education attainment for males 25 years and older:
- No schooling: 0
- Nursery to 4th grade: 0
- 5th and 6th grade: 0
- 7th and 8th grade: 0
- 9th grade: 8
- 10th grade: 2
- 11th grade: 0
- 12th grade, no diploma: 0
- High school graduate (or equivalency): 31
- Less than 1 year of college: 0
- Some college more than 1 year, no degree: 13
- Associate degree: 1
- Bachelor's degree: 9
- Master's degree: 4
- Professional school degree: 0
- Doctorate degree: 0

Education attainment for females 25 years and older:
- No schooling: 0
- Nursery to 4th grade: 0
- 5th and 6th grade: 0
- 7th and 8th grade: 0
- 9th grade: 0
- 10th grade: 0
- 11th grade: 0
- 12th grade, no diploma: 0
- High school graduate (or equivalency): 9
- Less than 1 year of college: 9
- Some college more than 1 year, no degree: 16
- Associate degree: 8
- Bachelor's degree: 13
- Master's degree: 7
- Professional school degree: 0
- Doctorate degree: 0

Housing units in structures:
- One, detached: 118
- Mobile homes: 63
Housing units lacking complete kitchen facilities in 2022: 9.6%
House/condo owner moved in on average 20 years ago
Renter moved in on average 6 years ago


- 84.8%Electricity
- 15.2%Bottled, tank, or LP gas

- 88.9%Electricity
- 11.1%Bottled, tank, or LP gas
Private vs. public school enrollment:
| Here: | 0.0% |
| Texas: | 8.8% |
| Here: | 0.0% |
| Texas: | 8.0% |


