Capron, IL (Illinois) Houses and Residents
| Capron: | $157,842 |
| Illinois: | $251,600 |
Total population: 1,356 (Urban population: 0, Rural population: 950 (5 farm, 945 nonfarm))
Houses: 441 (396 occupied: 321 owner occupied, 80 renter occupied)
| % of renters here: | 20% |
| State: | 33% |
Housing density: 606 houses/condos per square mile
Median price asked for vacant for-sale houses and condos in 2022 in this county: $100,788.
Median contract rent in 2022: $584 (lower quartile is $477, upper quartile is $940)
Median rent asked for vacant for-rent units in 2022: $536
Median gross rent in Capron, IL in 2022: $727
Housing units in Capron with a mortgage: 221 (13 second mortgage, 0 home equity loan, 11 both second mortgage and home equity loan)
Houses without a mortgage: 29
Median household income for houses/condos with a mortgage: $89,908
Median household income for apartments without a mortgage: $87,018
Median monthly housing costs: $1,055
Compare current foreclosures near Capron, IL:
| Photo | Address | Area | Beds / Baths | Price | Details |
|---|---|---|---|---|---|

|
#1
W North St
Capron, IL 61012
|
2,500 sq. feet
|
2 baths 4 beds |
show details | |

|
#2
Sundance Trl
Capron, IL 61012
|
- sq. feet
|
2 baths 3 beds |
show details | |

|
#3
E Ogden St
Capron, IL 61012
|
- sq. feet
|
1 baths 3 beds |
show details | |

|
#4
County Road O S
Delavan, WI 53115
|
2,080 sq. feet
|
2 baths 3 beds |
$379,900
|
show details |

|
#5
Nadine Ave
Rockford, IL 61114
|
1,546 sq. feet
|
1 baths 3 beds |
$225,000
|
show details |

|
#6
Blackhawk Blvd
South Beloit, IL 61080
|
1,596 sq. feet
|
2 baths 4 beds |
$189,900
|
show details |

|
#7
Trudy Rd
Rockford, IL 61108
|
1,546 sq. feet
|
1 baths 3 beds |
$225,000
|
show details |

|
#8
Sara Ln
Marengo, IL 60152
|
3,202 sq. feet
|
2 baths 4 beds |
$425,000
|
show details |

|
#9
S Wooster St
Capron, IL 61012
|
- sq. feet
|
- baths - beds |
show details | |

|
#10
Vesper Dr
South Beloit, IL 61080
|
1,176 sq. feet
|
1 baths 3 beds |
show details |
| Photo | Address | Area | Beds / Baths | Price | Details |
|---|---|---|---|---|---|

|
#11
Wayne St
Union, IL 60180
|
1,595 sq. feet
|
1 baths 3 beds |
show details | |

|
#12
Tampa Dr
Machesney Park, IL 61115
|
1,064 sq. feet
|
1 baths 3 beds |
show details | |

|
#13
Deanna Dr
Rockford, IL 61103
|
1,237 sq. feet
|
1 baths 3 beds |
show details | |

|
#14
Tappan St
Woodstock, IL 60098
|
925 sq. feet
|
1 baths 3 beds |
show details | |

|
#15
Venus St
Loves Park, IL 61111
|
1,097 sq. feet
|
2 baths 3 beds |
show details | |

|
#16
Blakely St
Woodstock, IL 60098
|
1,008 sq. feet
|
1 baths 3 beds |
show details | |

|
#17
Howard St
Walworth, WI 53184
|
1,647 sq. feet
|
2 baths 4 beds |
show details | |

|
#18
Broadview Ave
Belvidere, IL 61008
|
1,958 sq. feet
|
2 baths 3 beds |
show details | |

|
#19
Kishwaukee St
Belvidere, IL 61008
|
2,032 sq. feet
|
2 baths 5 beds |
show details | |

|
#20
Atwood Rd
Roscoe, IL 61073
|
1,374 sq. feet
|
2 baths 3 beds |
show details |
| Photo | Address | Area | Beds / Baths | Price | Details |
|---|---|---|---|---|---|

|
#21
Sage Ln
Harvard, IL 60033
|
2,280 sq. feet
|
2 baths 4 beds |
show details | |

|
#22
Wagner Dr
Clinton, WI 53525
|
- sq. feet
|
2 baths 3 beds |
show details | |

|
#23
Clover Chase Cir
Woodstock, IL 60098
|
1,917 sq. feet
|
2 baths 3 beds |
show details | |

|
#24
Santolina Dr
Roscoe, IL 61073
|
- sq. feet
|
3 baths 4 beds |
show details | |

|
#25
Mcfarland Rd
Loves Park, IL 61111
|
- sq. feet
|
1 baths 2 beds |
show details | |

|
#26
E Perry St
Belvidere, IL 61008
|
1,356 sq. feet
|
1 baths 2 beds |
show details | |

|
#27
Brown St
Woodstock, IL 60098
|
812 sq. feet
|
1 baths 3 beds |
show details | |

|
#28
Bliss St
Belvidere, IL 61008
|
2,100 sq. feet
|
2 baths 3 beds |
show details | |

|
#29
Tallgrass Trl
Poplar Grove, IL 61065
|
1,300 sq. feet
|
2 baths 3 beds |
show details | |

|
#30
W Madison St
Belvidere, IL 61008
|
3,044 sq. feet
|
2 baths 5 beds |
show details |
| Photo | Address | Area | Beds / Baths | Price | Details |
|---|---|---|---|---|---|

|
#31
Nelson Rd
Woodstock, IL 60098
|
2,008 sq. feet
|
- baths 3 beds |
show details | |

|
#32
East St
Cherry Valley, IL 61016
|
- sq. feet
|
1 baths 4 beds |
show details | |

|
#33
Liverpool Dr SE
Poplar Grove, IL 61065
|
- sq. feet
|
2 baths 4 beds |
show details | |

|
#34
Springmeadow Dr
Poplar Grove, IL 61065
|
- sq. feet
|
2 baths 4 beds |
show details | |

|
#35
Olive St
Woodstock, IL 60098
|
1,152 sq. feet
|
- baths 2 beds |
show details | |

|
#36
Timber Dr
Harvard, IL 60033
|
1,229 sq. feet
|
- baths - beds |
show details | |

|
#37
Biester Dr
Belvidere, IL 61008
|
- sq. feet
|
1 baths 3 beds |
show details | |

|
#38
Quail Ct
Woodstock, IL 60098
|
- sq. feet
|
2 baths 4 beds |
show details | |

|
#39
Cash Rd
Harvard, IL 60033
|
- sq. feet
|
2 baths - beds |
show details | |

|
#40
Hearthstone Ln
Belvidere, IL 61008
|
- sq. feet
|
2 baths 3 beds |
show details |
| Photo | Address | Area | Beds / Baths | Price | Details |
|---|---|---|---|---|---|

|
#41
Chopin Ln
Woodstock, IL 60098
|
- sq. feet
|
2 baths 4 beds |
show details | |

|
#42
Key Largo Ct
Rockford, IL 61103
|
- sq. feet
|
2 baths 3 beds |
show details | |

|
#43
Columbia St NW
Poplar Grove, IL 61065
|
- sq. feet
|
2 baths 3 beds |
show details | |

|
#44
Pembroke Rd SW
Poplar Grove, IL 61065
|
- sq. feet
|
2 baths 3 beds |
show details | |

|
#45
Ricky Trl
Belvidere, IL 61008
|
- sq. feet
|
1 baths 3 beds |
show details | |

|
#46
Gables Dr SW
Poplar Grove, IL 61065
|
- sq. feet
|
2 baths 3 beds |
show details | |

|
#47
W Chrysler Dr
Belvidere, IL 61008
|
- sq. feet
|
2 baths 2 beds |
show details | |

|
#48
Willowbrook Dr
Belvidere, IL 61008
|
- sq. feet
|
2 baths 3 beds |
show details | |

|
#49
Elm Ln
Woodstock, IL 60098
|
794 sq. feet
|
- baths - beds |
show details | |

|
Check over 1 million property listings on Foreclosure.com!
|
browse all offers | |||

Latest news about housing in Capron, IL collected exclusively by city-data.com from local newspapers, TV, and radio stations

Median year apartment built: 1955
Household type by relationship:
Households: 1,344- Male householders: 188 (40 living alone), Female householders: 201 (43 living alone)
236 spouses (236 opposite-sex spouses), 40 unmarried partners, (40 opposite-sex unmarried partners), 621 children (604 natural, 3 adopted, 12 stepchildren), 16 grandchildren, 0 brothers or sisters, 21 parents, 0 foster children, 0 other relatives, 17 non-relatives
Size of family households: 81 2-persons, 84 3-persons, 41 4-persons, 46 5-persons, 34 6-persons, 5 7-or-more-persons.
Size of nonfamily households: 88 1-person, 14 2-persons, 2 3-persons.
210 married couples with children.
137 single-parent households (88 men, 49 women).
70.4% of residents of Capron speak English at home.
29.3% of residents speak Spanish at home (53% speak English very well, 36% speak English well, 7% speak English not well, 5% don't speak English at all).
Foreign born population: 208 (15.5%)
(18.8% of them are naturalized citizens)
| Here: | 6.1 |
| State: | 6.4 |
| Here: | 5.3 |
| State: | 4.1 |

- Bedrooms in owner-occupied houses and condos in Capron, Illinois
- 0no bedroom
- 01 bedroom
- 352 bedrooms
- 2343 bedrooms
- 514 bedrooms
- 25+ bedrooms

- Bedrooms in renter-occupied apartments in Capron, Illinois
- 0no bedroom
- 21 bedroom
- 342 bedrooms
- 323 bedrooms
- 134 bedrooms
- 05+ bedrooms

- Cars and other vehicles available in Capron in owner-occupied houses/condos
- 12no vehicle
- 461 vehicle
- 932 vehicles
- 1283 vehicles
- 434 vehicles
- 05+ vehicles

- Cars and other vehicles available in Capron in renter-occupied apartments
- 3no vehicle
- 171 vehicle
- 492 vehicles
- 13 vehicles
- 04 vehicles
- 105+ vehicles

- Rooms in owner-occupied houses in Capron, Illinois
- 01 room
- 02 rooms
- 03 rooms
- 174 rooms
- 675 rooms
- 1376 rooms
- 447 rooms
- 208 rooms
- 369+ rooms

- Rooms in renter-occupied apartments in Capron, Illinois
- 01 room
- 02 rooms
- 03 rooms
- 214 rooms
- 205 rooms
- 256 rooms
- 57 rooms
- 88 rooms
- 09+ rooms


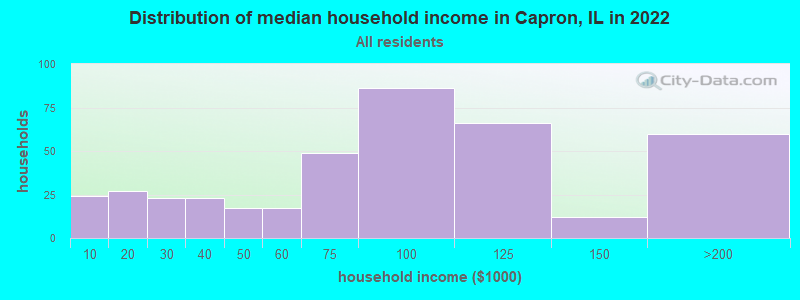
Capron, IL household income distribution

- 24Less than $10,000
- 27$10,000 to $19,999
- 23$20,000 to $29,999
- 23$30,000 to $39,999
- 17$40,000 to $49,999
- 17$50,000 to $59,999
- 49$60,000 to $74,999
- 86$75,000 to $99,999
- 66$100,000 to $124,999
- 12$125,000 to $149,999
- 60$150,000 to $199,999
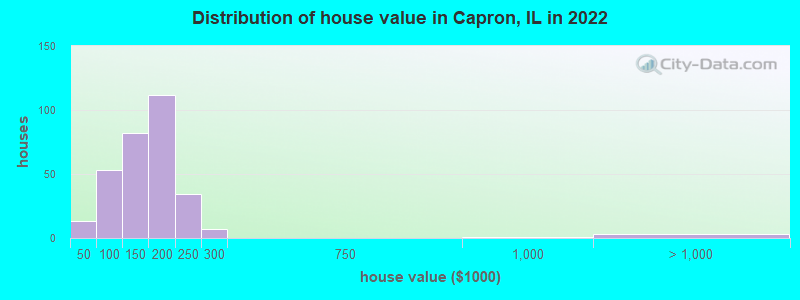
Home value of owner - occupied houses in 2022 in Capron, IL
-
- 9Less than $10,000
- 3$10,000 to $14,999
- 2$50,000 to $59,999
- 8$60,000 to $69,999
- 22$70,000 to $79,999
- 4$80,000 to $89,999
- 15$90,000 to $99,999
- 20$100,000 to $124,999
- 62$125,000 to $149,999
- 78$150,000 to $174,999
- 32$175,000 to $199,999
- 33$200,000 to $249,999
- 7$250,000 to $299,999
- 1$750,000 to $999,999
- 2$1,000,000 to $1,499,999
Rent paid by renters in 2022 in Capron, IL
-
- 14$400 to $449
- 10$450 to $499
- 2$500 to $549
- 11$550 to $599
- 2$650 to $699
- 4$750 to $799
- 9$800 to $899
- 2$900 to $999
- 18$1,000 to $1,249


Percentage of workers working in this county: 33.0%
Number of people working at home: 49 (6.6% of all workers)
Travel time to work (commute)
- Less than 5 minutes: 6
- 5 to 9 minutes: 46
- 10 to 14 minutes: 147
- 15 to 19 minutes: 51
- 20 to 24 minutes: 38
- 25 to 29 minutes: 49
- 30 to 34 minutes: 119
- 35 to 39 minutes: 13
- 40 to 44 minutes: 72
- 45 to 59 minutes: 66
- 60 to 89 minutes: 27
- 90 or more minutes: 28
Means of transportation to work:
- Drove a car alone: 330 (75.0%)
- Carpooled: 81 (18.4%)
- Subway or elevated: 3 (0.7%)
- Motorcycle: 1 (0.2%)
- Walked: 14 (3.2%)
- Worked at home: 11 (2.5%)

- Unemployment by race in 2022
- Unemployment rate for White non-Hispanic residents
- 1.2%Males
- 18.9%Females
- Unemployment rate for other race residents
- 14.9%Males
- Unemployment rate for Hispanic or Latino residents
- 4.7%Males

- Year of entry for the foreign-born population in Capron, Illinois
- 402010 or later
- 642000 to 2009
- 641990 to 1999
- 141980 to 1989
- 91970 to 1979
- 13Before 1970

First ancestries reported:
- German: 125 (19.0%)
- American: 66 (10.0%)
- Irish: 27 (4.1%)
- English: 15 (2.3%)
- Norwegian: 11 (1.7%)
- French: 6 (0.9%)
- Swedish: 6 (0.9%)
- Polish: 4 (0.6%)
- Welsh: 3 (0.5%)
Most common places of birth for foreign-born residents (%):
| Capron: | 97.1% (202) |
| Illinois: | 34.7% (626,958) |
| Capron: | 1.9% (4) |
| Illinois: | 1.3% (22,793) |
Place of birth for U.S.-born residents:
- This state: 891
- Other state: 243
- Northeast: 14
- Midwest: 146
- South: 18
- West: 67
95.5% of Capron residents lived in the same house 1 years ago.
Out of people who lived in different houses, 36.8% lived in this county.
Out of people who lived in different counties, 60.0% lived in Illinois.
| Capron: | 95.5% |
| State average: | 88.3% |
Education attainment for males 25 years and older:
- No schooling: 59
- Nursery to 4th grade: 4
- 5th and 6th grade: 5
- 7th and 8th grade: 10
- 9th grade: 0
- 10th grade: 0
- 11th grade: 11
- 12th grade, no diploma: 4
- High school graduate (or equivalency): 207
- Less than 1 year of college: 29
- Some college more than 1 year, no degree: 35
- Associate degree: 15
- Bachelor's degree: 58
- Master's degree: 10
- Professional school degree: 0
- Doctorate degree: 0

Education attainment for females 25 years and older:
- No schooling: 33
- Nursery to 4th grade: 10
- 5th and 6th grade: 2
- 7th and 8th grade: 0
- 9th grade: 1
- 10th grade: 1
- 11th grade: 11
- 12th grade, no diploma: 21
- High school graduate (or equivalency): 151
- Less than 1 year of college: 29
- Some college more than 1 year, no degree: 42
- Associate degree: 41
- Bachelor's degree: 25
- Master's degree: 7
- Professional school degree: 3
- Doctorate degree: 3

Housing units in structures:
- One, detached: 367
- One, attached: 12
- Two: 21
- 3 or 4: 16
- 5 to 9: 2
- 10 to 19: 1
- Mobile homes: 21
Median worth of mobile homes: $12,126
Housing units lacking complete kitchen facilities in 2022: 1.6%
House/condo owner moved in on average 15 years ago
Renter moved in on average 3 years ago

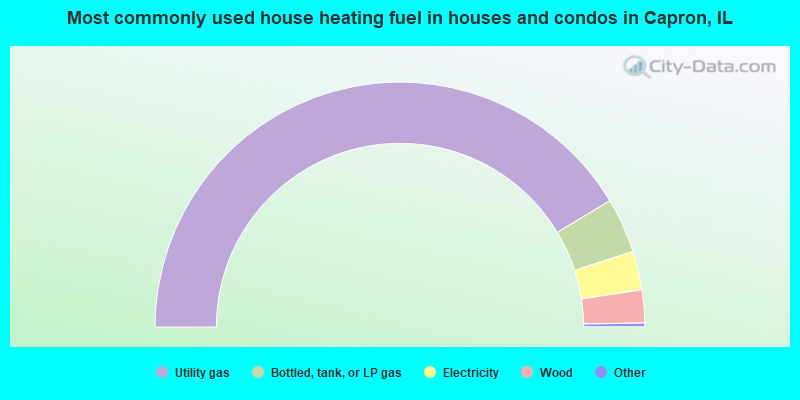
- 83.2%Utility gas
- 7.3%Bottled, tank, or LP gas
- 5.1%Electricity
- 4.4%Wood
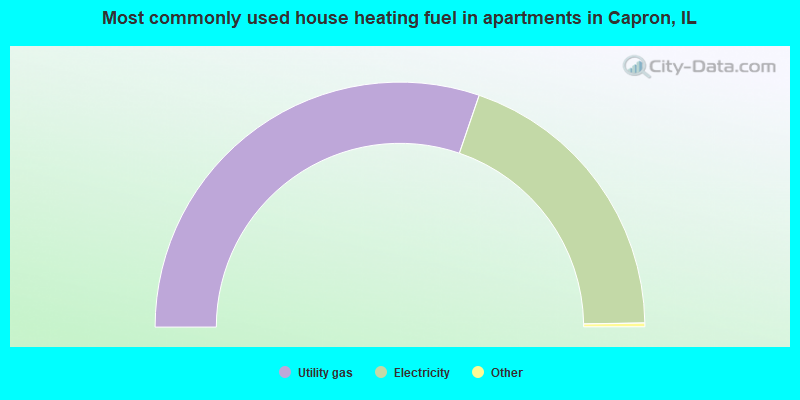
- 60.8%Utility gas
- 39.2%Electricity
Private vs. public school enrollment:
| Here: | 9.3% |
| Illinois: | 13.3% |
| Here: | 2.0% |
| Illinois: | 9.9% |
| Here: | 15.6% |
| Illinois: | 27.4% |


