Carbon Cliff, IL (Illinois) Houses and Residents
| Carbon Cliff: | $106,324 |
| Illinois: | $251,600 |
Total population: 2,046 (Urban population: 1,577, Rural population: 106 (all nonfarm))
Houses: 882 (815 occupied: 453 owner occupied, 379 renter occupied)
| % of renters here: | 46% |
| State: | 33% |
Housing density: 432 houses/condos per square mile
Median price asked for vacant for-sale houses and condos in 2022: $428,586.
Median contract rent in 2022: $793 (lower quartile is $694, upper quartile is $872)
Median rent asked for vacant for-rent units in 2022: $2,207
Median gross rent in Carbon Cliff, IL in 2022: $899
Housing units in Carbon Cliff with a mortgage: 297 (18 second mortgage, 0 home equity loan, 9 both second mortgage and home equity loan)
Houses without a mortgage: 14
Median household income for houses/condos with a mortgage: $66,792
Median household income for apartments without a mortgage: $57,075
Median monthly housing costs: $918
Compare current foreclosures near Carbon Cliff, IL:
| Photo | Address | Area | Beds / Baths | Price | Details |
|---|---|---|---|---|---|

|
#1
Orchard Ln Apt 103
Carbon Cliff, IL 61239
|
- sq. feet
|
- baths - beds |
show details | |

|
#2
Rebecca Dr
Carbon Cliff, IL 61239
|
- sq. feet
|
- baths - beds |
show details | |

|
#3
4th Ave
East Moline, IL 61244
|
805 sq. feet
|
1 baths 2 beds |
$110,000
|
show details |

|
#4
47th Ave
Rock Island, IL 61201
|
733 sq. feet
|
1 baths 1 beds |
$111,500
|
show details |

|
#5
101st Avenue Ct W
Rock Island, IL 61201
|
988 sq. feet
|
1 baths 3 beds |
$145,000
|
show details |

|
#6
N Lincoln Ave
Davenport, IA 52804
|
952 sq. feet
|
1 baths 2 beds |
$179,900
|
show details |

|
#7
38th St Apt 12
Rock Island, IL 61201
|
1,008 sq. feet
|
1 baths 2 beds |
$95,000
|
show details |

|
#8
W 16th St
Davenport, IA 52804
|
- sq. feet
|
1 baths 3 beds |
$53,550
|
show details |

|
#9
12th Ave
Moline, IL 61265
|
- sq. feet
|
2 baths 3 beds |
show details | |

|
#10
W 54th St
Davenport, IA 52806
|
1,180 sq. feet
|
1 baths 2 beds |
show details |
| Photo | Address | Area | Beds / Baths | Price | Details |
|---|---|---|---|---|---|

|
#11
Dodge St
Le Claire, IA 52753
|
1,224 sq. feet
|
1 baths 3 beds |
show details | |

|
#12
Park Ave S
Eldridge, IA 52748
|
2,400 sq. feet
|
2 baths 4 beds |
show details | |

|
#13
3rd St S
Cordova, IL 61242
|
1,576 sq. feet
|
2 baths 5 beds |
show details | |

|
#14
N College Ave
Geneseo, IL 61254
|
1,584 sq. feet
|
2 baths 3 beds |
show details | |

|
#15
N Elsie Ave
Davenport, IA 52806
|
916 sq. feet
|
2 baths 4 beds |
show details | |

|
#16
44th St
Rock Island, IL 61201
|
1,721 sq. feet
|
2 baths 3 beds |
show details | |

|
#17
7th St
East Moline, IL 61244
|
- sq. feet
|
1 baths 4 beds |
show details | |

|
#18
N Fillmore St
Davenport, IA 52804
|
1,322 sq. feet
|
1 baths 4 beds |
show details | |

|
#19
16th St
Milan, IL 61264
|
864 sq. feet
|
1 baths 2 beds |
show details | |

|
#20
Us Highway 150
Orion, IL 61273
|
600 sq. feet
|
1 baths 2 beds |
show details |
| Photo | Address | Area | Beds / Baths | Price | Details |
|---|---|---|---|---|---|

|
#21
Rockingham Rd
Davenport, IA 52802
|
1,666 sq. feet
|
2 baths 3 beds |
show details | |

|
#22
33rd St
Moline, IL 61265
|
1,061 sq. feet
|
1 baths 2 beds |
show details | |

|
#23
95th Ave W
Rock Island, IL 61201
|
- sq. feet
|
1 baths 3 beds |
show details | |

|
#24
Waverly Rd
Davenport, IA 52804
|
1,194 sq. feet
|
1 baths 2 beds |
show details | |

|
#25
50th Ave
Moline, IL 61265
|
- sq. feet
|
1 baths 3 beds |
show details | |

|
#26
32nd Ave
Moline, IL 61265
|
936 sq. feet
|
1 baths 3 beds |
show details | |

|
#27
30th St
Rock Island, IL 61201
|
1,226 sq. feet
|
1 baths 3 beds |
show details | |

|
#28
14th Ave
Silvis, IL 61282
|
858 sq. feet
|
1 baths 3 beds |
show details | |

|
#29
9th St
Rock Island, IL 61201
|
828 sq. feet
|
1 baths 3 beds |
show details | |

|
#30
15th Ave
Rock Island, IL 61201
|
1,016 sq. feet
|
1 baths 4 beds |
show details |
| Photo | Address | Area | Beds / Baths | Price | Details |
|---|---|---|---|---|---|

|
#31
18th Ave
East Moline, IL 61244
|
1,300 sq. feet
|
1 baths 4 beds |
show details | |

|
#32
19th Ave
Rock Island, IL 61201
|
1,110 sq. feet
|
1 baths 2 beds |
show details | |

|
#33
11th St
Rock Island, IL 61201
|
790 sq. feet
|
1 baths 2 beds |
show details | |

|
#34
Central Ave
Bettendorf, IA 52722
|
1,158 sq. feet
|
1 baths 4 beds |
show details | |

|
#35
Monterey Ct
Bettendorf, IA 52722
|
1,240 sq. feet
|
1 baths 4 beds |
show details | |

|
#36
Monterey Ct
Bettendorf, IA 52722
|
1,592 sq. feet
|
1 baths 4 beds |
show details | |

|
#37
17th Ave
Bettendorf, IA 52722
|
3,065 sq. feet
|
1 baths 4 beds |
show details | |

|
#38
15th St
Bettendorf, IA 52722
|
1,694 sq. feet
|
1 baths 3 beds |
show details | |

|
#39
W 9th St
Davenport, IA 52803
|
- sq. feet
|
2 baths 4 beds |
show details | |

|
#40
Riverview Ln
Bettendorf, IA 52722
|
1,451 sq. feet
|
1 baths 4 beds |
show details |
| Photo | Address | Area | Beds / Baths | Price | Details |
|---|---|---|---|---|---|

|
#41
S 11th St
Le Claire, IA 52753
|
1,028 sq. feet
|
1 baths 4 beds |
show details | |

|
#42
Dodge St
Le Claire, IA 52753
|
1,224 sq. feet
|
1 baths 3 beds |
show details | |

|
#43
Avalon Dr
Bettendorf, IA 52722
|
1,160 sq. feet
|
1 baths 3 beds |
show details | |

|
#44
56th Avenue Ct E
Bettendorf, IA 52722
|
3,026 sq. feet
|
1 baths 5 beds |
show details | |

|
#45
23rd Ave
Rock Island, IL 61201
|
768 sq. feet
|
1 baths - beds |
show details | |

|
#46
Queens Ct
Bettendorf, IA 52722
|
1,320 sq. feet
|
1 baths 3 beds |
show details | |

|
#47
Avalon Dr
Bettendorf, IA 52722
|
1,460 sq. feet
|
1 baths 3 beds |
show details | |

|
#48
Greenfield Rd
Bettendorf, IA 52722
|
1,080 sq. feet
|
1 baths 4 beds |
show details | |

|
#49
Somerset Dr
Bettendorf, IA 52722
|
825 sq. feet
|
1 baths 3 beds |
show details | |

|
Check over 1 million property listings on Foreclosure.com!
|
browse all offers | |||


Median year apartment built: 1993
Household type by relationship:
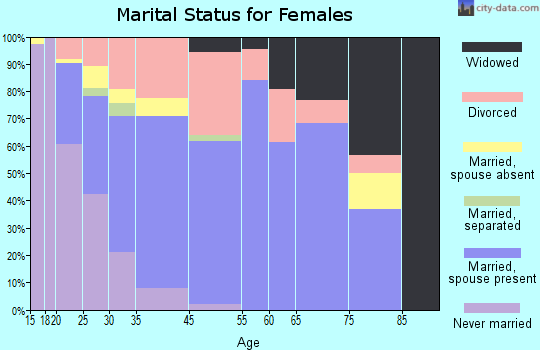
Households: 1,979- Male householders: 344 (96 living alone), Female householders: 457 (135 living alone)
325 spouses (325 opposite-sex spouses), 117 unmarried partners, (117 opposite-sex unmarried partners), 621 children (548 natural, 14 adopted, 59 stepchildren), 53 grandchildren, 9 brothers or sisters, 0 parents, 0 foster children, 0 other relatives, 50 non-relatives
Size of family households: 324 2-persons, 89 3-persons, 94 4-persons, 18 5-persons, 18 6-persons, 6 7-or-more-persons.
Size of nonfamily households: 231 1-person, 33 2-persons, 21 3-persons.
204 married couples with children.
356 single-parent households (107 men, 249 women).
91.9% of residents of Carbon Cliff speak English at home.
4.9% of residents speak Spanish at home (72% speak English very well, 28% speak English well).
2.8% of residents speak other Indo-European language at home (65% speak English very well, 35% speak English well).
Foreign born population: 85 (4.3%)
(28.2% of them are naturalized citizens)
| Here: | 6.0 |
| State: | 6.4 |
| Here: | 4.4 |
| State: | 4.1 |

- Bedrooms in owner-occupied houses and condos in Carbon Cliff, Illinois
- 4no bedroom
- 241 bedroom
- 1092 bedrooms
- 2273 bedrooms
- 834 bedrooms
- 75+ bedrooms

- Bedrooms in renter-occupied apartments in Carbon Cliff, Illinois
- 0no bedroom
- 221 bedroom
- 2642 bedrooms
- 873 bedrooms
- 64 bedrooms
- 05+ bedrooms

- Cars and other vehicles available in Carbon Cliff in owner-occupied houses/condos
- 14no vehicle
- 1501 vehicle
- 2022 vehicles
- 673 vehicles
- 54 vehicles
- 145+ vehicles

- Cars and other vehicles available in Carbon Cliff in renter-occupied apartments
- 35no vehicle
- 2481 vehicle
- 892 vehicles
- 73 vehicles
- 04 vehicles
- 05+ vehicles

- Rooms in owner-occupied houses in Carbon Cliff, Illinois
- 41 room
- 02 rooms
- 03 rooms
- 804 rooms
- 995 rooms
- 1266 rooms
- 527 rooms
- 358 rooms
- 589+ rooms

- Rooms in renter-occupied apartments in Carbon Cliff, Illinois
- 01 room
- 02 rooms
- 803 rooms
- 1114 rooms
- 1235 rooms
- 416 rooms
- 177 rooms
- 48 rooms
- 39+ rooms


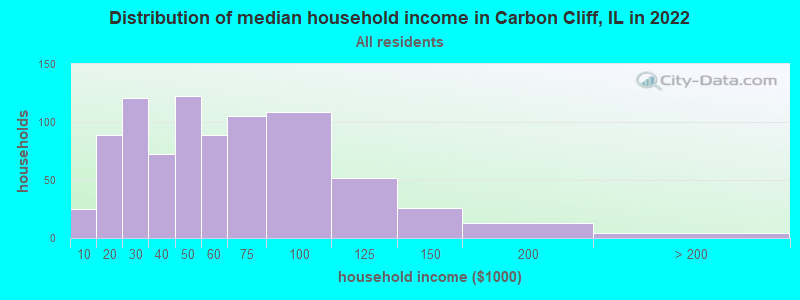
Carbon Cliff, IL household income distribution

- 25Less than $10,000
- 89$10,000 to $19,999
- 121$20,000 to $29,999
- 72$30,000 to $39,999
- 122$40,000 to $49,999
- 89$50,000 to $59,999
- 105$60,000 to $74,999
- 109$75,000 to $99,999
- 52$100,000 to $124,999
- 26$125,000 to $149,999
- 13$150,000 to $199,999
- 4$200,000 or more
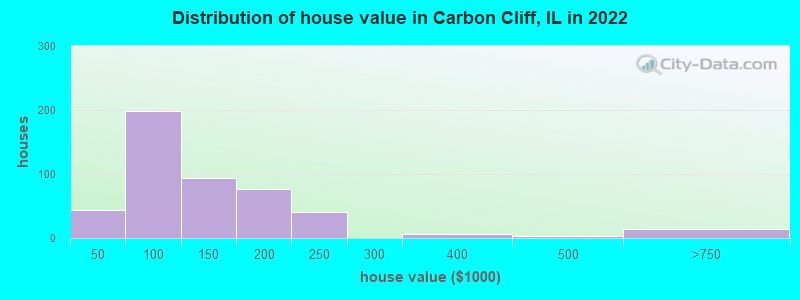
Home value of owner - occupied houses in 2022 in Carbon Cliff, IL
-
- 27Less than $10,000
- 1$15,000 to $19,999
- 4$25,000 to $29,999
- 1$30,000 to $34,999
- 8$35,000 to $39,999
- 8$50,000 to $59,999
- 53$60,000 to $69,999
- 33$70,000 to $79,999
- 52$80,000 to $89,999
- 50$90,000 to $99,999
- 61$100,000 to $124,999
- 31$125,000 to $149,999
- 53$150,000 to $174,999
- 23$175,000 to $199,999
- 40$200,000 to $249,999
- 6$300,000 to $399,999
- 3$400,000 to $499,999
- 13$500,000 to $749,999
Rent paid by renters in 2022 in Carbon Cliff, IL
-
- 0$300 to $349
- 2$350 to $399
- 25$450 to $499
- 22$500 to $549
- 24$600 to $649
- 5$650 to $699
- 11$700 to $749
- 28$750 to $799
- 78$800 to $899
- 50$900 to $999
- 17$1,000 to $1,249
- 2$2,000 to $2,499
- 12No cash rent


Percentage of workers working in this county: 69.6%
Number of people working at home: 21 (2.5% of all workers)
Travel time to work (commute)
- Less than 5 minutes: 53
- 5 to 9 minutes: 69
- 10 to 14 minutes: 111
- 15 to 19 minutes: 168
- 20 to 24 minutes: 102
- 25 to 29 minutes: 142
- 30 to 34 minutes: 44
- 35 to 39 minutes: 11
- 40 to 44 minutes: 22
- 45 to 59 minutes: 44
- 60 to 89 minutes: 0
- 90 or more minutes: 16
Means of transportation to work:
- Drove a car alone: 658 (80.5%)
- Carpooled: 105 (12.9%)
- Bus or trolley bus: 5 (0.6%)
- Motorcycle: 2 (0.2%)
- Walked: 18 (2.2%)
- Other means: 12 (1.5%)
- Worked at home: 17 (2.1%)

- Unemployment by race in 2022
- Unemployment rate for White non-Hispanic residents
- 4.7%Males
- 6.2%Females
- Unemployment rate for Black residents
- 13.9%Males
- 27.8%Females

- Year of entry for the foreign-born population in Carbon Cliff, Illinois
- 322010 or later
- 172000 to 2009
- 481990 to 1999
- 111980 to 1989
- 01970 to 1979
- 19Before 1970

First ancestries reported:
- German: 238 (32.0%)
- Belgian: 41 (5.5%)
- English: 39 (5.2%)
- American: 32 (4.3%)
- Swedish: 27 (3.6%)
- Irish: 24 (3.2%)
- Northern European: 17 (2.3%)
- Danish: 13 (1.7%)
- Polish: 13 (1.7%)
- Italian: 8 (1.1%)
- European: 6 (0.8%)
- French Canadian: 6 (0.8%)
- Czech: 4 (0.5%)
- French: 3 (0.4%)
- Austrian: 2 (0.3%)
- Eastern European: 2 (0.3%)
- Scotch-Irish: 2 (0.3%)
Most common places of birth for foreign-born residents (%):
| Carbon Cliff: | 57.7% (64) |
| Illinois: | 34.7% (626,958) |
| Carbon Cliff: | 16.2% (18) |
| Illinois: | 0.1% (1,861) |
| Carbon Cliff: | 5.4% (6) |
| Illinois: | 0.0% (775) |
Place of birth for U.S.-born residents:
- This state: 1,264
- Other state: 601
- Northeast: 18
- Midwest: 315
- South: 168
- West: 100
86.4% of Carbon Cliff residents lived in the same house 1 years ago.
Out of people who lived in different houses, 26.1% lived in this county.
Out of people who lived in different counties, 40.6% lived in Illinois.
| Carbon Cliff: | 86.4% |
| State average: | 88.3% |
Education attainment for males 25 years and older:
- No schooling: 0
- Nursery to 4th grade: 0
- 5th and 6th grade: 0
- 7th and 8th grade: 3
- 9th grade: 3
- 10th grade: 24
- 11th grade: 17
- 12th grade, no diploma: 5
- High school graduate (or equivalency): 253
- Less than 1 year of college: 56
- Some college more than 1 year, no degree: 102
- Associate degree: 51
- Bachelor's degree: 25
- Master's degree: 4
- Professional school degree: 0
- Doctorate degree: 6

Education attainment for females 25 years and older:
- No schooling: 8
- Nursery to 4th grade: 0
- 5th and 6th grade: 5
- 7th and 8th grade: 4
- 9th grade: 15
- 10th grade: 30
- 11th grade: 47
- 12th grade, no diploma: 27
- High school graduate (or equivalency): 221
- Less than 1 year of college: 41
- Some college more than 1 year, no degree: 74
- Associate degree: 114
- Bachelor's degree: 50
- Master's degree: 14
- Professional school degree: 0
- Doctorate degree: 0

Housing units in structures:
- One, detached: 542
- One, attached: 25
- Two: 28
- 3 or 4: 10
- 5 to 9: 83
- 10 to 19: 81
- 20 to 49: 102
- 50 or more: 7
- Mobile homes: 4
Housing units lacking complete kitchen facilities in 2022: 0.7%
House/condo owner moved in on average 12 years ago
Renter moved in on average 3 years ago

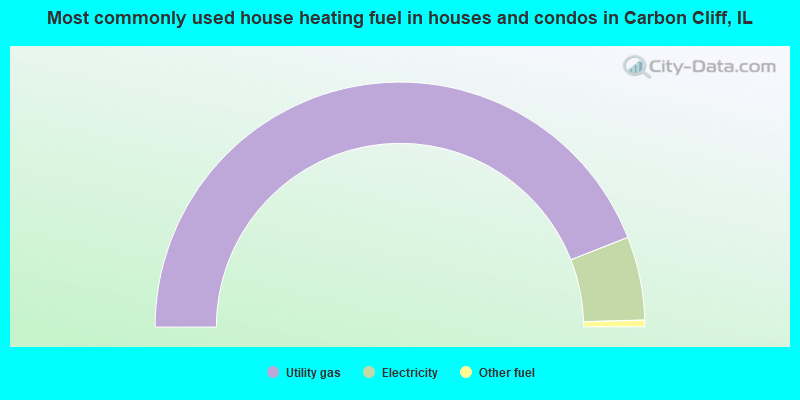
- 88.1%Utility gas
- 11.0%Electricity
- 0.9%Other fuel
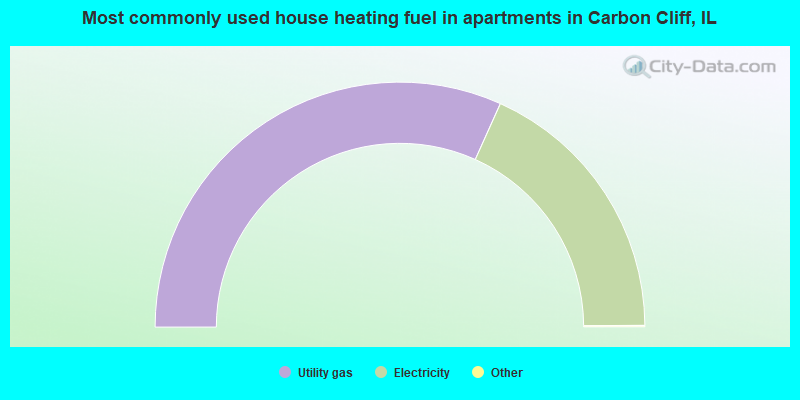
- 63.6%Utility gas
- 36.4%Electricity
Private vs. public school enrollment:
| Here: | 4.7% |
| Illinois: | 13.3% |
| Here: | 2.6% |
| Illinois: | 9.9% |
| Here: | 12.0% |
| Illinois: | 27.4% |


