Carmel, CA (California) Houses and Residents
| Carmel: | $1,804,802 |
| California: | $715,900 |
Total population: 15,677 (Urban population: 11,162, Rural population: 4,552 (all nonfarm))
Houses: 9,521 (7,746 occupied: 5,407 owner occupied, 2,339 renter occupied)
| % of renters here: | 30% |
| State: | 44% |
Housing density: 161 houses/condos per square mile
Median price asked for vacant for-sale houses and condos in 2022 in this county: $440,221.
Median contract rent in 2022: over $2,000 (lower quartile is $1,730, upper quartile is over $2,000)
Median rent asked for vacant for-rent units in 2022: $2,597
Median gross rent in Carmel, CA in 2022: over $2,000
Housing units in Carmel with a mortgage: 2,883 (266 second mortgage, 583 home equity loan, 20 both second mortgage and home equity loan)
Houses without a mortgage: 1,983
Compare current foreclosures near Carmel, CA:
| Photo | Address | Area | Beds / Baths | Price | Details |
|---|---|---|---|---|---|

|
#1
The Crossroads Blvd # 298
Carmel, CA 93923
|
967 sq. feet
|
2 baths 3 beds |
show details | |

|
#2
Pancho Way
Carmel, CA 93923
|
1,624 sq. feet
|
2 baths 3 beds |
show details | |

|
#3
Dougherty Pl
Carmel, CA 93923
|
2,794 sq. feet
|
5 baths 6 beds |
show details | |

|
#4
Tierra Grande Dr
Carmel, CA 93923
|
2,023 sq. feet
|
2 baths 3 beds |
show details | |

|
#5
N Carmel Hills Dr
Carmel, CA 93923
|
515 sq. feet
|
2 baths 3 beds |
show details | |

|
#6
El Camino Estrada
Carmel, CA 93923
|
1,122 sq. feet
|
1 baths 2 beds |
show details | |

|
#7
Sycamore Pl
Carmel, CA 93923
|
1,290 sq. feet
|
2 baths 3 beds |
show details | |

|
#8
Grey Goose Gulch Apt 1
Carmel, CA 93923
|
- sq. feet
|
- baths - beds |
show details | |

|
#9
Aguajito Rd
Carmel, CA 93923
|
- sq. feet
|
- baths - beds |
show details | |

|
#10
Grey Goose Gulch Apt 9
Carmel, CA 93923
|
- sq. feet
|
- baths - beds |
show details |
| Photo | Address | Area | Beds / Baths | Price | Details |
|---|---|---|---|---|---|

|
#11
Junipero Ave
Carmel, CA 93923
|
- sq. feet
|
- baths - beds |
show details | |

|
#12
Center St Apt 63
Carmel, CA 93923
|
- sq. feet
|
- baths - beds |
show details | |

|
#13
Carmel Valley Rd
Carmel, CA 93923
|
- sq. feet
|
- baths - beds |
show details | |

|
#14
Belavida Rd
Monterey, CA 93940
|
5,790 sq. feet
|
5 baths 5 beds |
show details | |

|
#15
Legends Ct
Salinas, CA 93908
|
3,821 sq. feet
|
4 baths 5 beds |
show details | |

|
#16
La Mesa Dr
Salinas, CA 93901
|
1,456 sq. feet
|
2 baths 3 beds |
show details | |

|
#17
W Alisal St
Salinas, CA 93901
|
2,122 sq. feet
|
1 baths 3 beds |
show details | |

|
#18
Alameda Ave
Salinas, CA 93901
|
1,720 sq. feet
|
2 baths 3 beds |
show details | |

|
#19
Fulton Way
Salinas, CA 93907
|
1,248 sq. feet
|
2 baths 3 beds |
show details | |

|
#20
Work Ave
Monterey, CA 93940
|
2,048 sq. feet
|
3 baths 4 beds |
show details |
| Photo | Address | Area | Beds / Baths | Price | Details |
|---|---|---|---|---|---|

|
#21
Ocean Pines Ln
Pebble Beach, CA 93953
|
1,342 sq. feet
|
2 baths 2 beds |
show details | |

|
#22
Kennedy Ct
Marina, CA 93933
|
1,824 sq. feet
|
2 baths 3 beds |
show details | |

|
#23
Viking Ln
Marina, CA 93933
|
1,452 sq. feet
|
2 baths 4 beds |
show details | |

|
#24
Stonehaven
Salinas, CA 93908
|
1,716 sq. feet
|
2 baths 4 beds |
show details | |

|
#25
Azalea Ct
Salinas, CA 93908
|
1,570 sq. feet
|
2 baths 3 beds |
show details | |

|
#26
Acclaim Dr
Salinas, CA 93908
|
1,831 sq. feet
|
2 baths 4 beds |
show details | |

|
#27
Riverbend Rd
Salinas, CA 93908
|
2,603 sq. feet
|
3 baths 4 beds |
show details | |

|
#28
Legends Ct
Salinas, CA 93908
|
3,821 sq. feet
|
4 baths 5 beds |
show details | |

|
#29
Yerba Buena Ct
Seaside, CA 93955
|
1,531 sq. feet
|
2 baths 3 beds |
show details | |

|
#30
Reservation Rd
Salinas, CA 93908
|
1,481 sq. feet
|
2 baths 2 beds |
show details |
| Photo | Address | Area | Beds / Baths | Price | Details |
|---|---|---|---|---|---|

|
#31
Portola Dr
Salinas, CA 93908
|
1,748 sq. feet
|
2 baths 3 beds |
show details | |

|
#32
Abdy Way
Marina, CA 93933
|
1,974 sq. feet
|
2 baths 4 beds |
show details | |

|
#33
Crescent Ave
Marina, CA 93933
|
1,799 sq. feet
|
2 baths 3 beds |
show details | |

|
#34
Villa Cir
Marina, CA 93933
|
1,500 sq. feet
|
2 baths 3 beds |
show details | |

|
#35
Yosemite St
Seaside, CA 93955
|
1,456 sq. feet
|
1 baths 3 beds |
show details | |

|
#36
Ninole Dr
Marina, CA 93933
|
1,640 sq. feet
|
2 baths 3 beds |
show details | |

|
#37
Reindollar Ave
Marina, CA 93933
|
1,039 sq. feet
|
1 baths 3 beds |
show details | |

|
#38
Ellen Ct
Marina, CA 93933
|
1,276 sq. feet
|
2 baths 4 beds |
show details | |

|
#39
Harper Canyon Rd
Salinas, CA 93908
|
1,901 sq. feet
|
2 baths 3 beds |
show details | |

|
#40
Flower Cir
Marina, CA 93933
|
1,092 sq. feet
|
1 baths 3 beds |
show details |
| Photo | Address | Area | Beds / Baths | Price | Details |
|---|---|---|---|---|---|

|
#41
Lindberg Ct
Seaside, CA 93955
|
2,302 sq. feet
|
2 baths 3 beds |
show details | |

|
#42
Ellis Ct
Marina, CA 93933
|
1,258 sq. feet
|
2 baths 3 beds |
show details | |

|
#43
Everett Cir
Marina, CA 93933
|
1,455 sq. feet
|
2 baths 3 beds |
show details | |

|
#44
Messinger Dr
Marina, CA 93933
|
1,440 sq. feet
|
2 baths 3 beds |
show details | |

|
#45
Messinger Dr
Marina, CA 93933
|
1,584 sq. feet
|
2 baths 4 beds |
show details | |

|
#46
Everett Dr
Marina, CA 93933
|
1,092 sq. feet
|
1 baths 3 beds |
show details | |

|
#47
Indian Springs Rd
Salinas, CA 93908
|
3,568 sq. feet
|
4 baths 5 beds |
show details | |

|
#48
Napa St
Seaside, CA 93955
|
1,030 sq. feet
|
1 baths 3 beds |
show details | |

|
#49
Calle De La Paloma
Carmel Valley, CA 93924
|
1,895 sq. feet
|
2 baths 4 beds |
show details | |

|
Check over 1 million property listings on Foreclosure.com!
|
browse all offers | |||

Household type by relationship:
Households: 396,355- In family households: 349,172 (62,828 male householders, 27,644 female householders)
66,660 spouses, 127,479 children (120,910 natural, 2,141 adopted, 4,428 stepchildren), 12,180 grandchildren, 8,078 brothers or sisters, 5,658 parents, foster children, 15,064 other relatives, 17,769 non-relatives
- In nonfamily households: 47,183 (15,867 male householders (11,385 living alone)), 19,607 female householders (15,932 living alone)), 11,709 nonrelatives
- In group quarters: 18,702 (12,547 institutionalized population)
75,563 married couples with children.
20,779 single-parent households (5,467 men, 15,312 women).
88.1% of residents of Carmel speak English at home.
3.4% of residents speak Spanish at home (65% speak English very well, 23% speak English well, 8% speak English not well, 3% don't speak English at all).
6.5% of residents speak other Indo-European language at home (77% speak English very well, 20% speak English well, 3% speak English not well).
1.7% of residents speak Asian or Pacific Island language at home (60% speak English very well, 29% speak English well, 5% speak English not well, 5% don't speak English at all).
0.3% of residents speak other language at home (75% speak English very well, 11% speak English well, 13% speak English not well).
Foreign born population: 1,794 (10.6%)
(63.8% of them are naturalized citizens)
| Here: | 7.0 |
| State: | 6.0 |
| Here: | 4.2 |
| State: | 3.9 |

- Bedrooms in owner-occupied houses and condos in Carmel, California
- 46no bedroom
- 2621 bedroom
- 1,5742 bedrooms
- 2,1713 bedrooms
- 1,1054 bedrooms
- 2495+ bedrooms

- Bedrooms in renter-occupied apartments in Carmel, California
- 247no bedroom
- 8091 bedroom
- 7892 bedrooms
- 3673 bedrooms
- 1004 bedrooms
- 275+ bedrooms

- Cars and other vehicles available in Carmel in owner-occupied houses/condos
- 235no vehicle
- 1,7811 vehicle
- 2,0652 vehicles
- 9123 vehicles
- 2614 vehicles
- 1535+ vehicles

- Cars and other vehicles available in Carmel in renter-occupied apartments
- 270no vehicle
- 1,1961 vehicle
- 6982 vehicles
- 1033 vehicles
- 444 vehicles
- 285+ vehicles

- Rooms in owner-occupied houses in Carmel, California
- 311 room
- 762 rooms
- 1843 rooms
- 5594 rooms
- 1,0345 rooms
- 1,1656 rooms
- 1,0677 rooms
- 6598 rooms
- 6329+ rooms

- Rooms in renter-occupied apartments in Carmel, California
- 2021 room
- 3642 rooms
- 4583 rooms
- 4774 rooms
- 3955 rooms
- 2396 rooms
- 1227 rooms
- 358 rooms
- 479+ rooms


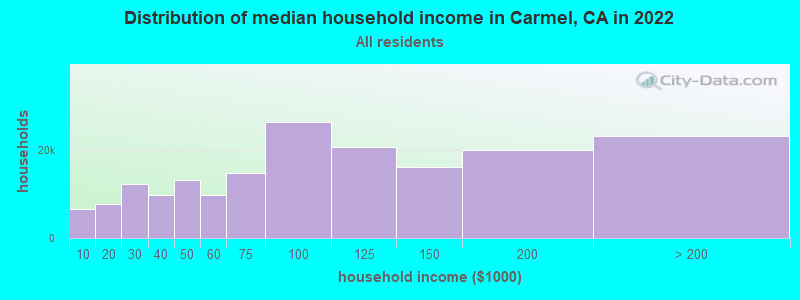
Carmel, CA household income distribution

- 6,541Less than $10,000
- 7,616$10,000 to $19,999
- 12,316$20,000 to $29,999
- 9,700$30,000 to $39,999
- 13,149$40,000 to $49,999
- 9,755$50,000 to $59,999
- 14,688$60,000 to $74,999
- 26,327$75,000 to $99,999
- 20,541$100,000 to $124,999
- 16,171$125,000 to $149,999
- 19,992$150,000 to $199,999
- 23,152$200,000 or more
Percentage of workers working in this county: 91.7%
Number of people working at home: 957 (12.1% of all workers)
Travel time to work (commute)
- Less than 5 minutes: 339
- 5 to 9 minutes: 1,047
- 10 to 14 minutes: 1,505
- 15 to 19 minutes: 1,226
- 20 to 24 minutes: 849
- 25 to 29 minutes: 148
- 30 to 34 minutes: 415
- 35 to 39 minutes: 104
- 40 to 44 minutes: 159
- 45 to 59 minutes: 132
- 60 to 89 minutes: 168
- 90 or more minutes: 174
Means of transportation to work:
- Drove a car alone: 5,165 (72.5%)
- Carpooled: 718 (10.1%)
- Bus or trolley bus: 26 (0.4%)
- Taxi: 8 (0.1%)
- Motorcycle: 23 (0.3%)
- Bicycle: 8 (0.1%)
- Walked: 285 (4.0%)
- Other means: 33 (0.5%)
- Worked at home: 854 (12.0%)


- Year of entry for the foreign-born population in Carmel, California
- 2031995 to March 2000
- 1091990 to 1994
- 831985 to 1989
- 1821980 to 1984
- 721975 to 1979
- 1171970 to 1974
- 951965 to 1969
- 767Before 1965
Most common places of birth for foreign-born residents (%):
| Carmel: | 12.2% (198) |
| California: | 1.5% (133,090) |
| Carmel: | 9.2% (150) |
| California: | 1.1% (98,160) |
| Carmel: | 9.2% (149) |
| California: | 1.6% (141,181) |
| Carmel: | 9.0% (147) |
| California: | 44.3% (3,928,701) |
| Carmel: | 5.5% (89) |
| California: | 0.4% (38,450) |
| Carmel: | 4.9% (80) |
| California: | 7.5% (664,935) |
| Carmel: | 4.6% (75) |
| California: | 3.0% (268,452) |
| Carmel: | 4.4% (71) |
| California: | 0.1% (11,701) |
| Carmel: | 3.1% (50) |
| California: | 0.2% (16,809) |
| Carmel: | 3.0% (49) |
| California: | 1.3% (112,212) |
| Carmel: | 2.8% (46) |
| California: | 1.8% (158,613) |
| Carmel: | 2.6% (43) |
| California: | 0.2% (13,438) |
| Carmel: | 2.6% (42) |
| California: | 0.4% (32,279) |
| Carmel: | 2.5% (41) |
| California: | 0.2% (18,478) |
| Carmel: | 2.5% (41) |
| California: | 0.3% (22,311) |
| Carmel: | 2.2% (36) |
| California: | 3.7% (327,611) |
| Carmel: | 2.1% (35) |
| California: | 0.6% (54,660) |
| Carmel: | 1.7% (28) |
| California: | 0.3% (29,335) |
| Carmel: | 1.6% (26) |
| California: | 0.2% (16,885) |
Place of birth for U.S.-born residents:
- This state: 7,082
- Other state: 6,831
- Northeast: 1,977
- Midwest: 2,544
- South: 1,190
- West: 1,120
61% of Carmel residents lived in the same house 5 years ago.
Out of people who lived in different houses, 55% lived in this county.
Out of people who lived in different counties, 72% lived in California.
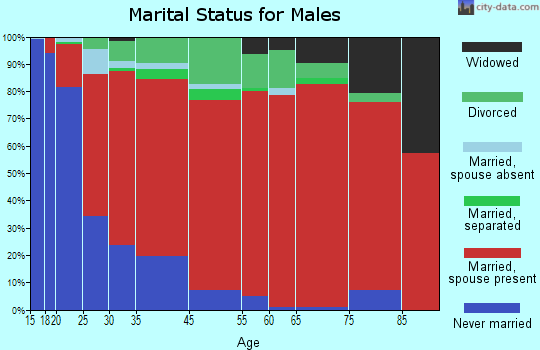
Education attainment for males 25 years and older:
- No schooling: 26
- Nursery to 4th grade: 19
- 5th and 6th grade: 24
- 7th and 8th grade: 42
- 9th grade: 8
- 10th grade: 27
- 11th grade: 14
- 12th grade, no diploma: 53
- High school graduate (or equivalency): 566
- Less than 1 year of college: 290
- Some college more than 1 year, no degree: 977
- Associate degree: 362
- Bachelor's degree: 1,688
- Master's degree: 902
- Professional school degree: 551
- Doctorate degree: 217

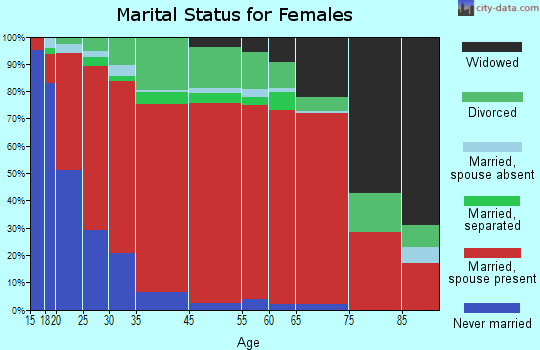
Education attainment for females 25 years and older:
- No schooling: 38
- Nursery to 4th grade: 0
- 5th and 6th grade: 16
- 7th and 8th grade: 16
- 9th grade: 53
- 10th grade: 44
- 11th grade: 42
- 12th grade, no diploma: 109
- High school graduate (or equivalency): 950
- Less than 1 year of college: 392
- Some college more than 1 year, no degree: 1,602
- Associate degree: 562
- Bachelor's degree: 2,137
- Master's degree: 965
- Professional school degree: 290
- Doctorate degree: 133

Housing units in structures:
- One, detached: 7,442
- One, attached: 804
- Two: 253
- 3 or 4: 242
- 5 to 9: 231
- 10 to 19: 200
- 20 to 49: 163
- 50 or more: 186

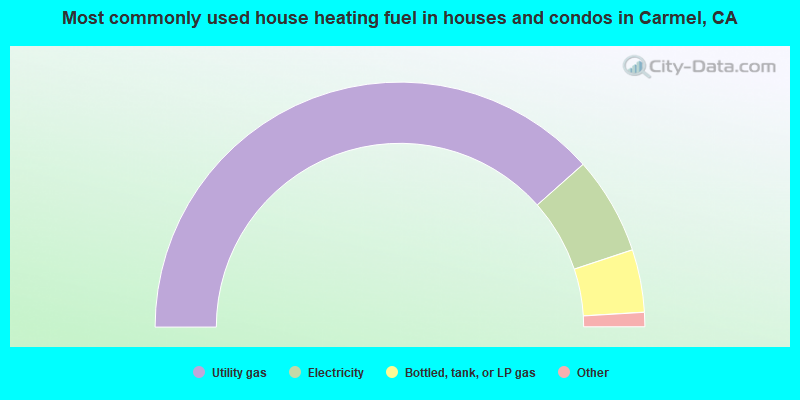
- 76.9%Utility gas
- 12.9%Electricity
- 8.3%Bottled, tank, or LP gas
- 1.2%Wood
- 0.3%Solar energy
- 0.3%Fuel oil, kerosene, etc.
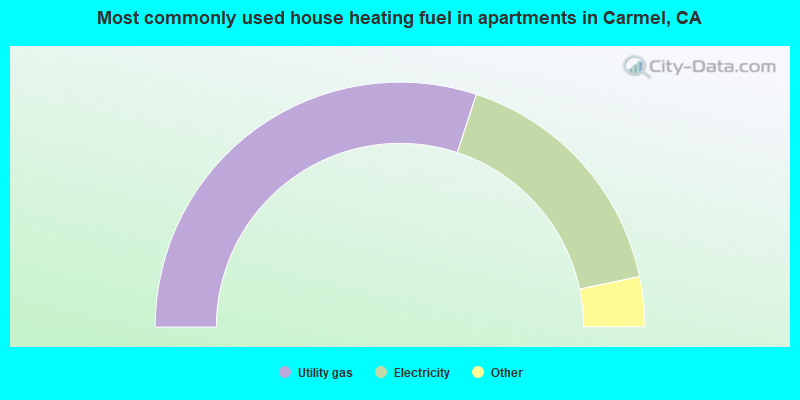
- 60.1%Utility gas
- 33.3%Electricity
- 3.0%Bottled, tank, or LP gas
- 2.3%Wood
- 0.7%Other fuel
- 0.3%No fuel used
- 0.2%Fuel oil, kerosene, etc.
Private vs. public school enrollment:
| Here: | 18.9% |
| California: | 9.9% |
| Here: | 16.9% |
| California: | 7.8% |
| Here: | 12.8% |
| California: | 15.4% |


