Carmel Valley, CA (California) Houses and Residents
| Carmel Valley: | $1,367,257 |
| California: | $715,900 |
Total population: 6,266 (Urban population: 2,784, Rural population: 3,497 (102 farm, 3,395 nonfarm))
Houses: 2,919 (2,615 occupied: 1,842 owner occupied, 773 renter occupied)
| % of renters here: | 30% |
| State: | 44% |
Housing density: 15 houses/condos per square mile
Median price asked for vacant for-sale houses and condos in 2022 in this county: $440,221.
Median contract rent in 2022: $1,976 (lower quartile is $1,389, upper quartile is over $2,000)
Median rent asked for vacant for-rent units in 2022: $1,724
Median gross rent in Carmel Valley, CA in 2022: over $2,000
Housing units in Carmel Valley with a mortgage: 1,174 (169 second mortgage, 116 home equity loan, 23 both second mortgage and home equity loan)
Houses without a mortgage: 339
Compare current foreclosures near Carmel Valley, CA:
| Photo | Address | Area | Beds / Baths | Price | Details |
|---|---|---|---|---|---|

|
#1
El Caminito Rd
Carmel Valley, CA 93924
|
2,153 sq. feet
|
3 baths 4 beds |
show details | |

|
#2
Calle De La Paloma
Carmel Valley, CA 93924
|
1,895 sq. feet
|
2 baths 4 beds |
show details | |

|
#3
Sky Ranch Rd
Carmel Valley, CA 93924
|
- sq. feet
|
- baths - beds |
show details | |

|
#4
Paloma Ave
Salinas, CA 93905
|
854 sq. feet
|
1 baths 2 beds |
show details | |

|
#5
Fulton Way
Salinas, CA 93907
|
1,248 sq. feet
|
2 baths 3 beds |
show details | |

|
#6
Work Ave
Monterey, CA 93940
|
2,048 sq. feet
|
3 baths 4 beds |
show details | |

|
#7
La Mesa Dr
Salinas, CA 93901
|
1,456 sq. feet
|
2 baths 3 beds |
show details | |

|
#8
Alameda Ave
Salinas, CA 93901
|
1,720 sq. feet
|
2 baths 3 beds |
show details | |

|
#9
Legends Ct
Salinas, CA 93908
|
3,821 sq. feet
|
4 baths 5 beds |
show details | |

|
#10
Arezzo Cir
Salinas, CA 93905
|
2,131 sq. feet
|
2 baths 5 beds |
show details |
| Photo | Address | Area | Beds / Baths | Price | Details |
|---|---|---|---|---|---|

|
#11
Ocean Pines Ln
Pebble Beach, CA 93953
|
1,342 sq. feet
|
2 baths 2 beds |
show details | |

|
#12
Belavida Rd
Monterey, CA 93940
|
5,790 sq. feet
|
5 baths 5 beds |
show details | |

|
#13
W Alisal St
Salinas, CA 93901
|
2,122 sq. feet
|
1 baths 3 beds |
show details | |

|
#14
2nd St
Pacific Grove, CA 93950
|
998 sq. feet
|
1 baths 2 beds |
show details | |

|
#15
Coleridge Dr
Salinas, CA 93901
|
2,190 sq. feet
|
2 baths 3 beds |
show details | |

|
#16
Los Olivos Dr Unit 20
Salinas, CA 93901
|
1,275 sq. feet
|
1 baths 2 beds |
show details | |

|
#17
Ellen Ct
Marina, CA 93933
|
1,276 sq. feet
|
2 baths 4 beds |
show details | |

|
#18
Via Paraiso
Salinas, CA 93901
|
1,792 sq. feet
|
2 baths 3 beds |
show details | |

|
#19
Luxton St
Seaside, CA 93955
|
570 sq. feet
|
1 baths 2 beds |
show details | |

|
#20
Fulton Way
Salinas, CA 93907
|
1,248 sq. feet
|
2 baths 3 beds |
show details |
| Photo | Address | Area | Beds / Baths | Price | Details |
|---|---|---|---|---|---|

|
#21
Chaucer Dr
Salinas, CA 93901
|
1,360 sq. feet
|
2 baths 3 beds |
show details | |

|
#22
1st St
Monterey, CA 93940
|
1,016 sq. feet
|
3 baths 3 beds |
show details | |

|
#23
Lawton Ave
Pacific Grove, CA 93950
|
638 sq. feet
|
1 baths 2 beds |
show details | |

|
#24
Lombard Cir
Salinas, CA 93907
|
1,522 sq. feet
|
2 baths 3 beds |
show details | |

|
#25
La Mesa Dr
Salinas, CA 93901
|
1,874 sq. feet
|
2 baths 3 beds |
show details | |

|
#26
Garner Ave
Salinas, CA 93905
|
1,030 sq. feet
|
3 baths 3 beds |
show details | |

|
#27
Beach Way
Monterey, CA 93940
|
2,080 sq. feet
|
3 baths 3 beds |
show details | |

|
#28
Sunset Vista Dr
Seaside, CA 93955
|
3,208 sq. feet
|
2 baths 3 beds |
show details | |

|
#29
N Carmel Hills Dr
Carmel, CA 93923
|
515 sq. feet
|
2 baths 3 beds |
show details | |

|
#30
Everett Cir
Marina, CA 93933
|
1,455 sq. feet
|
2 baths 3 beds |
show details |
| Photo | Address | Area | Beds / Baths | Price | Details |
|---|---|---|---|---|---|

|
#31
Rico St
Salinas, CA 93907
|
1,478 sq. feet
|
2 baths 3 beds |
show details | |

|
#32
Everett Dr
Marina, CA 93933
|
1,092 sq. feet
|
1 baths 3 beds |
show details | |

|
#33
Saint Edwards Dr
Salinas, CA 93905
|
1,247 sq. feet
|
2 baths 3 beds |
show details | |

|
#34
Monterey Ave
Pacific Grove, CA 93950
|
768 sq. feet
|
1 baths 2 beds |
show details | |

|
#35
Victor St
Salinas, CA 93907
|
1,234 sq. feet
|
2 baths 3 beds |
show details | |

|
#36
Bush St
Salinas, CA 93907
|
1,080 sq. feet
|
2 baths 2 beds |
show details | |

|
#37
Saint Augustine Dr
Salinas, CA 93905
|
1,384 sq. feet
|
2 baths 3 beds |
show details | |

|
#38
Kennedy Ct
Marina, CA 93933
|
1,824 sq. feet
|
2 baths 3 beds |
show details | |

|
#39
Vincent Pl
Salinas, CA 93907
|
1,723 sq. feet
|
3 baths 4 beds |
show details | |

|
#40
Alameda Ave
Salinas, CA 93901
|
1,720 sq. feet
|
2 baths 3 beds |
show details |
| Photo | Address | Area | Beds / Baths | Price | Details |
|---|---|---|---|---|---|

|
#41
Lily St
Monterey, CA 93940
|
1,386 sq. feet
|
1 baths 2 beds |
show details | |

|
#42
Archer St
Salinas, CA 93901
|
1,619 sq. feet
|
2 baths 4 beds |
show details | |

|
#43
Melrose Dr
Salinas, CA 93901
|
1,708 sq. feet
|
3 baths 3 beds |
show details | |

|
#44
Melrose Dr
Salinas, CA 93901
|
1,680 sq. feet
|
2 baths 4 beds |
show details | |

|
#45
Roosevelt St
Salinas, CA 93905
|
826 sq. feet
|
1 baths 2 beds |
show details | |

|
#46
Lemos Ave
Salinas, CA 93901
|
1,542 sq. feet
|
2 baths 3 beds |
show details | |

|
#47
Seeno St
Monterey, CA 93940
|
2,517 sq. feet
|
4 baths 4 beds |
show details | |

|
#48
Jean Ave
Salinas, CA 93905
|
973 sq. feet
|
1 baths 3 beds |
show details | |

|
#49
E Alisal St
Salinas, CA 93905
|
780 sq. feet
|
1 baths 2 beds |
show details | |

|
Check over 1 million property listings on Foreclosure.com!
|
browse all offers | |||

Household type by relationship:
Households: 396,355- In family households: 349,172 (62,828 male householders, 27,644 female householders)
66,660 spouses, 127,479 children (120,910 natural, 2,141 adopted, 4,428 stepchildren), 12,180 grandchildren, 8,078 brothers or sisters, 5,658 parents, foster children, 15,064 other relatives, 17,769 non-relatives
- In nonfamily households: 47,183 (15,867 male householders (11,385 living alone)), 19,607 female householders (15,932 living alone)), 11,709 nonrelatives
- In group quarters: 18,702 (12,547 institutionalized population)
75,563 married couples with children.
20,779 single-parent households (5,467 men, 15,312 women).
85.8% of residents of Carmel Valley speak English at home.
7.8% of residents speak Spanish at home (68% speak English very well, 11% speak English well, 17% speak English not well, 3% don't speak English at all).
5.4% of residents speak other Indo-European language at home (79% speak English very well, 12% speak English well, 9% speak English not well).
1.0% of residents speak Asian or Pacific Island language at home (62% speak English very well, 38% speak English well).
Foreign born population: 633 (9.4%)
(30.6% of them are naturalized citizens)
| Here: | 7.0 |
| State: | 6.0 |
| Here: | 4.2 |
| State: | 3.9 |

- Bedrooms in owner-occupied houses and condos in Carmel Valley, California
- 28no bedroom
- 1141 bedroom
- 4212 bedrooms
- 9073 bedrooms
- 3094 bedrooms
- 635+ bedrooms

- Bedrooms in renter-occupied apartments in Carmel Valley, California
- 144no bedroom
- 2761 bedroom
- 1782 bedrooms
- 1423 bedrooms
- 274 bedrooms
- 65+ bedrooms

- Cars and other vehicles available in Carmel Valley in owner-occupied houses/condos
- 21no vehicle
- 2971 vehicle
- 8472 vehicles
- 4953 vehicles
- 1164 vehicles
- 665+ vehicles

- Cars and other vehicles available in Carmel Valley in renter-occupied apartments
- 114no vehicle
- 3711 vehicle
- 2092 vehicles
- 473 vehicles
- 324 vehicles
- 05+ vehicles

- Rooms in owner-occupied houses in Carmel Valley, California
- 281 room
- 82 rooms
- 1303 rooms
- 1474 rooms
- 3535 rooms
- 5196 rooms
- 2477 rooms
- 1388 rooms
- 2729+ rooms

- Rooms in renter-occupied apartments in Carmel Valley, California
- 1221 room
- 1772 rooms
- 1553 rooms
- 1244 rooms
- 745 rooms
- 596 rooms
- 267 rooms
- 308 rooms
- 69+ rooms


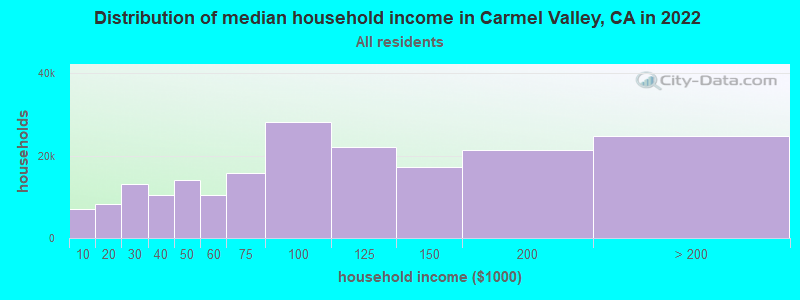
Carmel Valley, CA household income distribution

- 7,006Less than $10,000
- 8,157$10,000 to $19,999
- 13,192$20,000 to $29,999
- 10,389$30,000 to $39,999
- 14,083$40,000 to $49,999
- 10,448$50,000 to $59,999
- 15,732$60,000 to $74,999
- 28,198$75,000 to $99,999
- 22,001$100,000 to $124,999
- 17,320$125,000 to $149,999
- 21,413$150,000 to $199,999
- 24,798$200,000 or more
Percentage of workers working in this county: 95.2%
Number of people working at home: 448 (12.0% of all workers)
Travel time to work (commute)
- Less than 5 minutes: 125
- 5 to 9 minutes: 239
- 10 to 14 minutes: 315
- 15 to 19 minutes: 226
- 20 to 24 minutes: 526
- 25 to 29 minutes: 306
- 30 to 34 minutes: 749
- 35 to 39 minutes: 61
- 40 to 44 minutes: 104
- 45 to 59 minutes: 175
- 60 to 89 minutes: 120
- 90 or more minutes: 131
Means of transportation to work:
- Drove a car alone: 2,641 (79.2%)
- Carpooled: 344 (10.3%)
- Bus or trolley bus: 7 (0.2%)
- Subway or elevated: 7 (0.2%)
- Bicycle: 9 (0.3%)
- Walked: 11 (0.3%)
- Other means: 58 (1.7%)
- Worked at home: 259 (7.8%)

- Year of entry for the foreign-born population in Carmel Valley, California
- 1341995 to March 2000
- 501990 to 1994
- 751985 to 1989
- 631980 to 1984
- 661975 to 1979
- 671970 to 1974
- 251965 to 1969
- 95Before 1965
Most common places of birth for foreign-born residents (%):
| Carmel Valley: | 26.3% (151) |
| California: | 44.3% (3,928,701) |
| Carmel Valley: | 12.7% (73) |
| California: | 1.6% (141,181) |
| Carmel Valley: | 8.0% (46) |
| California: | 1.5% (133,090) |
| Carmel Valley: | 5.7% (33) |
| California: | 0.4% (32,279) |
| Carmel Valley: | 5.6% (32) |
| California: | 0.6% (54,660) |
| Carmel Valley: | 4.9% (28) |
| California: | 0.3% (22,931) |
| Carmel Valley: | 4.5% (26) |
| California: | 1.1% (98,160) |
| Carmel Valley: | 4.0% (23) |
| California: | 0.2% (20,388) |
| Carmel Valley: | 4.0% (23) |
| California: | 0.2% (16,809) |
| Carmel Valley: | 3.8% (22) |
| California: | 4.7% (418,249) |
| Carmel Valley: | 2.8% (16) |
| California: | 1.8% (158,613) |
| Carmel Valley: | 2.4% (14) |
| California: | 0.7% (62,114) |
| Carmel Valley: | 2.3% (13) |
| California: | 7.5% (664,935) |
| Carmel Valley: | 2.1% (12) |
| California: | 0.1% (11,635) |
| Carmel Valley: | 1.9% (11) |
| California: | 0.1% (11,383) |
| Carmel Valley: | 1.9% (11) |
| California: | 3.7% (327,611) |
| Carmel Valley: | 1.6% (9) |
| California: | 0.2% (18,478) |
Place of birth for U.S.-born residents:
- This state: 3,490
- Other state: 2,124
- Northeast: 567
- Midwest: 771
- South: 397
- West: 389
60% of Carmel Valley residents lived in the same house 5 years ago.
Out of people who lived in different houses, 55% lived in this county.
Out of people who lived in different counties, 79% lived in California.
Education attainment for males 25 years and older:
- No schooling: 16
- Nursery to 4th grade: 24
- 5th and 6th grade: 8
- 7th and 8th grade: 25
- 9th grade: 15
- 10th grade: 33
- 11th grade: 33
- 12th grade, no diploma: 38
- High school graduate (or equivalency): 262
- Less than 1 year of college: 183
- Some college more than 1 year, no degree: 471
- Associate degree: 166
- Bachelor's degree: 498
- Master's degree: 291
- Professional school degree: 119
- Doctorate degree: 110

Education attainment for females 25 years and older:
- No schooling: 20
- Nursery to 4th grade: 0
- 5th and 6th grade: 13
- 7th and 8th grade: 24
- 9th grade: 0
- 10th grade: 0
- 11th grade: 8
- 12th grade, no diploma: 38
- High school graduate (or equivalency): 310
- Less than 1 year of college: 134
- Some college more than 1 year, no degree: 490
- Associate degree: 252
- Bachelor's degree: 752
- Master's degree: 326
- Professional school degree: 113
- Doctorate degree: 17


Housing units in structures:
- One, detached: 2,316
- One, attached: 247
- Two: 53
- 3 or 4: 60
- 5 to 9: 20
- 10 to 19: 71
- 20 to 49: 21
- 50 or more: 29
- Mobile homes: 93
- Boats, RVs, vans, etc.: 9
Median worth of mobile homes: $77,152
Housing units lacking complete kitchen facilities: 2.8%

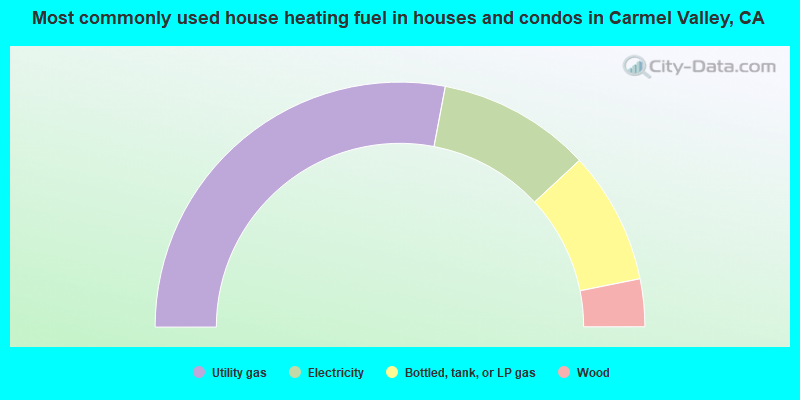
- 55.9%Utility gas
- 20.2%Electricity
- 17.5%Bottled, tank, or LP gas
- 6.3%Wood
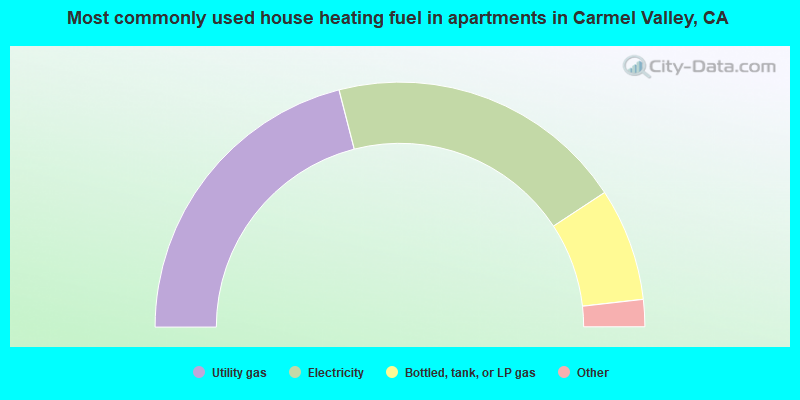
- 42.0%Utility gas
- 39.5%Electricity
- 14.9%Bottled, tank, or LP gas
- 2.2%Other fuel
- 1.4%Wood
Private vs. public school enrollment:
| Here: | 15.6% |
| California: | 9.9% |
| Here: | 9.8% |
| California: | 7.8% |
| Here: | 34.8% |
| California: | 15.4% |


