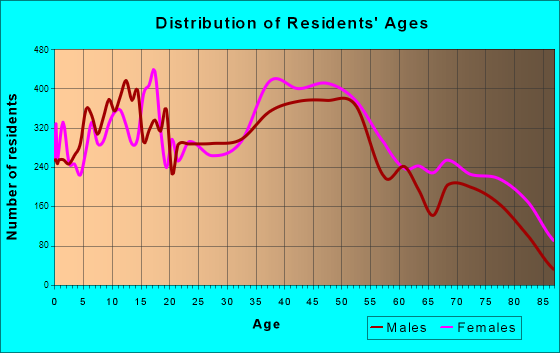
Carmichael, CA (California) Houses and Residents
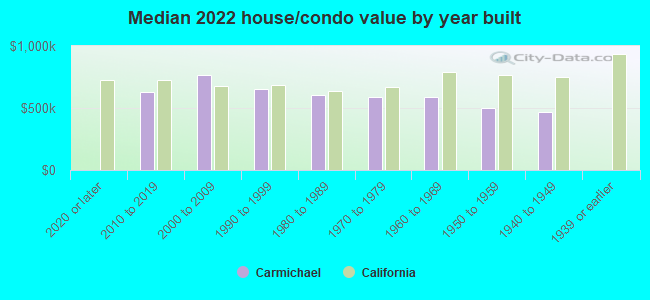
| Carmichael: | $580,500 |
| California: | $715,900 |
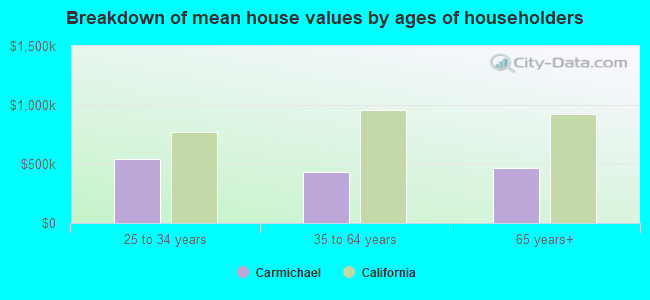
Mean price in 2022:
Detached houses: $593,822
Here: $593,822 State: $988,808 Townhouses or other attached units: $465,035
Here: $465,035 State: $838,546 In 3-to-4-unit structures: $233,640
Here: $233,640 State: $824,253 In 5-or-more-unit structures: $381,724
Here: $381,724 State: $730,996 Mobile homes: $118,440
Here: $118,440 State: $184,506
Total population: 61,762 (Urban population: 49,742, Rural population: 0)
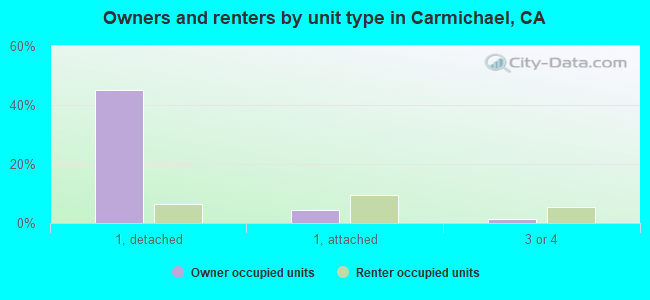
Houses: 35,401 (34,047 occupied: 17,912 owner occupied, 16,135 renter occupied)
| % of renters here: | 47% |
| State: | 44% |
Housing density: 3,290 houses/condos per square mile
Median price asked for vacant for-sale houses and condos in 2022: $325,664.
Median contract rent in 2022: $1,401 (lower quartile is $1,160, upper quartile is $1,786)
Median rent asked for vacant for-rent units in 2022: $2,841
Median gross rent in Carmichael, CA in 2022: $1,578
Housing units in Carmichael with a mortgage: 11,105 (800 second mortgage, 0 home equity loan, 685 both second mortgage and home equity loan)
Houses without a mortgage: 138
Median household income for houses/condos with a mortgage: $141,359
Median household income for apartments without a mortgage: $84,769
Median monthly housing costs: $1,577
Compare current foreclosures in Carmichael, CA:
| Photo | Address | Area | Beds / Baths | Price | Details |
|---|---|---|---|---|---|

|
#1
Remington Ave
Carmichael, CA 95608
|
1,273 sq. feet
|
1 baths 3 beds |
show details | |

|
#2
Casa Alegre
Carmichael, CA 95608
|
1,166 sq. feet
|
2 baths 2 beds |
show details | |

|
#3
Suffolk Way
Carmichael, CA 95608
|
1,875 sq. feet
|
2 baths 3 beds |
show details | |

|
#4
Scotch Ct
Carmichael, CA 95608
|
2,086 sq. feet
|
3 baths 4 beds |
show details | |

|
#5
Fair Oaks Blvd
Carmichael, CA 95608
|
2,221 sq. feet
|
2 baths 3 beds |
show details | |

|
#6
Silverton Way
Carmichael, CA 95608
|
1,164 sq. feet
|
1 baths 2 beds |
show details | |

|
#7
Tyrone Way
Carmichael, CA 95608
|
1,672 sq. feet
|
2 baths 3 beds |
show details | |

|
#8
Kirkland Way
Carmichael, CA 95608
|
1,335 sq. feet
|
2 baths 2 beds |
show details | |

|
#9
Wilkins Way
Carmichael, CA 95608
|
1,632 sq. feet
|
2 baths 3 beds |
show details | |

|
#10
Walnut Ave
Carmichael, CA 95608
|
1,124 sq. feet
|
1 baths 4 beds |
show details |
| Photo | Address | Area | Beds / Baths | Price | Details |
|---|---|---|---|---|---|

|
#11
Westmore Way
Carmichael, CA 95608
|
1,925 sq. feet
|
2 baths 3 beds |
show details | |

|
#12
Boyd Dr
Carmichael, CA 95608
|
962 sq. feet
|
1 baths 3 beds |
show details | |

|
#13
Stoney Way
Carmichael, CA 95608
|
1,688 sq. feet
|
1 baths 3 beds |
show details | |

|
#14
Wintun Dr
Carmichael, CA 95608
|
1,288 sq. feet
|
2 baths 3 beds |
show details | |

|
#15
Las Lindas Way
Carmichael, CA 95608
|
2,092 sq. feet
|
2 baths 3 beds |
show details | |

|
#16
Garfield Ave
Carmichael, CA 95608
|
1,669 sq. feet
|
2 baths 3 beds |
show details | |

|
#17
Holloway Ln
Carmichael, CA 95608
|
1,142 sq. feet
|
2 baths 3 beds |
show details | |

|
#18
Casa Alegre
Carmichael, CA 95608
|
1,380 sq. feet
|
2 baths 3 beds |
show details | |

|
#19
Martin Way
Carmichael, CA 95608
|
1,464 sq. feet
|
2 baths 3 beds |
show details | |

|
#20
Templeton Dr
Carmichael, CA 95608
|
1,688 sq. feet
|
1 baths 3 beds |
show details |
| Photo | Address | Area | Beds / Baths | Price | Details |
|---|---|---|---|---|---|

|
#21
Linda Lou Dr
Carmichael, CA 95608
|
1,456 sq. feet
|
2 baths 2 beds |
show details | |

|
#22
Palm Dr
Carmichael, CA 95608
|
1,754 sq. feet
|
2 baths 2 beds |
show details | |

|
#23
New Salem Ct
Carmichael, CA 95608
|
1,166 sq. feet
|
2 baths 3 beds |
show details | |

|
#24
Moraga Dr
Carmichael, CA 95608
|
1,266 sq. feet
|
2 baths 3 beds |
show details | |

|
#25
Fallwater Ln
Carmichael, CA 95608
|
1,577 sq. feet
|
2 baths 3 beds |
show details | |

|
#26
Sangamon St
Carmichael, CA 95608
|
1,721 sq. feet
|
2 baths 3 beds |
show details | |

|
#27
Marwick Way
Carmichael, CA 95608
|
1,078 sq. feet
|
2 baths 3 beds |
show details | |

|
#28
Glenbrook Ln
Carmichael, CA 95608
|
1,968 sq. feet
|
2 baths 5 beds |
show details | |

|
#29
Edgerton Way
Carmichael, CA 95608
|
- sq. feet
|
- baths - beds |
show details | |

|
#30
Marconi Ave Apt 155
Carmichael, CA 95608
|
- sq. feet
|
- baths - beds |
show details |
| Photo | Address | Area | Beds / Baths | Price | Details |
|---|---|---|---|---|---|

|
#31
Arden Way Apt 145
Carmichael, CA 95608
|
- sq. feet
|
- baths - beds |
show details | |

|
#32
Carmichael Way
Carmichael, CA 95608
|
- sq. feet
|
- baths - beds |
show details | |

|
#33
Rutland Dr
Carmichael, CA 95608
|
- sq. feet
|
- baths - beds |
show details | |

|
#34
Winding Way Apt 29
Carmichael, CA 95608
|
- sq. feet
|
- baths - beds |
show details | |

|
#35
Fair Oaks Blvd Apt 37
Carmichael, CA 95608
|
- sq. feet
|
- baths - beds |
show details | |

|
#36
Verla St
Carmichael, CA 95608
|
- sq. feet
|
- baths - beds |
show details | |

|
#37
Grant Park Dr
Carmichael, CA 95608
|
- sq. feet
|
- baths - beds |
show details | |

|
#38
Marconi Ave Apt 43
Carmichael, CA 95608
|
- sq. feet
|
- baths - beds |
show details | |

|
#39
Whitney Ave
Carmichael, CA 95608
|
- sq. feet
|
- baths - beds |
show details | |

|
#40
Shirley Ave
Carmichael, CA 95608
|
- sq. feet
|
- baths - beds |
show details |
| Photo | Address | Area | Beds / Baths | Price | Details |
|---|---|---|---|---|---|

|
#41
Marconi Ave Apt 126
Carmichael, CA 95608
|
- sq. feet
|
- baths - beds |
show details | |

|
#42
Fair Oaks Blvd Apt 32
Carmichael, CA 95608
|
- sq. feet
|
- baths - beds |
show details | |

|
#43
Manzanita Ave Apt 7
Carmichael, CA 95608
|
- sq. feet
|
- baths - beds |
show details | |

|
#44
Fair Oaks Blvd Apt 14
Carmichael, CA 95608
|
- sq. feet
|
- baths - beds |
show details | |

|
#45
Fairwood Way
Carmichael, CA 95608
|
- sq. feet
|
- baths - beds |
show details | |

|
#46
Fair Oaks Blvd Apt 81
Carmichael, CA 95608
|
- sq. feet
|
- baths - beds |
show details | |

|
#47
Woodleigh Dr
Carmichael, CA 95608
|
- sq. feet
|
- baths - beds |
show details | |

|
#48
Kenneth Ave Apt B
Carmichael, CA 95608
|
- sq. feet
|
- baths - beds |
show details | |

|
#49
Shirley Ave
Carmichael, CA 95608
|
- sq. feet
|
- baths - beds |
show details | |

|
Check over 1 million property listings on Foreclosure.com!
|
browse all offers | |||

Latest news about housing in Carmichael, CA collected exclusively by city-data.com from local newspapers, TV, and radio stations

 | Explain to me why highrise condos/apartments in Sacramento don't pencil out (87 replies) |
| Median Household Income Census Edition (33 replies) |
| Home prices in Carmichael, Fair Oaks and Folsom (33 replies) |
| CA Cities(Pop 65,000+) by Median Household Income, 2019 (8 replies) |
| considering Carmichael/Natomas/Land Park/Elk Grove etc. apartments (10 replies) |
| Housing Bubble 2020 Sacramento (122 replies) |
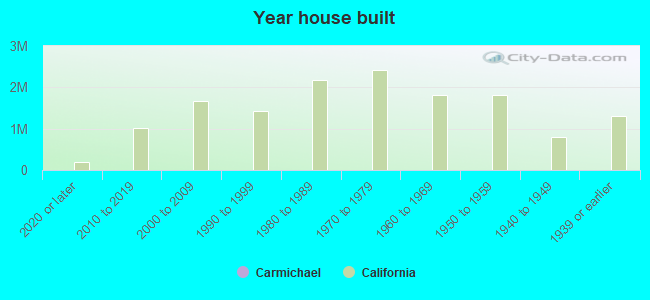
Median year apartment built: 1974
Household type by relationship:
Households: 82,145- Male householders: 17,298 (4,784 living alone), Female householders: 16,749 (4,572 living alone)
15,048 spouses (15,048 opposite-sex spouses), 1,524 unmarried partners, (1,178 opposite-sex unmarried partners), 21,095 children (19,886 natural, 418 adopted, 791 stepchildren), 1,374 grandchildren, 1,011 brothers or sisters, 1,250 parents, 50 foster children, 579 other relatives, 4,305 non-relatives
- In group quarters: 1,862
Size of family households: 10,506 2-persons, 5,930 3-persons, 2,835 4-persons, 1,322 5-persons, 540 6-persons, 45 7-or-more-persons.
Size of nonfamily households: 9,356 1-person, 3,261 2-persons, 206 3-persons, 46 4-persons.
9,577 married couples with children.
3,630 single-parent households (810 men, 2,820 women).
77.4% of residents of Carmichael speak English at home.
6.1% of residents speak Spanish at home (76% speak English very well, 13% speak English well, 8% speak English not well, 4% don't speak English at all).
10.4% of residents speak other Indo-European language at home (49% speak English very well, 24% speak English well, 20% speak English not well, 6% don't speak English at all).
3.8% of residents speak Asian or Pacific Island language at home (56% speak English very well, 21% speak English well, 21% speak English not well, 2% don't speak English at all).
1.7% of residents speak other language at home (59% speak English very well, 23% speak English well, 16% speak English not well, 2% don't speak English at all).
Foreign born population: 14,178 (17.3%)
(58.0% of them are naturalized citizens)
| Here: | 6.5 |
| State: | 6.0 |
| Here: | 3.8 |
| State: | 3.9 |
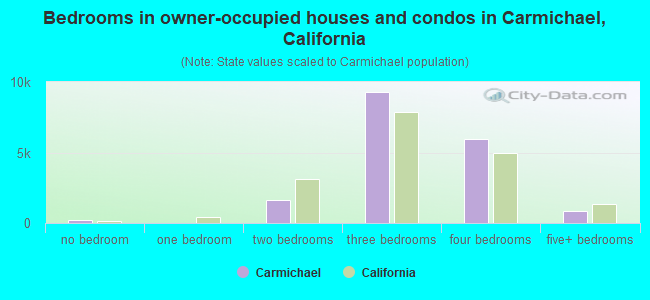
- Bedrooms in owner-occupied houses and condos in Carmichael, California
- 211no bedroom
- 01 bedroom
- 1,6112 bedrooms
- 9,3153 bedrooms
- 5,9544 bedrooms
- 8215+ bedrooms
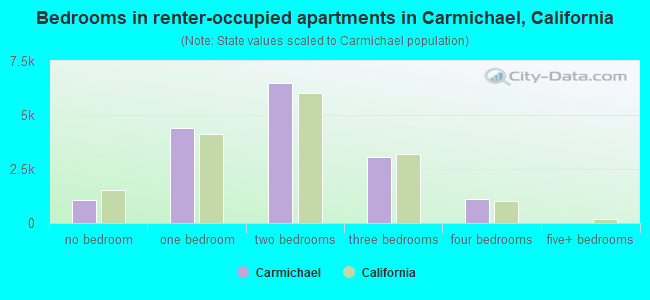
- Bedrooms in renter-occupied apartments in Carmichael, California
- 1,086no bedroom
- 4,3891 bedroom
- 6,4992 bedrooms
- 3,0713 bedrooms
- 1,0904 bedrooms
- 05+ bedrooms
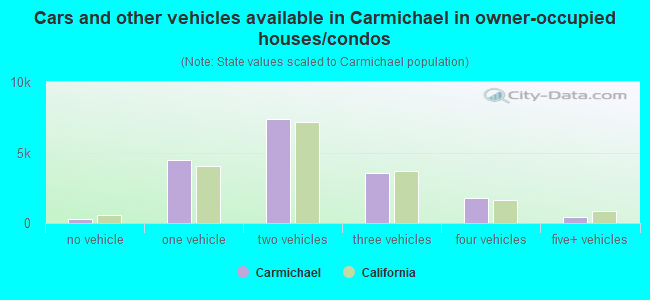
- Cars and other vehicles available in Carmichael in owner-occupied houses/condos
- 271no vehicle
- 4,4991 vehicle
- 7,3742 vehicles
- 3,5413 vehicles
- 1,7974 vehicles
- 4305+ vehicles
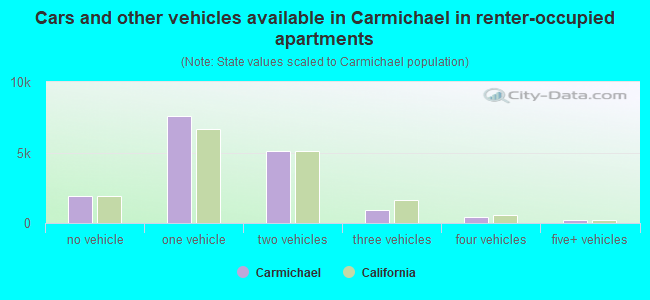
- Cars and other vehicles available in Carmichael in renter-occupied apartments
- 1,902no vehicle
- 7,5681 vehicle
- 5,1142 vehicles
- 9103 vehicles
- 4304 vehicles
- 2115+ vehicles
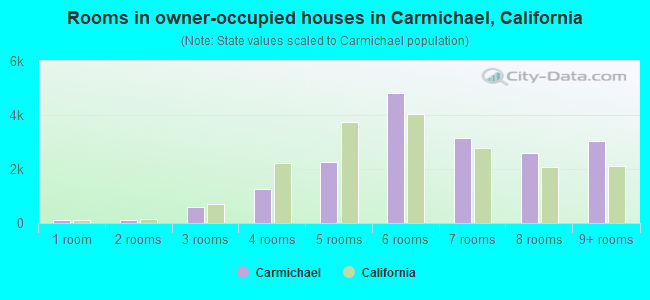
- Rooms in owner-occupied houses in Carmichael, California
- 1031 room
- 1082 rooms
- 5883 rooms
- 1,2574 rooms
- 2,2525 rooms
- 4,8226 rooms
- 3,1497 rooms
- 2,6008 rooms
- 3,0339+ rooms
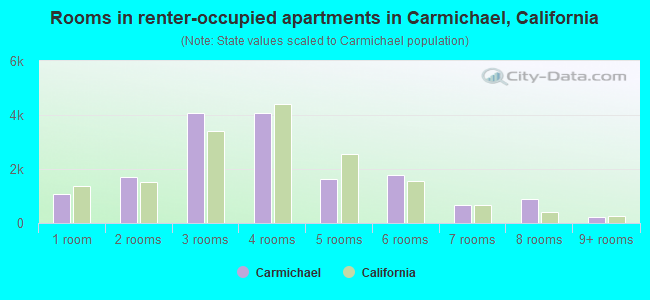
- Rooms in renter-occupied apartments in Carmichael, California
- 1,0861 room
- 1,7112 rooms
- 4,0663 rooms
- 4,0734 rooms
- 1,6395 rooms
- 1,7846 rooms
- 6827 rooms
- 8878 rooms
- 2079+ rooms
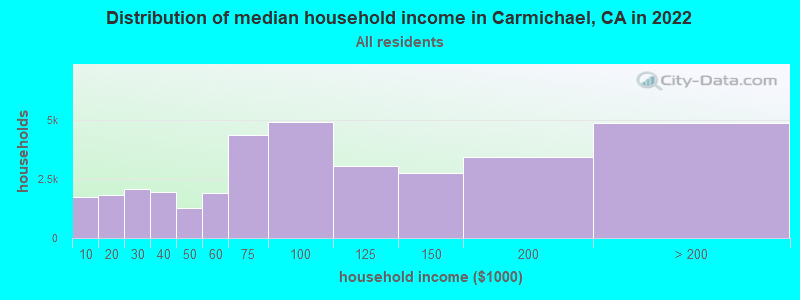
Carmichael, CA household income distribution

- 1,742Less than $10,000
- 1,829$10,000 to $19,999
- 2,077$20,000 to $29,999
- 1,931$30,000 to $39,999
- 1,263$40,000 to $49,999
- 1,894$50,000 to $59,999
- 4,362$60,000 to $74,999
- 4,897$75,000 to $99,999
- 3,032$100,000 to $124,999
- 2,730$125,000 to $149,999
- 3,421$150,000 to $199,999
- 4,869$200,000 or more
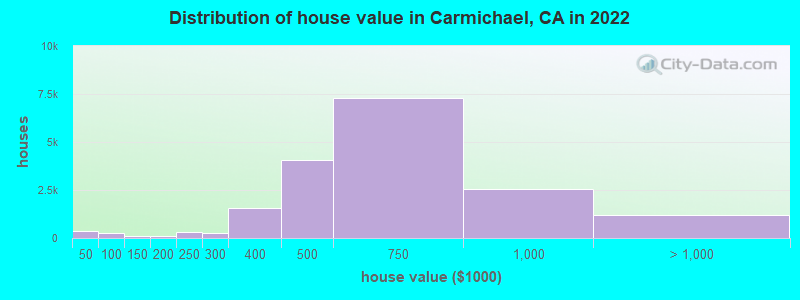
Home value of owner - occupied houses in 2022 in Carmichael, CA
-
- 92Less than $10,000
- 39$10,000 to $14,999
- 7$15,000 to $19,999
- 22$25,000 to $29,999
- 26$30,000 to $34,999
- 46$35,000 to $39,999
- 150$40,000 to $49,999
- 16$50,000 to $59,999
- 50$60,000 to $69,999
- 20$80,000 to $89,999
- 20$90,000 to $99,999
- 95$100,000 to $124,999
- 29$125,000 to $149,999
- 68$150,000 to $174,999
- 58$175,000 to $199,999
- 306$200,000 to $249,999
- 251$250,000 to $299,999
- 1,553$300,000 to $399,999
- 4,048$400,000 to $499,999
- 7,267$500,000 to $749,999
- 2,545$750,000 to $999,999
- 900$1,000,000 to $1,499,999
- 200$1,500,000 to $1,999,999
- 107$2,000,000 or more
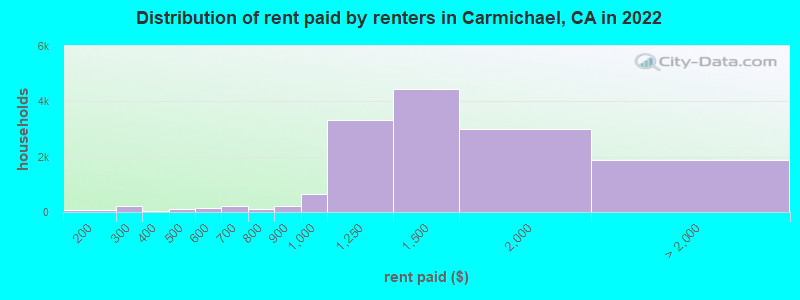
Rent paid by renters in 2022 in Carmichael, CA
-
- 43$100 to $149
- 19$150 to $199
- 146$200 to $249
- 67$250 to $299
- 51$300 to $349
- 80$400 to $449
- 45$450 to $499
- 92$500 to $549
- 40$550 to $599
- 202$600 to $649
- 55$700 to $749
- 47$750 to $799
- 233$800 to $899
- 654$900 to $999
- 3,311$1,000 to $1,249
- 4,429$1,250 to $1,499
- 3,003$1,500 to $1,999
- 823$2,000 to $2,499
- 503$2,500 to $2,999
- 59$3,000 to $3,499
- 193$3,500 or more
- 298No cash rent
Percentage of workers working in this county: 79.0%
Number of people working at home: 8,393 (22.8% of all workers)
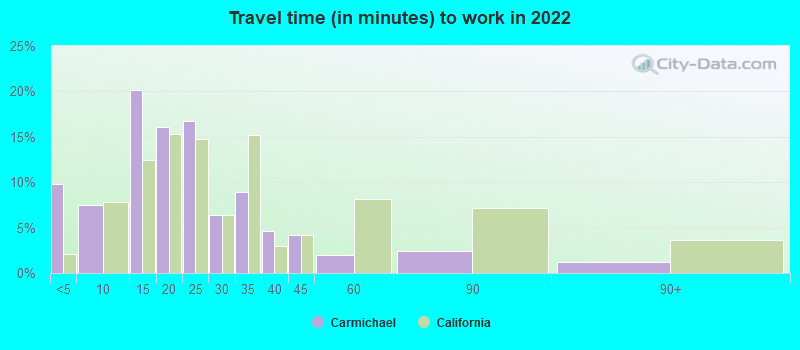
Travel time to work (commute)
- Less than 5 minutes: 1,863
- 5 to 9 minutes: 3,669
- 10 to 14 minutes: 3,621
- 15 to 19 minutes: 4,665
- 20 to 24 minutes: 5,710
- 25 to 29 minutes: 2,840
- 30 to 34 minutes: 5,428
- 35 to 39 minutes: 318
- 40 to 44 minutes: 800
- 45 to 59 minutes: 693
- 60 to 89 minutes: 2,361
- 90 or more minutes: 1,362
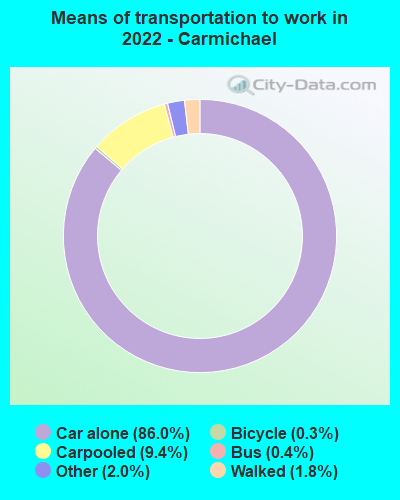
Means of transportation to work:
- Drove a car alone: 12,022 (56.7%)
- Carpooled: 1,353 (6.4%)
- Bus: 30 (0.1%)
- Taxi: 350 (1.7%)
- Bicycle: 35 (0.2%)
- Walked: 278 (1.3%)
- Worked at home: 8,393 (39.6%)
- Unemployment by race in 2022
- Unemployment rate for White non-Hispanic residents
- 3.3%Males
- 3.3%Females
- Unemployment rate for Black residents
- 6.5%Males
- 16.8%Females
- Unemployment rate for Asian residents
- 8.0%Males
- 2.7%Females
- Unemployment rate for other race residents
- 4.7%Males
- 7.0%Females
- Unemployment rate for two or more race residents
- 5.9%Males
- 2.0%Females
- Unemployment rate for Hispanic or Latino residents
- 6.5%Males
- 4.6%Females
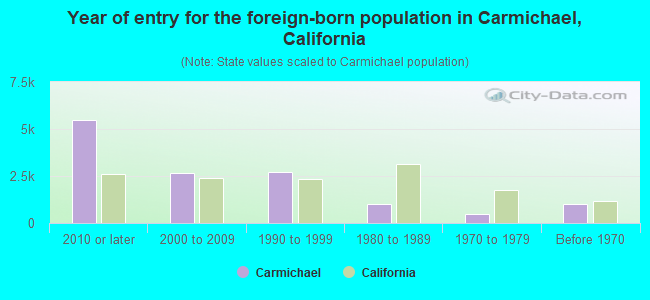
- Year of entry for the foreign-born population in Carmichael, California
- 5,4922010 or later
- 2,6472000 to 2009
- 2,7301990 to 1999
- 9931980 to 1989
- 5041970 to 1979
- 1,028Before 1970
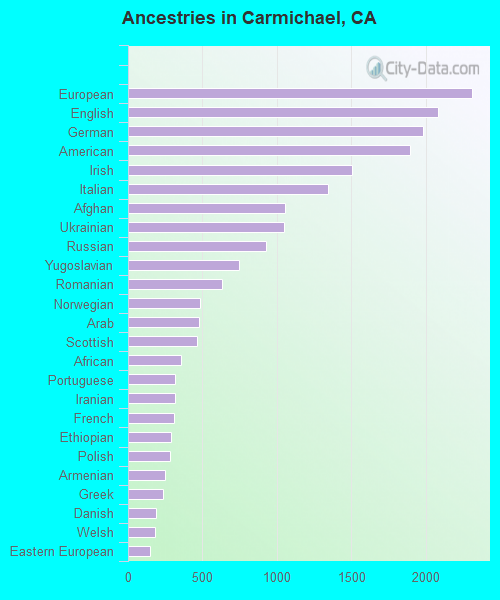
First ancestries reported:
- European: 2,310 (6.0%)
- English: 2,081 (5.4%)
- German: 1,982 (5.2%)
- American: 1,897 (4.9%)
- Irish: 1,505 (3.9%)
- Italian: 1,344 (3.5%)
- Afghan: 1,052 (2.7%)
- Ukrainian: 1,049 (2.7%)
- Russian: 925 (2.4%)
- Yugoslavian: 748 (2.0%)
- Romanian: 631 (1.6%)
- Norwegian: 487 (1.3%)
- Arab: 476 (1.2%)
- Scottish: 466 (1.2%)
- African: 354 (0.9%)
- Portuguese: 316 (0.8%)
- Iranian: 313 (0.8%)
- French: 310 (0.8%)
- Ethiopian: 292 (0.8%)
- Polish: 282 (0.7%)
- Armenian: 250 (0.7%)
- Greek: 237 (0.6%)
- Danish: 187 (0.5%)
- Welsh: 180 (0.5%)
- Eastern European: 151 (0.4%)
- Trinidadian and Tobagonian: 140 (0.4%)
- Slavic: 140 (0.4%)
- Swedish: 132 (0.3%)
- British: 122 (0.3%)
- Hungarian: 102 (0.3%)
- Northern European: 102 (0.3%)
- French Canadian: 89 (0.2%)
- Dutch: 85 (0.2%)
- Liberian: 78 (0.2%)
- Iraqi: 73 (0.2%)
- Nigerian: 72 (0.2%)
- Finnish: 72 (0.2%)
- Scotch-Irish: 68 (0.2%)
- Serbian: 63 (0.2%)
- Syrian: 63 (0.2%)
- Bulgarian: 61 (0.2%)
- Czech: 48 (0.1%)
- Australian: 45 (0.1%)
- Albanian: 42 (0.1%)
- South African: 39 (0.1%)
- Basque: 35 (0.09%)
- Scandinavian: 32 (0.08%)
- Canadian: 25 (0.07%)
- Swiss: 25 (0.07%)
- Croatian: 22 (0.06%)
- Brazilian: 21 (0.05%)
- Lithuanian: 19 (0.05%)
- Jamaican: 18 (0.05%)
- Slovak: 12 (0.03%)
- Jordanian: 11 (0.03%)
- Icelander: 7 (0.02%)
- Austrian: 7 (0.02%)
- Latvian: 6 (0.02%)
- Palestinian: 6 (0.02%)
- Czechoslovakian: 5 (0.01%)
- West Indian: 4 (0.01%)
Most common places of birth for foreign-born residents (%):
| Carmichael: | 14.3% (1,858) |
| California: | 0.5% (53,260) |
| Carmichael: | 10.6% (1,384) |
| California: | 37.2% (3,881,193) |
| Carmichael: | 7.0% (916) |
| California: | 0.7% (71,932) |
| Carmichael: | 6.9% (895) |
| California: | 7.8% (818,297) |
| Carmichael: | 6.8% (884) |
| California: | 0.6% (60,761) |
| Carmichael: | 4.1% (540) |
| California: | 0.4% (40,941) |
| Carmichael: | 3.8% (489) |
| California: | 0.1% (10,171) |
| Carmichael: | 3.1% (400) |
| California: | 0.0% (4,867) |
| Carmichael: | 2.9% (372) |
| California: | 2.0% (206,004) |
| Carmichael: | 2.6% (337) |
| California: | 3.0% (315,248) |
| Carmichael: | 2.5% (331) |
| California: | 4.9% (512,335) |
| Carmichael: | 2.5% (330) |
| California: | 6.6% (684,672) |
| Carmichael: | 2.3% (305) |
| California: | 5.2% (539,184) |
| Carmichael: | 2.2% (282) |
| California: | 0.1% (11,157) |
| Carmichael: | 1.8% (239) |
| California: | 0.2% (24,635) |
| Carmichael: | 1.6% (205) |
| California: | 0.7% (73,304) |
| Carmichael: | 1.5% (199) |
| California: | 1.2% (127,477) |
Place of birth for U.S.-born residents:
- This state: 51,550
- Other state: 14,364
- Northeast: 2,094
- Midwest: 5,286
- South: 3,593
- West: 3,391
88.4% of Carmichael residents lived in the same house 1 years ago.
Out of people who lived in different houses, 38.9% lived in this county.
Out of people who lived in different counties, 88.6% lived in California.
| Carmichael: | 88.4% |
| State average: | 88.9% |
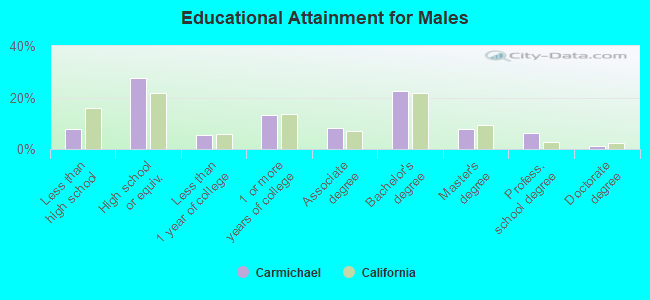
Education attainment for males 25 years and older:
- No schooling: 146
- Nursery to 4th grade: 99
- 5th and 6th grade: 0
- 7th and 8th grade: 133
- 9th grade: 103
- 10th grade: 116
- 11th grade: 603
- 12th grade, no diploma: 1,141
- High school graduate (or equivalency): 8,162
- Less than 1 year of college: 1,555
- Some college more than 1 year, no degree: 3,881
- Associate degree: 2,441
- Bachelor's degree: 6,709
- Master's degree: 2,318
- Professional school degree: 1,806
- Doctorate degree: 345
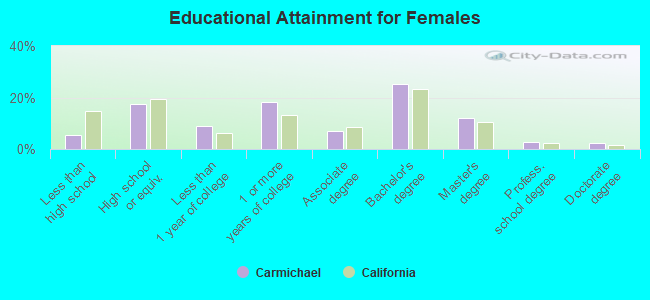
Education attainment for females 25 years and older:
- No schooling: 408
- Nursery to 4th grade: 0
- 5th and 6th grade: 361
- 7th and 8th grade: 44
- 9th grade: 108
- 10th grade: 44
- 11th grade: 271
- 12th grade, no diploma: 515
- High school graduate (or equivalency): 5,491
- Less than 1 year of college: 2,732
- Some college more than 1 year, no degree: 5,735
- Associate degree: 2,225
- Bachelor's degree: 7,920
- Master's degree: 3,722
- Professional school degree: 882
- Doctorate degree: 714
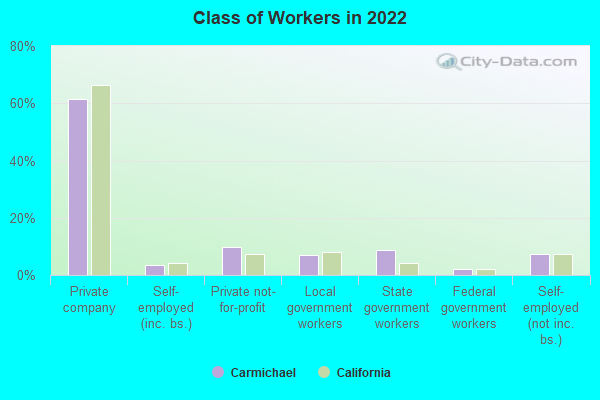
Housing units in structures:
- One, detached: 20,212
- One, attached: 2,119
- Two: 1,121
- 3 or 4: 3,142
- 5 to 9: 1,992
- 10 to 19: 1,341
- 20 to 49: 884
- 50 or more: 4,290
- Mobile homes: 300
Median worth of mobile homes: $56,613
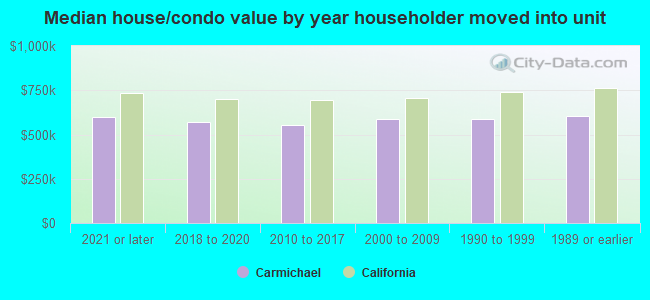
House/condo owner moved in on average 13 years ago
Renter moved in on average 3 years ago
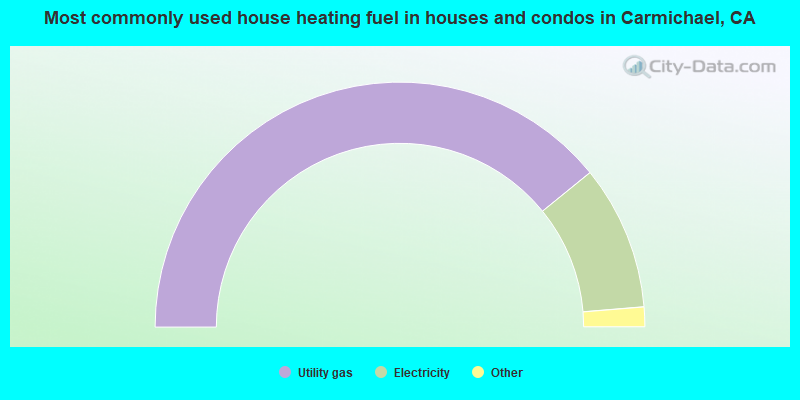
- 78.2%Utility gas
- 19.1%Electricity
- 1.3%Bottled, tank, or LP gas
- 0.5%Solar energy
- 0.3%No fuel used
- 0.2%Wood
- 0.2%Other fuel
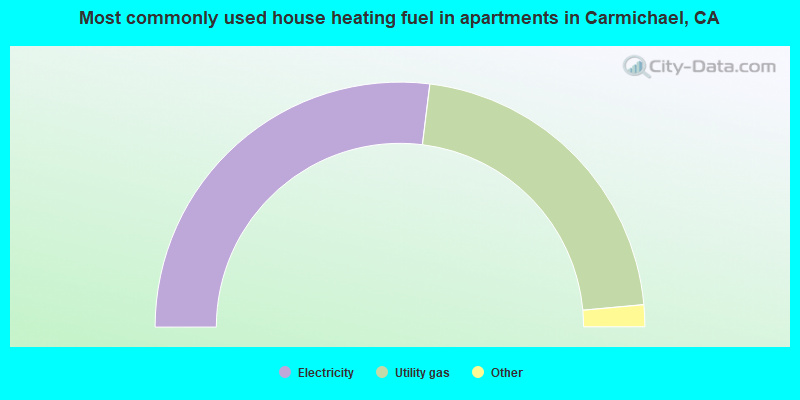
- 53.9%Electricity
- 43.2%Utility gas
- 1.5%Bottled, tank, or LP gas
- 0.8%No fuel used
- 0.2%Wood
- 0.2%Fuel oil, kerosene, etc.
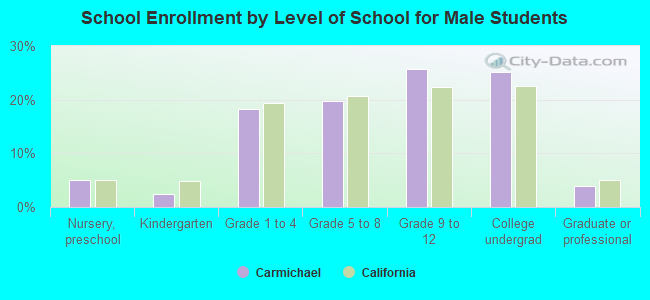
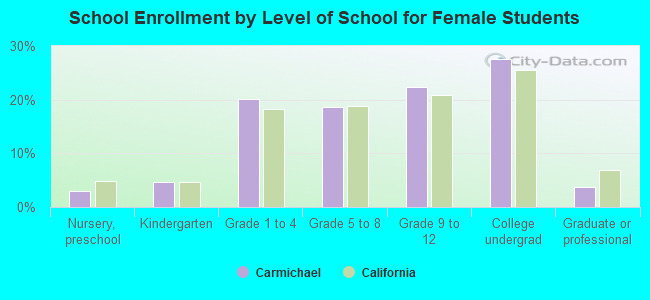
Private vs. public school enrollment:
| Here: | 18.5% |
| California: | 10.5% |
| Here: | 8.1% |
| California: | 8.5% |
| Here: | 10.1% |
| California: | 15.9% |