Carpinteria Valley, CA (California) Houses and Residents
| Carpinteria Valley: | $1,025,549 |
| California: | $715,900 |
Total population: 19,142 (Urban population: 17,899, Rural population: 1,209 (292 farm, 917 nonfarm))
Houses: 7,760 (7,010 occupied: 4,227 owner occupied, 2,783 renter occupied)
| % of renters here: | 40% |
| State: | 44% |
Housing density: 149 houses/condos per square mile
Median price asked for vacant for-sale houses and condos in 2022 in this county: $300,986.
Median contract rent in 2022: over $2,000 (lower quartile is $1,650, upper quartile is over $2,000)
Median rent asked for vacant for-rent units in 2022: $2,247
Median gross rent in Carpinteria Valley, CA in 2022: over $2,000
Housing units in Carpinteria Valley with a mortgage: 1,905 (269 second mortgage, 292 home equity loan, 26 both second mortgage and home equity loan)
Houses without a mortgage: 638


Household type by relationship:
Households: 406,113- In family households: 328,096 (63,927 male householders, 27,673 female householders)
68,834 spouses, 113,869 children (107,701 natural, 2,244 adopted, 3,924 stepchildren), 9,655 grandchildren, 6,308 brothers or sisters, 4,394 parents, foster children, 11,429 other relatives, 17,914 non-relatives
- In nonfamily households: 78,017 (22,866 male householders (14,680 living alone)), 27,638 female householders (20,578 living alone)), 27,513 nonrelatives
- In group quarters: 17,782 (5,917 institutionalized population)
68,080 married couples with children.
18,812 single-parent households (4,951 men, 13,861 women).
67.8% of residents of Carpinteria Valley speak English at home.
28.4% of residents speak Spanish at home (44% speak English very well, 21% speak English well, 20% speak English not well, 16% don't speak English at all).
2.7% of residents speak other Indo-European language at home (88% speak English very well, 10% speak English well, 2% speak English not well).
0.9% of residents speak Asian or Pacific Island language at home (47% speak English very well, 18% speak English well, 35% speak English not well).
0.3% of residents speak other language at home (100% speak English very well).
Foreign born population: 4,608 (21.7%)
(36.7% of them are naturalized citizens)
| Here: | 6.0 |
| State: | 6.0 |
| Here: | 3.9 |
| State: | 3.9 |

- Bedrooms in owner-occupied houses and condos in Carpinteria Valley, California
- 80no bedroom
- 3041 bedroom
- 1,2812 bedrooms
- 1,6233 bedrooms
- 8064 bedrooms
- 1335+ bedrooms

- Bedrooms in renter-occupied apartments in Carpinteria Valley, California
- 237no bedroom
- 9411 bedroom
- 1,0542 bedrooms
- 4313 bedrooms
- 1204 bedrooms
- 05+ bedrooms

- Cars and other vehicles available in Carpinteria Valley in owner-occupied houses/condos
- 72no vehicle
- 1,2181 vehicle
- 1,8002 vehicles
- 7903 vehicles
- 1774 vehicles
- 1705+ vehicles

- Cars and other vehicles available in Carpinteria Valley in renter-occupied apartments
- 290no vehicle
- 1,2001 vehicle
- 1,0022 vehicles
- 2413 vehicles
- 444 vehicles
- 65+ vehicles

- Rooms in owner-occupied houses in Carpinteria Valley, California
- 721 room
- 1402 rooms
- 2803 rooms
- 5834 rooms
- 1,0475 rooms
- 1,0596 rooms
- 6047 rooms
- 2428 rooms
- 2009+ rooms

- Rooms in renter-occupied apartments in Carpinteria Valley, California
- 2211 room
- 4912 rooms
- 5753 rooms
- 6784 rooms
- 5035 rooms
- 1586 rooms
- 987 rooms
- 428 rooms
- 179+ rooms


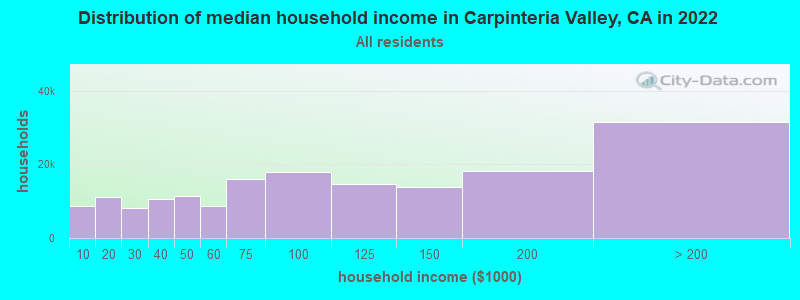
Carpinteria Valley, CA household income distribution

- 8,587Less than $10,000
- 11,186$10,000 to $19,999
- 8,148$20,000 to $29,999
- 10,646$30,000 to $39,999
- 11,534$40,000 to $49,999
- 8,799$50,000 to $59,999
- 16,083$60,000 to $74,999
- 17,852$75,000 to $99,999
- 14,788$100,000 to $124,999
- 13,757$125,000 to $149,999
- 18,326$150,000 to $199,999
- 31,521$200,000 or more
Percentage of workers working in this county: 89.4%
Number of people working at home: 1,496 (13.4% of all workers)
Travel time to work (commute)
- Less than 5 minutes: 493
- 5 to 9 minutes: 1,618
- 10 to 14 minutes: 1,147
- 15 to 19 minutes: 1,330
- 20 to 24 minutes: 1,677
- 25 to 29 minutes: 449
- 30 to 34 minutes: 1,535
- 35 to 39 minutes: 148
- 40 to 44 minutes: 90
- 45 to 59 minutes: 267
- 60 to 89 minutes: 270
- 90 or more minutes: 170
Means of transportation to work:
- Drove a car alone: 6,656 (68.5%)
- Carpooled: 1,656 (17.0%)
- Bus or trolley bus: 241 (2.5%)
- Streetcar or trolley car: 7 (0.1%)
- Subway or elevated: 9 (0.1%)
- Motorcycle: 27 (0.3%)
- Bicycle: 163 (1.7%)
- Walked: 343 (3.5%)
- Other means: 92 (0.9%)
- Worked at home: 520 (5.4%)


- Year of entry for the foreign-born population in Carpinteria Valley, California
- 7711995 to March 2000
- 9611990 to 1994
- 6341985 to 1989
- 4981980 to 1984
- 3511975 to 1979
- 3311970 to 1974
- 1851965 to 1969
- 447Before 1965
Most common places of birth for foreign-born residents (%):
| Carpinteria Valley: | 74.5% (3,112) |
| California: | 44.3% (3,928,701) |
| Carpinteria Valley: | 4.2% (175) |
| California: | 1.5% (133,090) |
| Carpinteria Valley: | 3.4% (144) |
| California: | 1.6% (141,181) |
| Carpinteria Valley: | 1.8% (76) |
| California: | 3.0% (268,452) |
| Carpinteria Valley: | 1.6% (66) |
| California: | 1.1% (98,160) |
Place of birth for U.S.-born residents:
- This state: 10,022
- Other state: 4,667
- Northeast: 1,089
- Midwest: 1,817
- South: 925
- West: 836
54% of Carpinteria Valley residents lived in the same house 5 years ago.
Out of people who lived in different houses, 72% lived in this county.
Out of people who lived in different counties, 66% lived in California.
Education attainment for males 25 years and older:
- No schooling: 121
- Nursery to 4th grade: 106
- 5th and 6th grade: 259
- 7th and 8th grade: 167
- 9th grade: 131
- 10th grade: 62
- 11th grade: 102
- 12th grade, no diploma: 217
- High school graduate (or equivalency): 1,060
- Less than 1 year of college: 367
- Some college more than 1 year, no degree: 1,110
- Associate degree: 416
- Bachelor's degree: 1,347
- Master's degree: 449
- Professional school degree: 207
- Doctorate degree: 117

Education attainment for females 25 years and older:
- No schooling: 155
- Nursery to 4th grade: 94
- 5th and 6th grade: 296
- 7th and 8th grade: 163
- 9th grade: 80
- 10th grade: 156
- 11th grade: 119
- 12th grade, no diploma: 253
- High school graduate (or equivalency): 1,192
- Less than 1 year of college: 358
- Some college more than 1 year, no degree: 1,187
- Associate degree: 594
- Bachelor's degree: 1,520
- Master's degree: 536
- Professional school degree: 98
- Doctorate degree: 59


Housing units in structures:
- One, detached: 3,780
- One, attached: 525
- Two: 282
- 3 or 4: 445
- 5 to 9: 546
- 10 to 19: 444
- 20 to 49: 367
- 50 or more: 305
- Mobile homes: 1,032
- Boats, RVs, vans, etc.: 34
Median worth of mobile homes: $313,494
Housing units lacking complete kitchen facilities: 0.7%

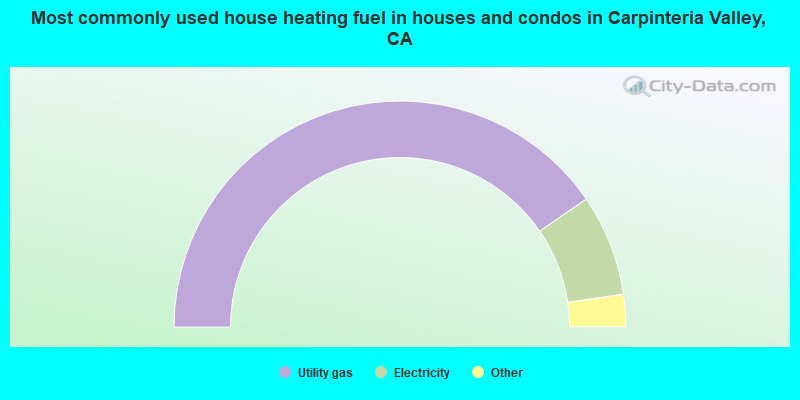
- 80.8%Utility gas
- 14.5%Electricity
- 2.9%Bottled, tank, or LP gas
- 1.4%Wood
- 0.2%Fuel oil, kerosene, etc.
- 0.2%No fuel used
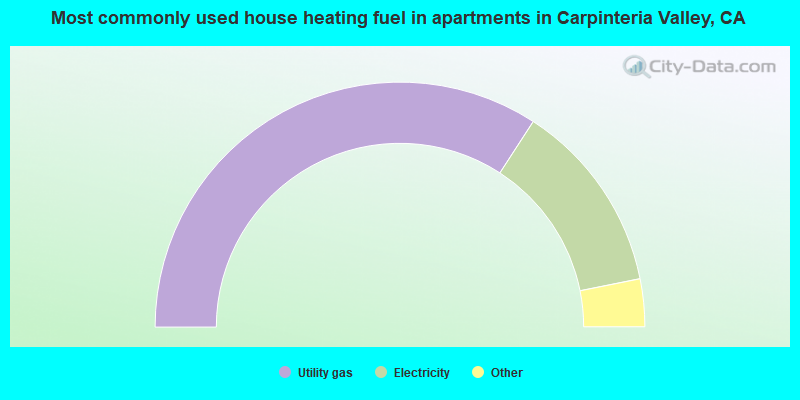
- 68.4%Utility gas
- 25.4%Electricity
- 3.1%Bottled, tank, or LP gas
- 2.8%No fuel used
- 0.4%Solar energy
Private vs. public school enrollment:
| Here: | 8.0% |
| California: | 9.9% |
| Here: | 8.6% |
| California: | 7.8% |
| Here: | 6.6% |
| California: | 15.4% |


