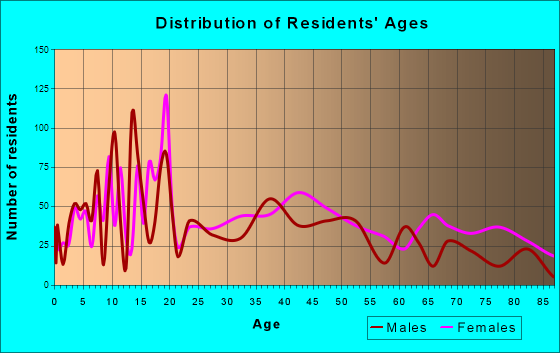
Carthage, TX (Texas) Houses and Residents
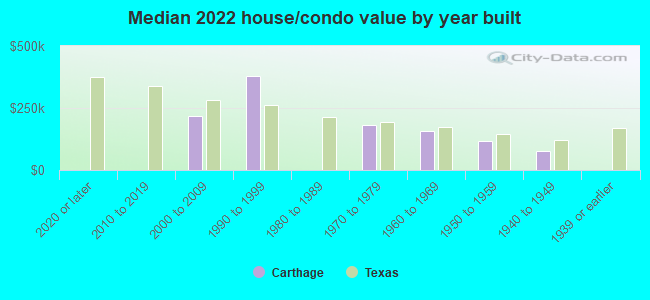
| Carthage: | $169,174 |
| Texas: | $275,400 |
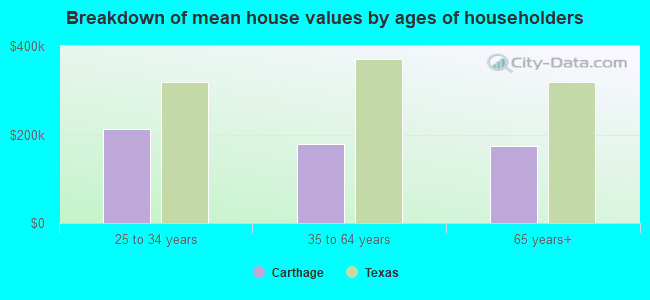
Mean price in 2022:
Detached houses: $214,610
Here: $214,610 State: $369,058 Mobile homes: $54,894
Here: $54,894 State: $124,413
Total population: 6,822 (Urban population: 5,740 (all inside urban clusters), Rural population: 974 (all nonfarm))
Houses: 3,370 (2,614 occupied: 1,779 owner occupied, 874 renter occupied)
| % of renters here: | 33% |
| State: | 38% |
Housing density: 320 houses/condos per square mile
Median price asked for vacant for-sale houses and condos in 2022: $170,340.
Median contract rent in 2022: $631 (lower quartile is $520, upper quartile is $764)
Median rent asked for vacant for-rent units in 2022: $691
Median gross rent in Carthage, TX in 2022: $701
Housing units in Carthage with a mortgage: 769 (0 second mortgage, 0 home equity loan, 0 both second mortgage and home equity loan)
Houses without a mortgage: 0
Median household income for houses/condos with a mortgage: $151,220
Median household income for apartments without a mortgage: $34,017
Median monthly housing costs: $694
Compare current foreclosures near Carthage, TX:
| Photo | Address | Area | Beds / Baths | Price | Details |
|---|---|---|---|---|---|

|
#1
Beverly Dr
Carthage, TX 75633
|
1,497 sq. feet
|
2 baths 3 beds |
$224,900
|
show details |

|
#2
W Sabine St
Carthage, TX 75633
|
- sq. feet
|
2 baths 3 beds |
show details | |

|
#3
County Road 279
Carthage, TX 75633
|
- sq. feet
|
- baths - beds |
show details | |

|
#4
County Road 106
Carthage, TX 75633
|
- sq. feet
|
- baths - beds |
show details | |

|
#5
Fm 31 S
Carthage, TX 75633
|
- sq. feet
|
- baths - beds |
show details | |

|
#6
Fm 959
Carthage, TX 75633
|
- sq. feet
|
- baths - beds |
show details | |

|
#7
County Road 184
Carthage, TX 75633
|
- sq. feet
|
- baths - beds |
show details | |

|
#8
W Sabine St
Carthage, TX 75633
|
- sq. feet
|
- baths - beds |
show details | |

|
#9
County Road 2091
Carthage, TX 75633
|
- sq. feet
|
- baths - beds |
show details | |

|
#10
County Road 208
Carthage, TX 75633
|
- sq. feet
|
- baths - beds |
show details |
| Photo | Address | Area | Beds / Baths | Price | Details |
|---|---|---|---|---|---|

|
#11
County Road 458
Carthage, TX 75633
|
- sq. feet
|
- baths - beds |
show details | |

|
#12
W Phiffer St
Carthage, TX 75633
|
- sq. feet
|
- baths - beds |
show details | |

|
#13
Fm 959
Carthage, TX 75633
|
- sq. feet
|
- baths - beds |
show details | |

|
#14
County Road 491
Carthage, TX 75633
|
- sq. feet
|
- baths - beds |
show details | |

|
#15
County Road 302
Carthage, TX 75633
|
- sq. feet
|
- baths - beds |
show details | |

|
#16
County Road 164
Long Branch, TX 75669
|
1,339 sq. feet
|
2 baths 3 beds |
show details | |

|
#17
Fm 1971
Long Branch, TX 75669
|
- sq. feet
|
- baths - beds |
show details | |

|
#18
Melinda Ln
Tatum, TX 75691
|
- sq. feet
|
- baths - beds |
show details | |

|
#19
Melinda Ln
Tatum, TX 75691
|
2,088 sq. feet
|
- baths - beds |
show details | |

|
#20
Motley St
Tenaha, TX 75974
|
1,768 sq. feet
|
- baths - beds |
show details |
| Photo | Address | Area | Beds / Baths | Price | Details |
|---|---|---|---|---|---|

|
#21
Tennessee Rd
Tenaha, TX 75974
|
- sq. feet
|
- baths - beds |
show details | |

|
#22
Private Road 7231
De Berry, TX 75639
|
- sq. feet
|
- baths - beds |
show details | |

|
#23
Private Road 529
Gary, TX 75643
|
- sq. feet
|
- baths - beds |
show details | |

|
#24
County Road 3113
De Berry, TX 75639
|
- sq. feet
|
- baths - beds |
show details | |

|
#25
Fm 1186
De Berry, TX 75639
|
- sq. feet
|
- baths - beds |
show details | |

|
#26
Honeysuckle St
Beckville, TX 75631
|
- sq. feet
|
- baths - beds |
show details | |

|
#27
Fm 1794 W
Beckville, TX 75631
|
- sq. feet
|
- baths - beds |
show details | |

|
#28
County Road 4657
Timpson, TX 75975
|
984 sq. feet
|
- baths - beds |
show details | |

|
#29
County Road 158
Long Branch, TX 75669
|
- sq. feet
|
- baths - beds |
show details | |

|
#30
County Road 127
Gary, TX 75643
|
- sq. feet
|
- baths - beds |
show details |
| Photo | Address | Area | Beds / Baths | Price | Details |
|---|---|---|---|---|---|

|
#31
Honeysuckle Ln
Beckville, TX 75631
|
- sq. feet
|
- baths - beds |
show details | |

|
Check over 1 million property listings on Foreclosure.com!
|
browse all offers | |||

Latest news about housing in Carthage, TX collected exclusively by city-data.com from local newspapers, TV, and radio stations


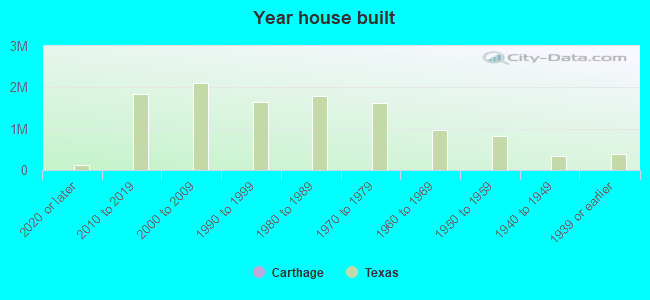
Median year apartment built: 1985
Household type by relationship:
Households: 6,725- Male householders: 966 (439 living alone), Female householders: 1,612 (473 living alone)
1,132 spouses (1,132 opposite-sex spouses), 214 unmarried partners, (203 opposite-sex unmarried partners), 1,809 children (1,708 natural, 41 adopted, 59 stepchildren), 51 grandchildren, 0 brothers or sisters, 140 parents, 34 foster children, 279 other relatives, 51 non-relatives
- In group quarters: 432
Size of family households: 648 2-persons, 315 3-persons, 303 4-persons, 145 5-persons, 173 6-persons.
Size of nonfamily households: 961 1-person, 109 2-persons.
818 married couples with children.
624 single-parent households (0 men, 624 women).
82.2% of residents of Carthage speak English at home.
13.2% of residents speak Spanish at home (70% speak English very well, 8% speak English well, 23% don't speak English at all).
1.5% of residents speak other Indo-European language at home (100% speak English very well).
3.2% of residents speak Asian or Pacific Island language at home (84% speak English very well, 16% speak English well).
0.1% of residents speak other language at home (100% speak English very well).
Foreign born population: 500 (7.4%)
(27.0% of them are naturalized citizens)
| Here: | 6.1 |
| State: | 6.3 |
| Here: | 4.3 |
| State: | 4.0 |
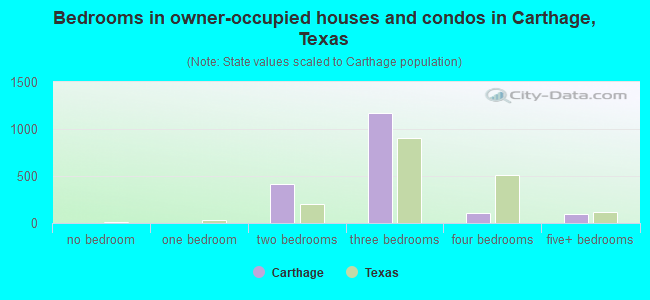
- Bedrooms in owner-occupied houses and condos in Carthage, Texas
- 0no bedroom
- 01 bedroom
- 4142 bedrooms
- 1,1653 bedrooms
- 1034 bedrooms
- 985+ bedrooms
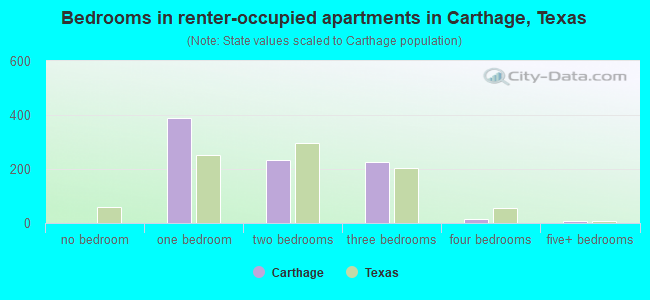
- Bedrooms in renter-occupied apartments in Carthage, Texas
- 0no bedroom
- 3881 bedroom
- 2352 bedrooms
- 2273 bedrooms
- 164 bedrooms
- 85+ bedrooms
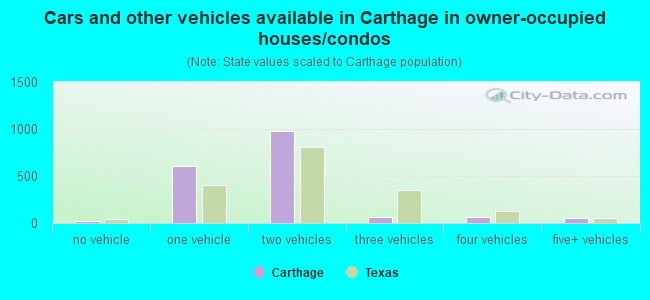
- Cars and other vehicles available in Carthage in owner-occupied houses/condos
- 18no vehicle
- 6041 vehicle
- 9792 vehicles
- 603 vehicles
- 634 vehicles
- 565+ vehicles
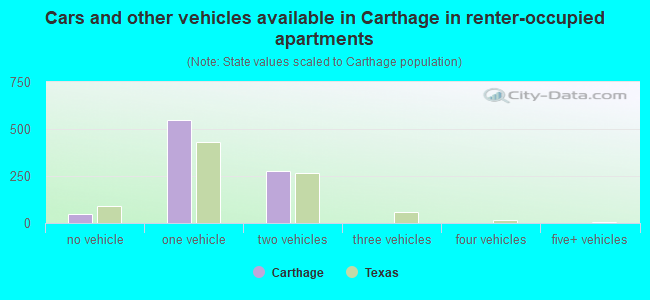
- Cars and other vehicles available in Carthage in renter-occupied apartments
- 50no vehicle
- 5471 vehicle
- 2772 vehicles
- 03 vehicles
- 04 vehicles
- 05+ vehicles
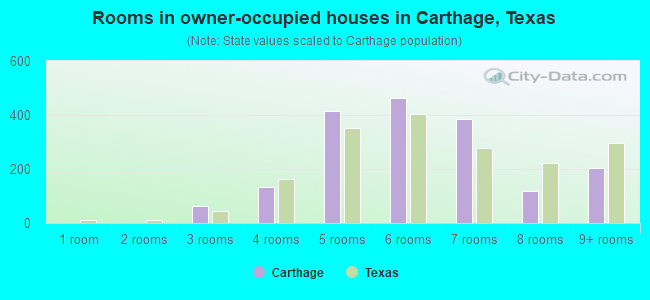
- Rooms in owner-occupied houses in Carthage, Texas
- 01 room
- 02 rooms
- 643 rooms
- 1344 rooms
- 4135 rooms
- 4636 rooms
- 3847 rooms
- 1188 rooms
- 2039+ rooms
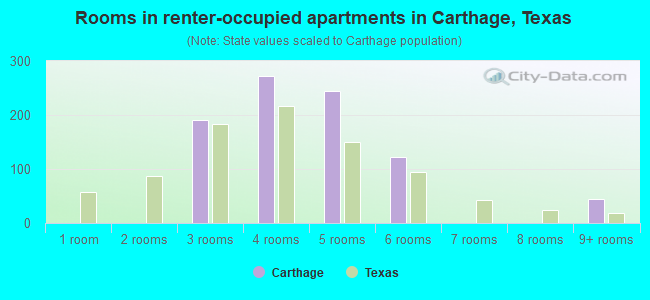
- Rooms in renter-occupied apartments in Carthage, Texas
- 01 room
- 02 rooms
- 1913 rooms
- 2724 rooms
- 2445 rooms
- 1236 rooms
- 07 rooms
- 08 rooms
- 449+ rooms
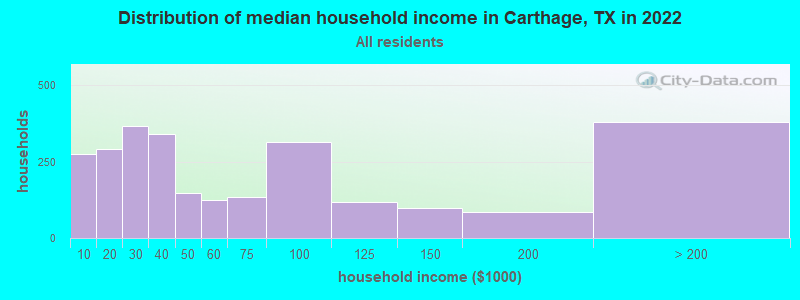
Carthage, TX household income distribution

- 274Less than $10,000
- 290$10,000 to $19,999
- 366$20,000 to $29,999
- 342$30,000 to $39,999
- 146$40,000 to $49,999
- 123$50,000 to $59,999
- 134$60,000 to $74,999
- 316$75,000 to $99,999
- 118$100,000 to $124,999
- 99$125,000 to $149,999
- 85$150,000 to $199,999
- 380$200,000 or more
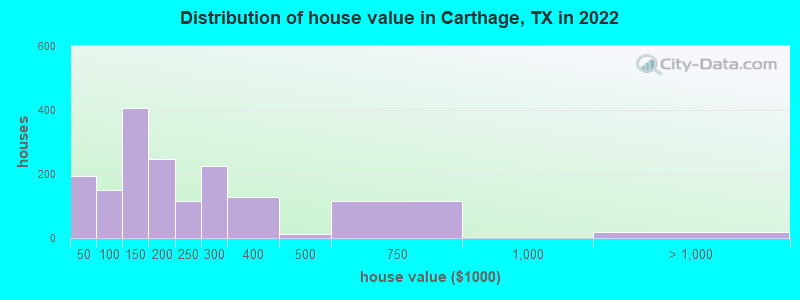
Home value of owner - occupied houses in 2022 in Carthage, TX
-
- 88$15,000 to $19,999
- 81$25,000 to $29,999
- 9$30,000 to $34,999
- 14$40,000 to $49,999
- 27$50,000 to $59,999
- 52$60,000 to $69,999
- 5$80,000 to $89,999
- 49$90,000 to $99,999
- 308$100,000 to $124,999
- 99$125,000 to $149,999
- 42$150,000 to $174,999
- 204$175,000 to $199,999
- 115$200,000 to $249,999
- 226$250,000 to $299,999
- 127$300,000 to $399,999
- 11$400,000 to $499,999
- 116$500,000 to $749,999
- 19$1,000,000 to $1,499,999
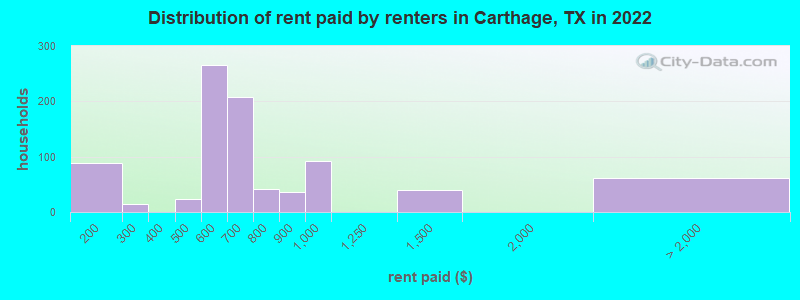
Rent paid by renters in 2022 in Carthage, TX
-
- 66$100 to $149
- 21$150 to $199
- 13$250 to $299
- 23$450 to $499
- 254$500 to $549
- 9$550 to $599
- 87$600 to $649
- 121$650 to $699
- 33$700 to $749
- 7$750 to $799
- 35$800 to $899
- 93$900 to $999
- 40$1,250 to $1,499
- 61No cash rent
Percentage of workers working in this county: 79.1%
Number of people working at home: 126 (4.5% of all workers)
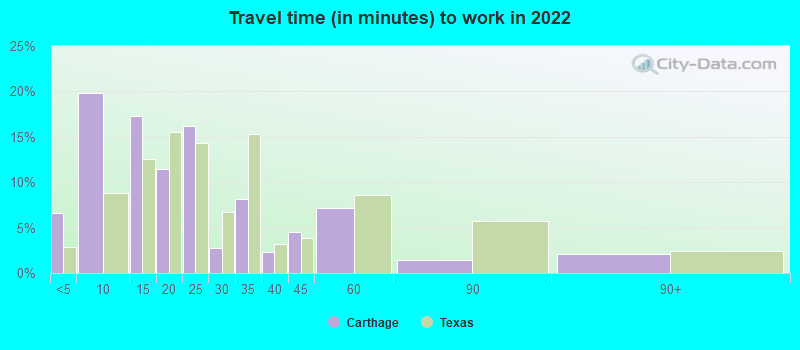
Travel time to work (commute)
- Less than 5 minutes: 261
- 5 to 9 minutes: 1,026
- 10 to 14 minutes: 426
- 15 to 19 minutes: 192
- 20 to 24 minutes: 38
- 25 to 29 minutes: 0
- 30 to 34 minutes: 204
- 35 to 39 minutes: 0
- 40 to 44 minutes: 69
- 45 to 59 minutes: 97
- 60 to 89 minutes: 156
- 90 or more minutes: 127
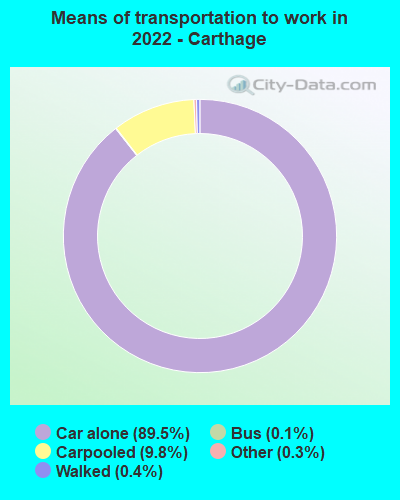
Means of transportation to work:
- Drove a car alone: 5,356 (83.6%)
- Carpooled: 635 (9.9%)
- Bus: 7 (0.1%)
- Taxi: 19 (0.3%)
- Walked: 23 (0.4%)
- Worked at home: 126 (2.0%)
- Unemployment by race in 2022
- Unemployment rate for White non-Hispanic residents
- 1.0%Males
- Unemployment rate for two or more race residents
- 3.3%Females
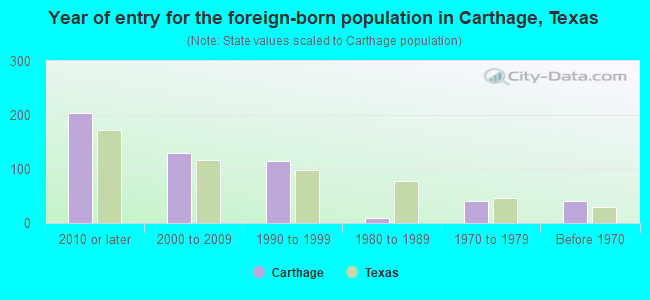
- Year of entry for the foreign-born population in Carthage, Texas
- 2042010 or later
- 1302000 to 2009
- 1141990 to 1999
- 101980 to 1989
- 401970 to 1979
- 41Before 1970
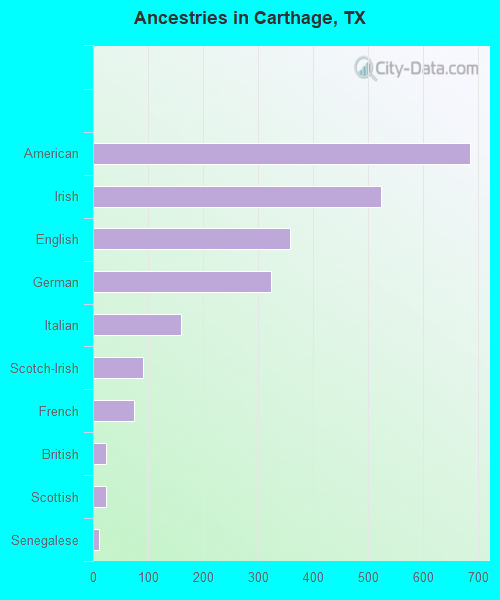
First ancestries reported:
- American: 685 (15.9%)
- Irish: 523 (12.1%)
- English: 358 (8.3%)
- German: 324 (7.5%)
- Italian: 159 (3.7%)
- Scotch-Irish: 91 (2.1%)
- French: 74 (1.7%)
- British: 23 (0.5%)
- Scottish: 23 (0.5%)
- Senegalese: 10 (0.2%)
- Brazilian: 6 (0.1%)
- European: 6 (0.1%)
- Nigerian: 5 (0.1%)
- Dutch: 2 (0.05%)
- African: 2 (0.05%)
Most common places of birth for foreign-born residents (%):
| Carthage: | 80.6% (403) |
| Texas: | 48.4% (2,411,723) |
| Carthage: | 6.8% (34) |
| Texas: | 2.1% (103,148) |
| Carthage: | 2.8% (14) |
| Texas: | 3.7% (184,770) |
| Carthage: | 2.2% (11) |
| Texas: | 3.0% (147,182) |
Place of birth for U.S.-born residents:
- This state: 4,079
- Other state: 2,149
- Northeast: 2
- Midwest: 149
- South: 1,620
- West: 365
85.8% of Carthage residents lived in the same house 1 years ago.
Out of people who lived in different houses, 34.8% lived in this county.
Out of people who lived in different counties, 75.6% lived in Texas.
| Carthage: | 85.8% |
| State average: | 85.7% |
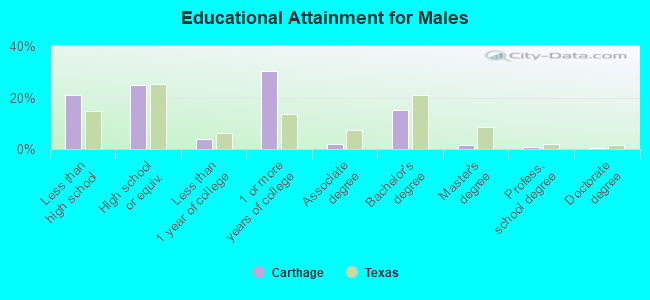
Education attainment for males 25 years and older:
- No schooling: 81
- Nursery to 4th grade: 0
- 5th and 6th grade: 25
- 7th and 8th grade: 1
- 9th grade: 50
- 10th grade: 60
- 11th grade: 150
- 12th grade, no diploma: 39
- High school graduate (or equivalency): 479
- Less than 1 year of college: 73
- Some college more than 1 year, no degree: 583
- Associate degree: 39
- Bachelor's degree: 296
- Master's degree: 31
- Professional school degree: 14
- Doctorate degree: 10
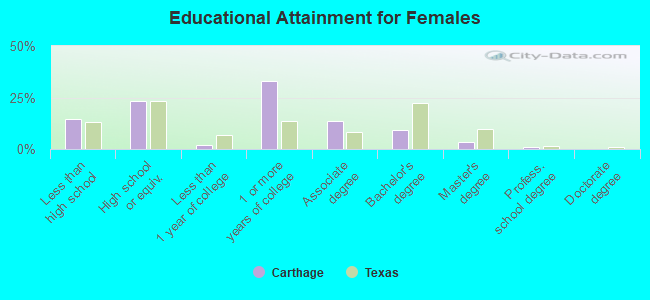
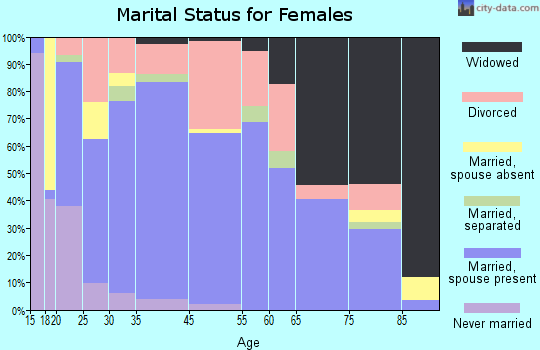
Education attainment for females 25 years and older:
- No schooling: 90
- Nursery to 4th grade: 26
- 5th and 6th grade: 24
- 7th and 8th grade: 56
- 9th grade: 46
- 10th grade: 2
- 11th grade: 85
- 12th grade, no diploma: 0
- High school graduate (or equivalency): 523
- Less than 1 year of college: 44
- Some college more than 1 year, no degree: 730
- Associate degree: 301
- Bachelor's degree: 203
- Master's degree: 76
- Professional school degree: 18
- Doctorate degree: 0
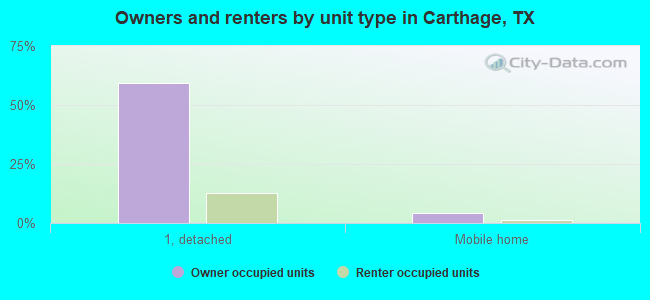
Housing units in structures:
- One, detached: 2,293
- One, attached: 30
- Two: 147
- 3 or 4: 305
- 5 to 9: 34
- 10 to 19: 117
- 20 to 49: 71
- 50 or more: 26
- Mobile homes: 343
Median worth of mobile homes: $209,236
Housing units lacking complete kitchen facilities in 2022: 0.9%
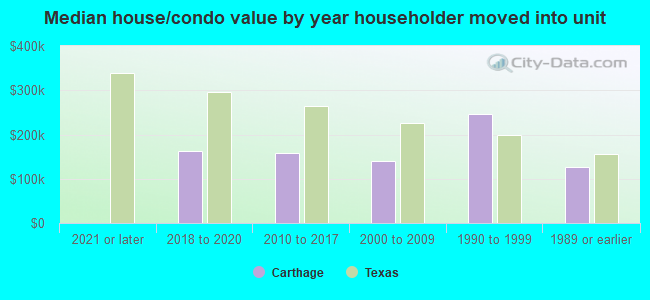
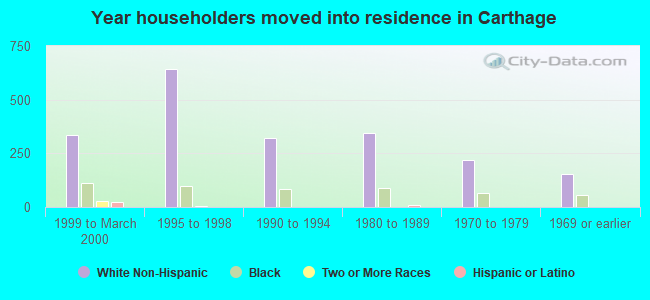
House/condo owner moved in on average 12 years ago
Renter moved in on average 1 years ago
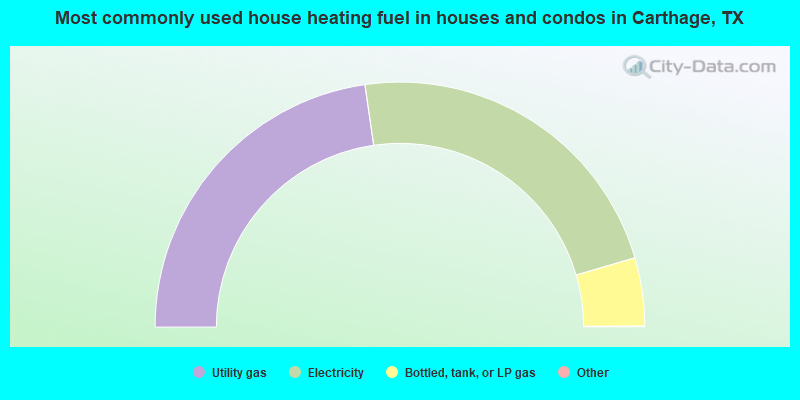
- 45.5%Utility gas
- 45.5%Electricity
- 9.0%Bottled, tank, or LP gas
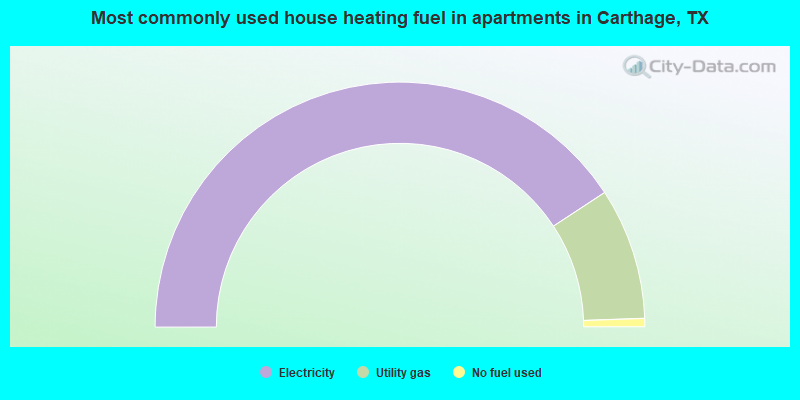
- 81.5%Electricity
- 17.4%Utility gas
- 1.1%No fuel used
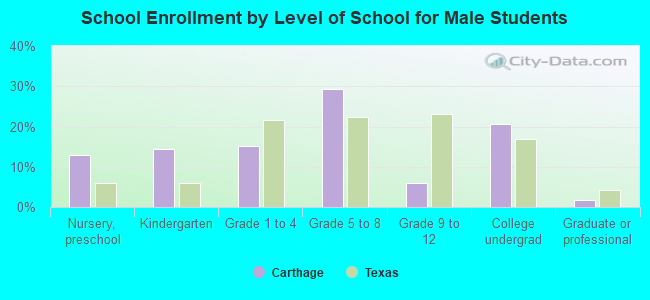
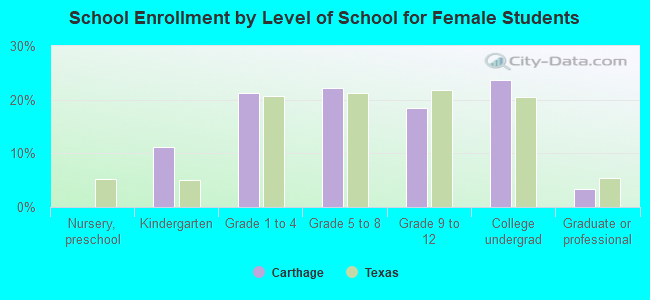
Private vs. public school enrollment:
| Here: | 8.6% |
| Texas: | 8.8% |
| Here: | 1.1% |
| Texas: | 8.0% |
| Here: | 16.0% |
| Texas: | 16.2% |