Housing density: 110 houses/condos per square mile
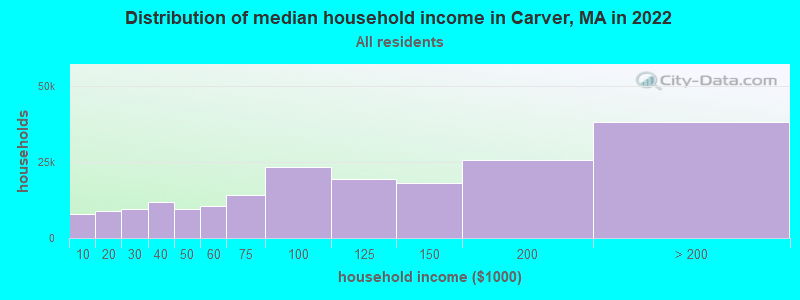
Median price asked for vacant for-sale houses and condos in 2022 in this county: $446,078.
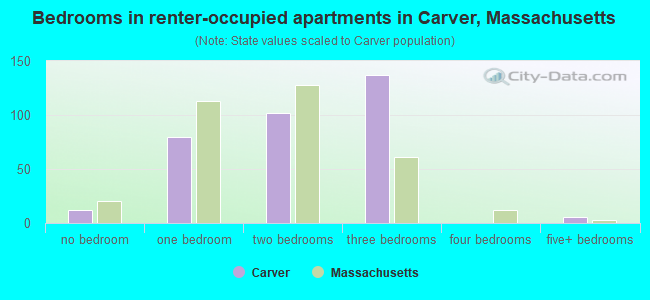
Median contract rent in 2022: $1,457 (lower quartile is $832, upper quartile is $1,950)
Median rent asked for vacant for-rent units in 2022: $1,014
Median gross rent in Carver, MA in 2022: $1,802
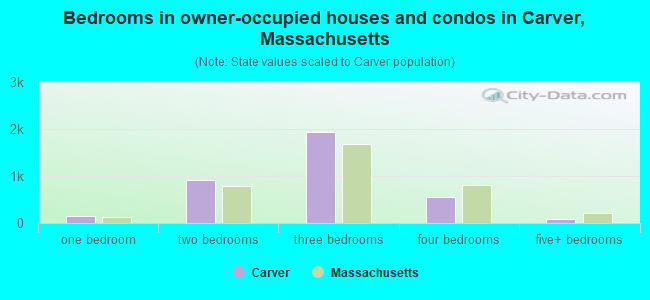
Housing units in Carver with a mortgage: 2,166 (198 second mortgage, 281 home equity loan, 6 both second mortgage and home equity loan) Houses without a mortgage: 251
In family households: 417,329 (86,307 male householders, 41,618 female householders)
97,089 spouses, 154,870 children (146,729 natural, 3,391 adopted, 4,750 stepchildren), 8,780 grandchildren, 4,455 brothers or sisters, 5,200 parents, foster children, 5,123 other relatives, 10,196 non-relatives
In nonfamily households: 65,769 (22,929 male householders (17,306 living alone)), 30,272 female householders (25,724 living alone)), 12,568 nonrelatives
In group quarters: 11,821 (7,645 institutionalized population)
92,167 married couples with children.
24,193 single-parent households (4,628 men, 19,565 women).
95.4% of residents of Carver speak English at home.
1.6% of residents speak Spanish at home (90% speak English very well, 10% speak English not well).
2.7% of residents speak other Indo-European language at home (91% speak English very well, 9% speak English well).
0.2% of residents speak Asian or Pacific Island language at home (100% speak English very well).
0.1% of residents speak other language at home (100% speak English very well).
Foreign born population: 650 (5.2%)
(86.0% of them are naturalized citizens)
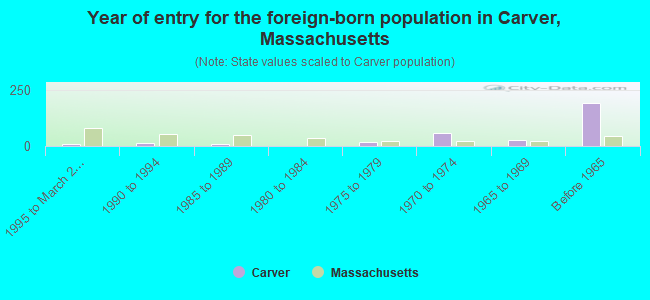
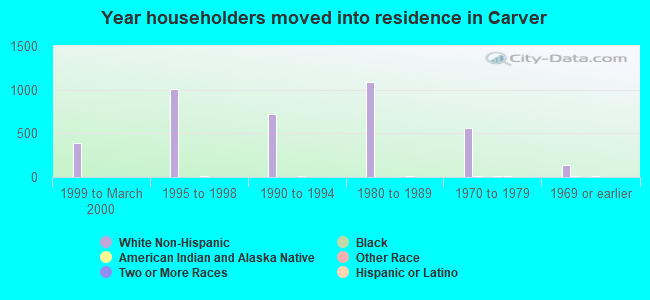
Year of entry for the foreign-born population in Carver, Massachusetts
91995 to March 2000
131990 to 1994
91985 to 1989
01980 to 1984
191975 to 1979
581970 to 1974
271965 to 1969
189Before 1965
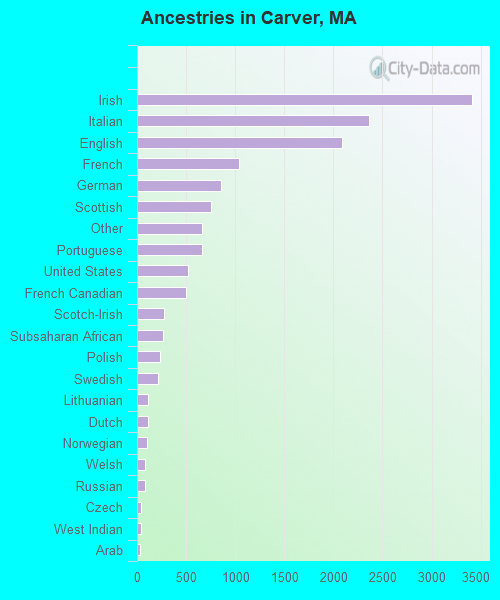
First ancestries reported:
Irish: 3,414 (23.5%)
Italian: 2,363 (16.3%)
English: 2,092 (14.4%)
French: 1,037 (7.1%)
German: 859 (5.9%)
Scottish: 756 (5.2%)
Other: 665 (4.6%)
Portuguese: 662 (4.6%)
United States: 517 (3.6%)
French Canadian: 500 (3.4%)
Scotch-Irish: 280 (1.9%)
Subsaharan African: 261 (1.8%)
Polish: 233 (1.6%)
Swedish: 215 (1.5%)
Lithuanian: 116 (0.8%)
Dutch: 111 (0.8%)
Norwegian: 97 (0.7%)
Welsh: 85 (0.6%)
Russian: 83 (0.6%)
Czech: 44 (0.3%)
West Indian: 42 (0.3%)
Arab: 32 (0.2%)
Greek: 31 (0.2%)
Slovak: 21 (0.1%)
Hungarian: 8 (0.06%)
Most common places of birth for foreign-born residents (%):
Canada
Carver:
34.3% (111)
Massachusetts:
5.2% (40,247)
United Kingdom
Carver:
19.8% (64)
Massachusetts:
3.3% (25,403)
Other Western Africa
Carver:
11.7% (38)
Massachusetts:
2.6% (20,299)
Germany
Carver:
8.0% (26)
Massachusetts:
1.9% (14,883)
Philippines
Carver:
5.2% (17)
Massachusetts:
1.0% (7,414)
Cuba
Carver:
4.6% (15)
Massachusetts:
0.5% (3,868)
Iran
Carver:
4.3% (14)
Massachusetts:
0.6% (4,416)
Netherlands
Carver:
3.4% (11)
Massachusetts:
0.3% (2,470)
France
Carver:
2.5% (8)
Massachusetts:
0.8% (5,895)
Portugal
Carver:
2.2% (7)
Massachusetts:
8.6% (66,627)
Other Northern America
Carver:
2.2% (7)
Massachusetts:
0.1% (467)
Japan
Carver:
1.9% (6)
Massachusetts:
1.1% (8,682)
Place of birth for U.S.-born residents:
This state: 9,722
Other state: 1,092
Northeast: 643
Midwest: 151
South: 182
West: 116
67% of Carver residents lived in the same house 5 years ago. Out of people who lived in different houses, 76% lived in this county. Out of people who lived in different counties, 79% lived in Massachusetts.
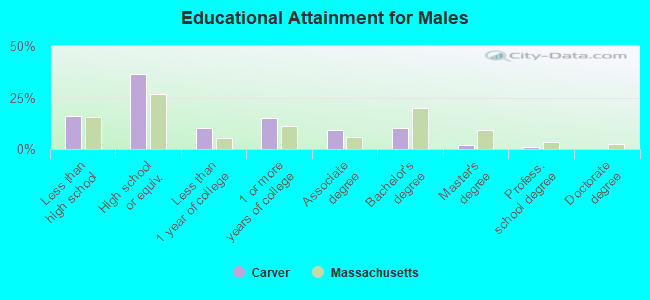
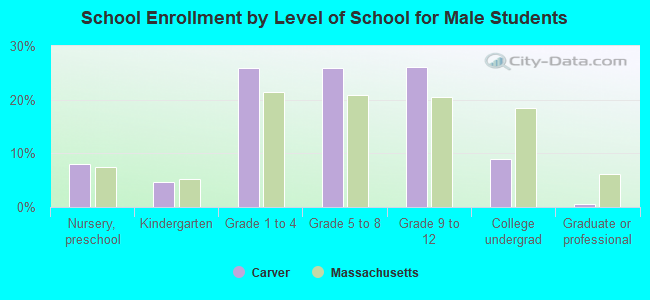
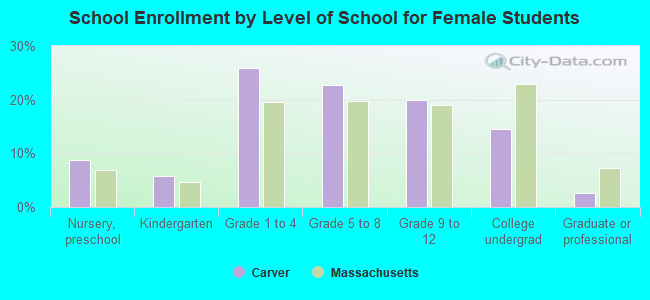
Education attainment for males 25 years and older:
No schooling: 12
Nursery to 4th grade: 6
5th and 6th grade: 17
7th and 8th grade: 51
9th grade: 97
10th grade: 123
11th grade: 84
12th grade, no diploma: 170
High school graduate (or equivalency): 1,258
Less than 1 year of college: 359
Some college more than 1 year, no degree: 525
Associate degree: 318
Bachelor's degree: 355
Master's degree: 67
Professional school degree: 32
Doctorate degree: 0
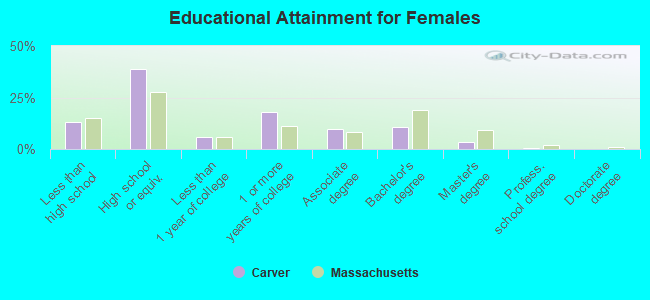
Education attainment for females 25 years and older:
No schooling: 12
Nursery to 4th grade: 0
5th and 6th grade: 9
7th and 8th grade: 52
9th grade: 115
10th grade: 63
11th grade: 98
12th grade, no diploma: 156
High school graduate (or equivalency): 1,498
Less than 1 year of college: 227
Some college more than 1 year, no degree: 697
Associate degree: 382
Bachelor's degree: 404
Master's degree: 124
Professional school degree: 24
Doctorate degree: 8
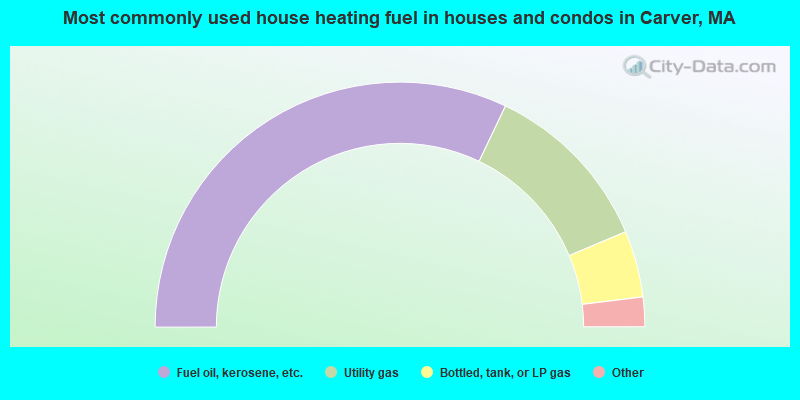
Housing units in structures:
One, detached: 2,812
One, attached: 44
Two: 93
3 or 4: 41
5 to 9: 25
Mobile homes: 1,112
Median worth of mobile homes: $187,115
Housing units lacking complete plumbing facilities: 0.4%
Housing units lacking complete kitchen facilities: 0.2%