Housing density: 1,515 houses/condos per square mile
Median price asked for vacant for-sale houses and condos in 2022 in this county: $843,880.
Median contract rent in 2022: $1,983 (lower quartile is $1,563, upper quartile is over $2,000)
Median rent asked for vacant for-rent units in 2022: $2,206
Median gross rent in Cascade-Fairwood, WA in 2022: over $2,000
Housing units in Cascade-Fairwood with a mortgage: 6,404 (784 second mortgage, 646 home equity loan, 48 both second mortgage and home equity loan) Houses without a mortgage: 1,306
Compare current foreclosures near Cascade-Fairwood, WA:
In family households: 1,455,162 (324,509 male householders, 137,001 female householders)
357,491 spouses, 491,900 children (462,739 natural, 12,743 adopted, 16,418 stepchildren), 22,208 grandchildren, 21,116 brothers or sisters, 17,956 parents, foster children, 25,527 other relatives, 45,636 non-relatives
In nonfamily households: 438,956 (162,683 male householders (115,616 living alone)), 165,039 female householders (129,083 living alone)), 111,234 nonrelatives
In group quarters: 37,131 (10,490 institutionalized population)
277,933 married couples with children.
81,653 single-parent households (19,170 men, 62,483 women).
83.0% of residents of Cascade-Fairwood speak English at home.
2.9% of residents speak Spanish at home (75% speak English very well, 14% speak English well, 8% speak English not well, 3% don't speak English at all).
4.2% of residents speak other Indo-European language at home (59% speak English very well, 24% speak English well, 11% speak English not well, 5% don't speak English at all).
9.4% of residents speak Asian or Pacific Island language at home (51% speak English very well, 31% speak English well, 16% speak English not well, 3% don't speak English at all).
0.7% of residents speak other language at home (76% speak English very well, 12% speak English well, 11% speak English not well, 2% don't speak English at all).
Foreign born population: 10,060 (22.4%)
(57.3% of them are naturalized citizens)
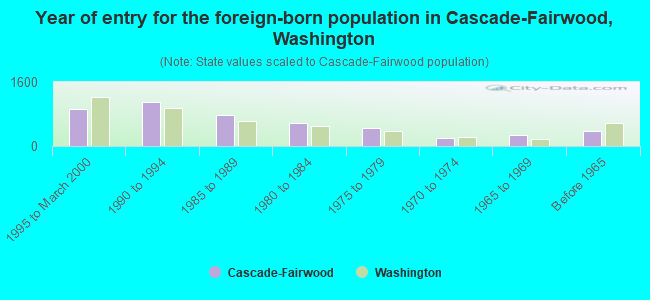
Year of entry for the foreign-born population in Cascade-Fairwood, Washington
9361995 to March 2000
1,0941990 to 1994
7631985 to 1989
5711980 to 1984
4491975 to 1979
1911970 to 1974
2811965 to 1969
367Before 1965
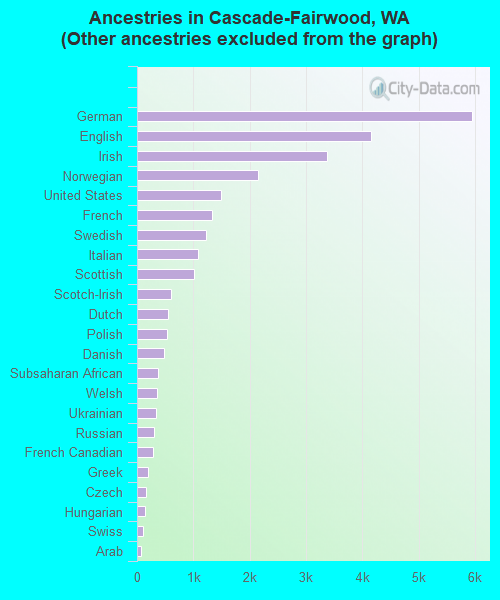
First ancestries reported:
Other: 11,782 (30.9%)
German: 5,954 (15.6%)
English: 4,158 (10.9%)
Irish: 3,368 (8.8%)
Norwegian: 2,155 (5.6%)
United States: 1,498 (3.9%)
French: 1,335 (3.5%)
Swedish: 1,226 (3.2%)
Italian: 1,079 (2.8%)
Scottish: 1,013 (2.7%)
Scotch-Irish: 600 (1.6%)
Dutch: 544 (1.4%)
Polish: 538 (1.4%)
Danish: 477 (1.2%)
Subsaharan African: 379 (1.0%)
Welsh: 354 (0.9%)
Ukrainian: 339 (0.9%)
Russian: 297 (0.8%)
French Canadian: 282 (0.7%)
Greek: 199 (0.5%)
Czech: 168 (0.4%)
Hungarian: 146 (0.4%)
Swiss: 115 (0.3%)
Arab: 72 (0.2%)
West Indian: 43 (0.1%)
Lithuanian: 25 (0.07%)
Slovak: 21 (0.06%)
Portuguese: 14 (0.04%)
Most common places of birth for foreign-born residents (%):
Philippines
Cascade-Fairwood:
16.6% (772)
Washington:
7.6% (46,733)
Vietnam
Cascade-Fairwood:
15.5% (720)
Washington:
6.7% (40,879)
China, excluding Hong Kong and Taiwan
Cascade-Fairwood:
6.4% (297)
Washington:
3.3% (20,530)
India
Cascade-Fairwood:
6.2% (289)
Washington:
2.4% (14,714)
Canada
Cascade-Fairwood:
6.1% (283)
Washington:
7.7% (47,568)
Mexico
Cascade-Fairwood:
4.5% (211)
Washington:
24.1% (148,115)
Ukraine
Cascade-Fairwood:
4.4% (206)
Washington:
3.0% (18,572)
Korea
Cascade-Fairwood:
3.3% (155)
Washington:
6.2% (38,172)
Hong Kong
Cascade-Fairwood:
3.2% (148)
Washington:
1.0% (6,263)
Poland
Cascade-Fairwood:
2.6% (123)
Washington:
0.7% (4,092)
Germany
Cascade-Fairwood:
2.3% (106)
Washington:
3.4% (21,167)
Taiwan
Cascade-Fairwood:
2.2% (104)
Washington:
1.4% (8,353)
United Kingdom
Cascade-Fairwood:
2.0% (94)
Washington:
3.3% (20,321)
Belarus
Cascade-Fairwood:
2.0% (93)
Washington:
0.2% (1,309)
Other Eastern Africa
Cascade-Fairwood:
1.7% (78)
Washington:
1.0% (6,438)
Place of birth for U.S.-born residents:
This state: 16,589
Other state: 12,617
Northeast: 1,058
Midwest: 3,647
South: 1,847
West: 6,065
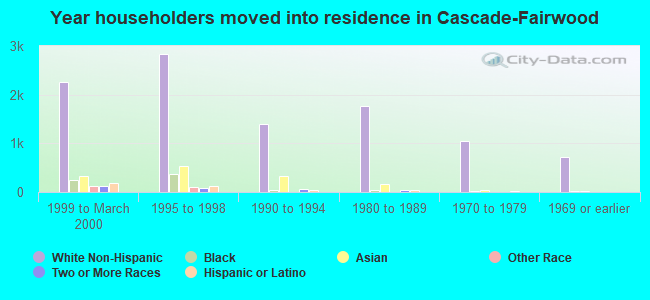
51% of Cascade-Fairwood residents lived in the same house 5 years ago. Out of people who lived in different houses, 71% lived in this county. Out of people who lived in different counties, 35% lived in Washington.
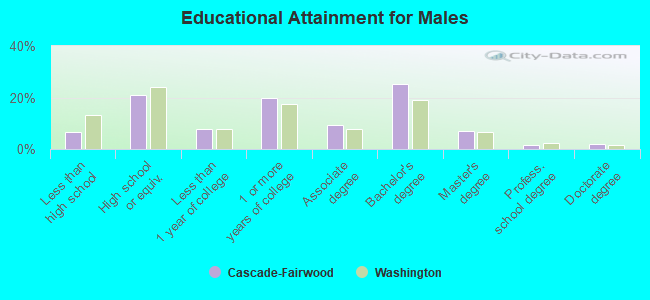
Education attainment for males 25 years and older:
No schooling: 50
Nursery to 4th grade: 17
5th and 6th grade: 32
7th and 8th grade: 119
9th grade: 72
10th grade: 124
11th grade: 103
12th grade, no diploma: 211
High school graduate (or equivalency): 2,292
Less than 1 year of college: 862
Some college more than 1 year, no degree: 2,171
Associate degree: 1,004
Bachelor's degree: 2,739
Master's degree: 744
Professional school degree: 159
Doctorate degree: 193
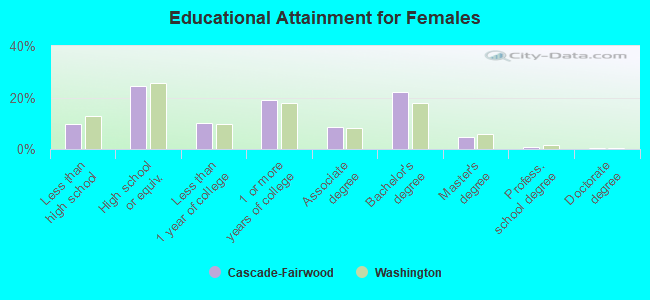
Education attainment for females 25 years and older:
No schooling: 90
Nursery to 4th grade: 49
5th and 6th grade: 39
7th and 8th grade: 154
9th grade: 81
10th grade: 172
11th grade: 213
12th grade, no diploma: 332
High school graduate (or equivalency): 2,829
Less than 1 year of college: 1,181
Some college more than 1 year, no degree: 2,165
Associate degree: 1,001
Bachelor's degree: 2,535
Master's degree: 521
Professional school degree: 88
Doctorate degree: 25
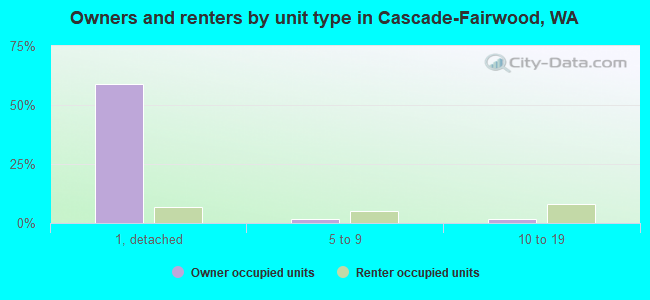
Housing units in structures:
One, detached: 8,661
One, attached: 350
Two: 33
3 or 4: 420
5 to 9: 910
10 to 19: 1,431
20 to 49: 274
50 or more: 828
Mobile homes: 499
Boats, RVs, vans, etc.: 28
Median worth of mobile homes: $88,456
Housing units lacking complete plumbing facilities: 0.4%
Housing units lacking complete kitchen facilities: 0.2%