Castroville, TX (Texas) Houses and Residents
| Castroville: | $288,476 |
| Texas: | $275,400 |
Mean price in 2022:
Detached houses: $337,937
Here: $337,937 State: $369,058 Mobile homes: $17,999
Here: $17,999 State: $124,413
Total population: 2,909 (Urban population: 2,581 (all inside urban clusters), Rural population: 92 (all nonfarm))
Houses: 1,291 (1,174 occupied: 827 owner occupied, 364 renter occupied)
| % of renters here: | 31% |
| State: | 38% |
Housing density: 507 houses/condos per square mile
Median price asked for vacant for-sale houses and condos in 2022 in this county: $496,539.
Median contract rent in 2022: $1,081 (lower quartile is $921, upper quartile is $1,284)
Median rent asked for vacant for-rent units in 2022: $1,190
Median gross rent in Castroville, TX in 2022: $1,240
Housing units in Castroville with a mortgage: 404 (10 second mortgage, 0 home equity loan, 11 both second mortgage and home equity loan)
Houses without a mortgage: 0
Median household income for houses/condos with a mortgage: $107,153
Median household income for apartments without a mortgage: $65,463
Median monthly housing costs: $1,189
Compare current foreclosures near Castroville, TX:
| Photo | Address | Area | Beds / Baths | Price | Details |
|---|---|---|---|---|---|

|
#1
Geneva St
Castroville, TX 78009
|
- sq. feet
|
- baths - beds |
show details | |

|
#2
County Road 4610
Castroville, TX 78009
|
- sq. feet
|
- baths - beds |
show details | |

|
#3
County Road 5634
Castroville, TX 78009
|
- sq. feet
|
- baths - beds |
show details | |

|
#4
County Road 4614
Castroville, TX 78009
|
- sq. feet
|
- baths - beds |
show details | |

|
#5
Lantana Path
Castroville, TX 78009
|
- sq. feet
|
- baths - beds |
show details | |

|
#6
London St
Castroville, TX 78009
|
- sq. feet
|
- baths - beds |
show details | |

|
#7
Hollow Dr Apt 1
Castroville, TX 78009
|
- sq. feet
|
- baths - beds |
show details | |

|
#8
Timber Park St
San Antonio, TX 78250
|
1,750 sq. feet
|
2 baths 3 beds |
$249,900
|
show details |

|
#9
Gavilan Dr
San Antonio, TX 78242
|
2,449 sq. feet
|
1 baths 3 beds |
$93,250
|
show details |

|
#10
County Road 5720
Castroville, TX 78009
|
- sq. feet
|
- baths - beds |
show details |
| Photo | Address | Area | Beds / Baths | Price | Details |
|---|---|---|---|---|---|

|
#11
County Road 5739
Castroville, TX 78009
|
- sq. feet
|
- baths - beds |
show details | |

|
#12
County Road 5740
Castroville, TX 78009
|
- sq. feet
|
- baths - beds |
show details | |

|
#13
County Road 4612
Castroville, TX 78009
|
- sq. feet
|
- baths - beds |
show details | |

|
#14
Deer Vlg
San Antonio, TX 78250
|
1,404 sq. feet
|
4 baths 3 beds |
show details | |

|
#15
Highland Mist Ln
San Antonio, TX 78251
|
2,692 sq. feet
|
2 baths 4 beds |
show details | |

|
#16
Plaudit
San Antonio, TX 78245
|
- sq. feet
|
2 baths 3 beds |
show details | |

|
#17
Laxey Wheel
San Antonio, TX 78254
|
3,208 sq. feet
|
3 baths 5 beds |
show details | |

|
#18
Hilltop Crossing Dr
San Antonio, TX 78251
|
1,410 sq. feet
|
3 baths 3 beds |
show details | |

|
#19
Marbach Crst
San Antonio, TX 78245
|
1,226 sq. feet
|
2 baths 3 beds |
show details | |

|
#20
Mallow Grv
San Antonio, TX 78253
|
1,507 sq. feet
|
2 baths 3 beds |
show details |
| Photo | Address | Area | Beds / Baths | Price | Details |
|---|---|---|---|---|---|

|
#21
Mulberry Creek
San Antonio, TX 78245
|
2,516 sq. feet
|
3 baths 5 beds |
show details | |

|
#22
Monterey Crst
San Antonio, TX 78251
|
2,667 sq. feet
|
2 baths 4 beds |
show details | |

|
#23
Reyes Hts
San Antonio, TX 78254
|
- sq. feet
|
2 baths 3 beds |
show details | |

|
#24
Rock Valley Dr
San Antonio, TX 78227
|
1,056 sq. feet
|
1 baths 3 beds |
show details | |

|
#25
Tianna Lace
San Antonio, TX 78253
|
- sq. feet
|
3 baths 5 beds |
show details | |

|
#26
Mustang Rdg
Natalia, TX 78059
|
- sq. feet
|
2 baths 3 beds |
show details | |

|
#27
Alcoser Ct
San Antonio, TX 78252
|
- sq. feet
|
2 baths 4 beds |
show details | |

|
#28
Cedar Run Dr
San Antonio, TX 78245
|
1,986 sq. feet
|
2 baths 4 beds |
show details | |

|
#29
Skybound
San Antonio, TX 78245
|
1,692 sq. feet
|
2 baths 3 beds |
show details | |

|
#30
Hallie Pass
San Antonio, TX 78227
|
2,160 sq. feet
|
2 baths 3 beds |
show details |
| Photo | Address | Area | Beds / Baths | Price | Details |
|---|---|---|---|---|---|

|
#31
Winterstone Dr
San Antonio, TX 78254
|
1,210 sq. feet
|
2 baths 4 beds |
show details | |

|
#32
Buffalo Pass Dr
San Antonio, TX 78245
|
2,042 sq. feet
|
3 baths 4 beds |
show details | |

|
#33
Aurora Fld
San Antonio, TX 78245
|
1,554 sq. feet
|
2 baths 3 beds |
show details | |

|
#34
Bronco Ln
San Antonio, TX 78227
|
1,694 sq. feet
|
2 baths 3 beds |
show details | |

|
#35
Cullum Park
San Antonio, TX 78253
|
3,175 sq. feet
|
4 baths 5 beds |
show details | |

|
#36
Big Rock Dr
San Antonio, TX 78227
|
1,346 sq. feet
|
2 baths 3 beds |
show details | |

|
#37
Idared
San Antonio, TX 78252
|
- sq. feet
|
2 baths 4 beds |
show details | |

|
#38
Colonia
San Antonio, TX 78254
|
3,288 sq. feet
|
2 baths 4 beds |
show details | |

|
#39
Fine Design
San Antonio, TX 78245
|
- sq. feet
|
3 baths 3 beds |
show details | |

|
#40
Prairie Flower St
San Antonio, TX 78242
|
980 sq. feet
|
2 baths 3 beds |
show details |
| Photo | Address | Area | Beds / Baths | Price | Details |
|---|---|---|---|---|---|

|
#41
Hamilton Pool
San Antonio, TX 78245
|
- sq. feet
|
2 baths 3 beds |
show details | |

|
#42
Rosewood Crk
San Antonio, TX 78245
|
1,955 sq. feet
|
2 baths 4 beds |
show details | |

|
#43
Piper Sonoma
San Antonio, TX 78253
|
2,656 sq. feet
|
3 baths 3 beds |
show details | |

|
#44
Sunset Bay
San Antonio, TX 78245
|
1,601 sq. feet
|
2 baths 3 beds |
show details | |

|
#45
Prairie Flower St
San Antonio, TX 78242
|
- sq. feet
|
2 baths 3 beds |
show details | |

|
#46
Carswell Bnd
San Antonio, TX 78245
|
1,160 sq. feet
|
1 baths 3 beds |
show details | |

|
#47
Sabinal
San Antonio, TX 78252
|
2,581 sq. feet
|
2 baths 5 beds |
show details | |

|
#48
Oakdale Park
San Antonio, TX 78254
|
1,673 sq. feet
|
2 baths 3 beds |
show details | |

|
#49
Pr 677
Devine, TX 78016
|
1,860 sq. feet
|
2 baths 3 beds |
show details | |

|
Check over 1 million property listings on Foreclosure.com!
|
browse all offers | |||

Latest news about housing in Castroville, TX collected exclusively by city-data.com from local newspapers, TV, and radio stations

 | New Leaf Homes - Dove Creek (21 replies) |
| Advice on renting in San Antonio (30 replies) |
| Uvalde vs Castroville vs Hondo (32 replies) |
| Considering moving my family of 5 to TX (from IL...) (25 replies) |
| Waco-Austin-San Antonio Mega Region? (91 replies) |
| Where to live in Northwest area of SA? (90 replies) |

Median year apartment built: 1984
Household type by relationship:
Households: 3,074- Male householders: 416 (57 living alone), Female householders: 741 (157 living alone)
674 spouses (674 opposite-sex spouses), 28 unmarried partners, (23 opposite-sex unmarried partners), 849 children (745 natural, 70 adopted, 32 stepchildren), 159 grandchildren, 1 brothers or sisters, 7 parents, 0 foster children, 44 other relatives, 46 non-relatives
- In group quarters: 105
Size of family households: 559 2-persons, 180 3-persons, 133 4-persons, 42 5-persons, 25 6-persons, 10 7-or-more-persons.
Size of nonfamily households: 226 1-person, 14 2-persons.
365 married couples with children.
180 single-parent households (76 men, 104 women).
76.6% of residents of Castroville speak English at home.
23.3% of residents speak Spanish at home (73% speak English very well, 14% speak English well, 10% speak English not well, 2% don't speak English at all).
0.3% of residents speak other Indo-European language at home (100% speak English very well).
0.3% of residents speak Asian or Pacific Island language at home (100% speak English well).
Foreign born population: 41 (1.3%)
(107.3% of them are naturalized citizens)
| Here: | 6.4 |
| State: | 6.3 |
| Here: | 4.1 |
| State: | 4.0 |

- Bedrooms in owner-occupied houses and condos in Castroville, Texas
- 0no bedroom
- 231 bedroom
- 1042 bedrooms
- 5673 bedrooms
- 1244 bedrooms
- 115+ bedrooms

- Bedrooms in renter-occupied apartments in Castroville, Texas
- 0no bedroom
- 381 bedroom
- 2292 bedrooms
- 973 bedrooms
- 04 bedrooms
- 05+ bedrooms

- Cars and other vehicles available in Castroville in owner-occupied houses/condos
- 17no vehicle
- 1981 vehicle
- 3662 vehicles
- 1883 vehicles
- 594 vehicles
- 05+ vehicles

- Cars and other vehicles available in Castroville in renter-occupied apartments
- 54no vehicle
- 1241 vehicle
- 1412 vehicles
- 473 vehicles
- 04 vehicles
- 05+ vehicles

- Rooms in owner-occupied houses in Castroville, Texas
- 01 room
- 132 rooms
- 03 rooms
- 364 rooms
- 1435 rooms
- 2396 rooms
- 1337 rooms
- 1308 rooms
- 1349+ rooms

- Rooms in renter-occupied apartments in Castroville, Texas
- 01 room
- 02 rooms
- 363 rooms
- 1964 rooms
- 505 rooms
- 606 rooms
- 07 rooms
- 168 rooms
- 79+ rooms


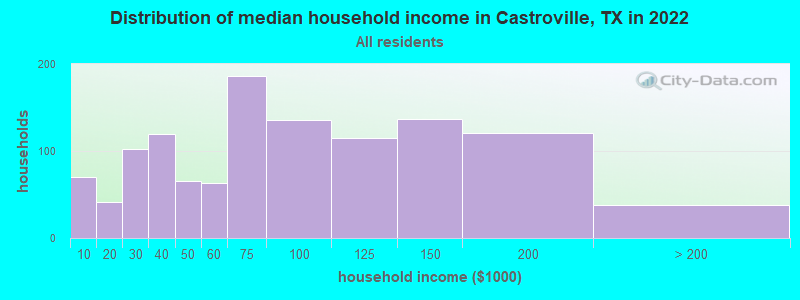
Castroville, TX household income distribution

- 70Less than $10,000
- 41$10,000 to $19,999
- 102$20,000 to $29,999
- 120$30,000 to $39,999
- 66$40,000 to $49,999
- 63$50,000 to $59,999
- 186$60,000 to $74,999
- 136$75,000 to $99,999
- 115$100,000 to $124,999
- 137$125,000 to $149,999
- 121$150,000 to $199,999
- 38$200,000 or more
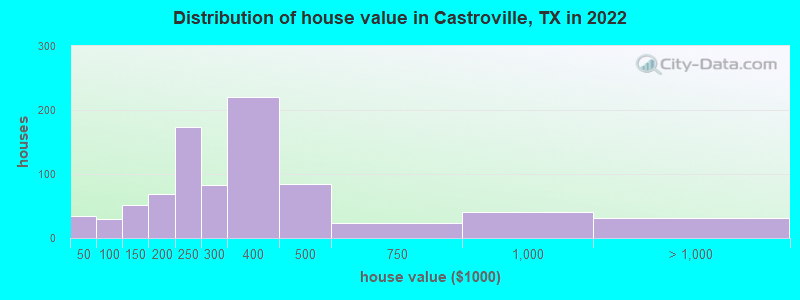
Home value of owner - occupied houses in 2022 in Castroville, TX
-
- 1$15,000 to $19,999
- 14$25,000 to $29,999
- 18$35,000 to $39,999
- 4$50,000 to $59,999
- 5$60,000 to $69,999
- 18$70,000 to $79,999
- 37$100,000 to $124,999
- 14$125,000 to $149,999
- 26$150,000 to $174,999
- 43$175,000 to $199,999
- 172$200,000 to $249,999
- 82$250,000 to $299,999
- 219$300,000 to $399,999
- 84$400,000 to $499,999
- 24$500,000 to $749,999
- 40$750,000 to $999,999
- 8$1,000,000 to $1,499,999
- 22$2,000,000 or more
Rent paid by renters in 2022 in Castroville, TX
-
- 17$100 to $149
- 4$150 to $199
- 5$300 to $349
- 22$600 to $649
- 28$750 to $799
- 58$900 to $999
- 105$1,000 to $1,249
- 49$1,250 to $1,499
- 21$1,500 to $1,999
- 8$2,000 to $2,499
- 33No cash rent

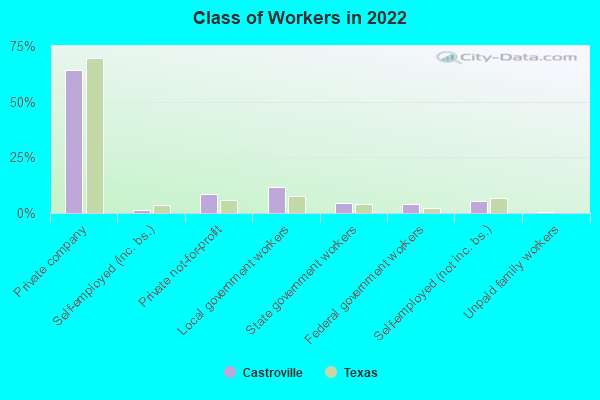
Percentage of workers working in this county: 47.7%
Number of people working at home: 187 (13.7% of all workers)
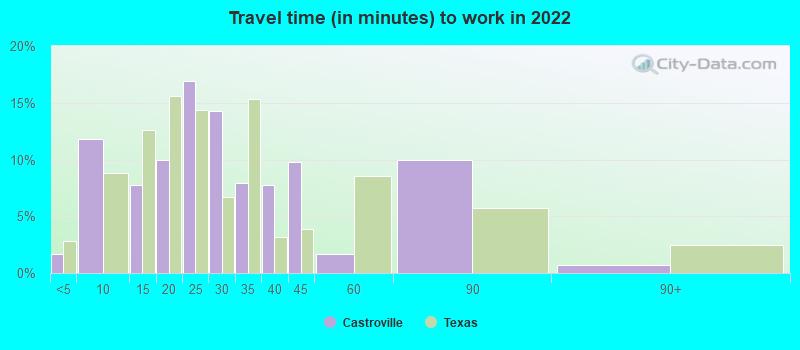
Travel time to work (commute)
- Less than 5 minutes: 10
- 5 to 9 minutes: 140
- 10 to 14 minutes: 47
- 15 to 19 minutes: 96
- 20 to 24 minutes: 205
- 25 to 29 minutes: 97
- 30 to 34 minutes: 204
- 35 to 39 minutes: 52
- 40 to 44 minutes: 73
- 45 to 59 minutes: 158
- 60 to 89 minutes: 57
- 90 or more minutes: 28
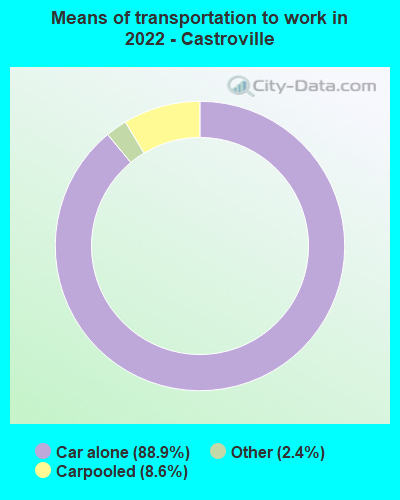
Means of transportation to work:
- Drove a car alone: 1,504 (78.1%)
- Carpooled: 158 (8.2%)
- Taxi: 50 (2.6%)
- Worked at home: 187 (9.7%)
- Unemployment by race in 2022
- Unemployment rate for Hispanic or Latino residents
- 2.4%Males
- 6.4%Females

- Year of entry for the foreign-born population in Castroville, Texas
- 182010 or later
- 02000 to 2009
- 01990 to 1999
- 391980 to 1989
- 121970 to 1979
- 24Before 1970
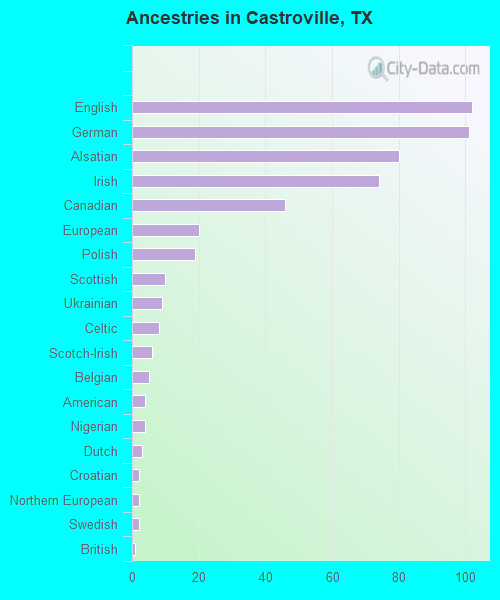
First ancestries reported:
- English: 102 (8.1%)
- German: 101 (8.1%)
- Alsatian: 80 (6.4%)
- Irish: 74 (5.9%)
- Canadian: 46 (3.7%)
- European: 20 (1.6%)
- Polish: 19 (1.5%)
- Scottish: 10 (0.8%)
- Ukrainian: 9 (0.7%)
- Celtic: 8 (0.6%)
- Scotch-Irish: 6 (0.5%)
- Belgian: 5 (0.4%)
- American: 4 (0.3%)
- Nigerian: 4 (0.3%)
- Dutch: 3 (0.2%)
- Croatian: 2 (0.2%)
- Northern European: 2 (0.2%)
- Swedish: 2 (0.2%)
- British: 1 (0.08%)
Most common places of birth for foreign-born residents (%):
| Castroville: | 58.5% (24) |
| Texas: | 48.4% (2,411,723) |
| Castroville: | 19.5% (8) |
| Texas: | 0.4% (17,796) |
| Castroville: | 9.8% (4) |
| Texas: | 0.1% (5,793) |
| Castroville: | 4.9% (2) |
| Texas: | 0.1% (2,851) |
Place of birth for U.S.-born residents:
- This state: 2,409
- Other state: 471
- Northeast: 65
- Midwest: 129
- South: 106
- West: 172
73.4% of Castroville residents lived in the same house 1 years ago.
Out of people who lived in different houses, 34.6% lived in this county.
Out of people who lived in different counties, 95.9% lived in Texas.
| Castroville: | 73.4% |
| State average: | 85.7% |
Education attainment for males 25 years and older:
- No schooling: 2
- Nursery to 4th grade: 0
- 5th and 6th grade: 0
- 7th and 8th grade: 8
- 9th grade: 11
- 10th grade: 60
- 11th grade: 8
- 12th grade, no diploma: 6
- High school graduate (or equivalency): 182
- Less than 1 year of college: 109
- Some college more than 1 year, no degree: 139
- Associate degree: 168
- Bachelor's degree: 121
- Master's degree: 123
- Professional school degree: 3
- Doctorate degree: 0

Education attainment for females 25 years and older:
- No schooling: 3
- Nursery to 4th grade: 0
- 5th and 6th grade: 15
- 7th and 8th grade: 36
- 9th grade: 0
- 10th grade: 0
- 11th grade: 23
- 12th grade, no diploma: 40
- High school graduate (or equivalency): 170
- Less than 1 year of college: 265
- Some college more than 1 year, no degree: 150
- Associate degree: 121
- Bachelor's degree: 273
- Master's degree: 100
- Professional school degree: 3
- Doctorate degree: 24


Housing units in structures:
- One, detached: 1,026
- 3 or 4: 127
- 5 to 9: 68
- 20 to 49: 5
- Mobile homes: 63
Housing units lacking complete kitchen facilities in 2022: 0.3%
House/condo owner moved in on average 20 years ago
Renter moved in on average 1 years ago

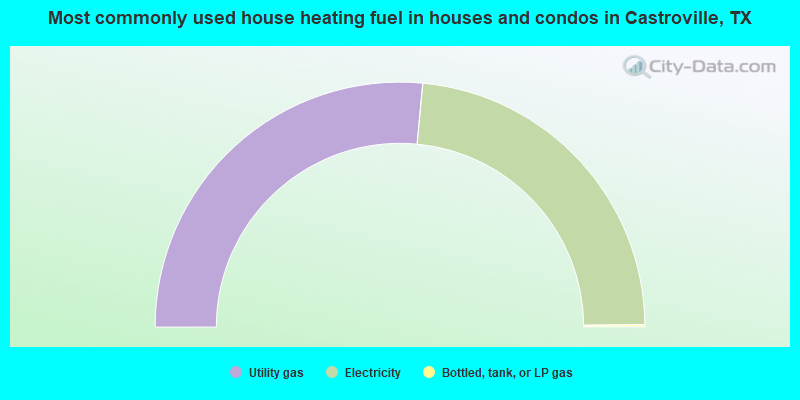
- 53.0%Utility gas
- 46.7%Electricity
- 0.3%Bottled, tank, or LP gas
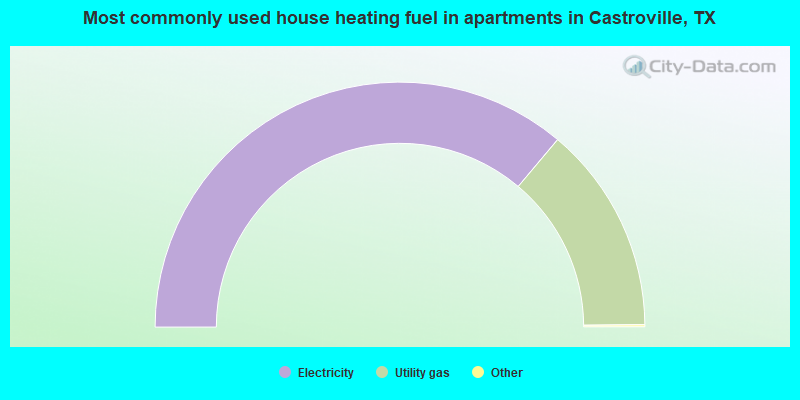
- 72.5%Electricity
- 27.5%Utility gas
Private vs. public school enrollment:
| Here: | 14.2% |
| Texas: | 8.8% |
| Here: | 0.0% |
| Texas: | 8.0% |
| Here: | 6.0% |
| Texas: | 16.2% |


