Cathan, WA (Washington) Houses and Residents
| Cathan: | $552,106 |
| Washington: | $569,500 |
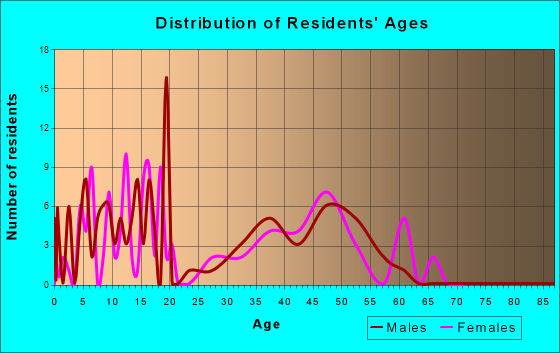
Total population: 583 (Urban population: 0, Rural population: 489 (all nonfarm))
Houses: 170 (165 occupied: 159 owner occupied, 6 renter occupied)
| % of renters here: | 4% |
| State: | 36% |
Housing density: 64 houses/condos per square mile
Median price asked for vacant for-sale houses and condos in 2022 in this county: $628,500.
Median contract rent in 2022: over $2,000 (lower quartile is $1,870, upper quartile is over $2,000)
Median gross rent in Cathan, WA in 2022: over $2,000
Housing units in Cathan with a mortgage: 92 (19 second mortgage, 10 home equity loan, 0 both second mortgage and home equity loan)
Houses without a mortgage: 9


Household type by relationship:
Households: 702,938- In family households: 589,694 (132,675 male householders, 49,607 female householders)
140,500 spouses, 208,748 children (193,212 natural, 5,027 adopted, 10,509 stepchildren), 9,881 grandchildren, 6,965 brothers or sisters, 6,533 parents, foster children, 9,131 other relatives, 20,713 non-relatives
- In nonfamily households: 113,244 (43,016 male householders (30,707 living alone)), 43,027 female householders (34,612 living alone)), 27,201 nonrelatives
- In group quarters: 10,397 (5,769 institutionalized population)
121,078 married couples with children.
33,184 single-parent households (9,051 men, 24,133 women).
97.4% of residents of Cathan speak English at home.
0.4% of residents speak Spanish at home (100% speak English very well).
2.2% of residents speak Asian or Pacific Island language at home (100% speak English very well).
Foreign born population: 28 (4.1%)
(78.6% of them are naturalized citizens)
| Here: | 5.4 |
| State: | 6.5 |
| Here: | 4.0 |
| State: | 3.9 |

- Bedrooms in owner-occupied houses and condos in Cathan, Washington
- 0no bedroom
- 31 bedroom
- 232 bedrooms
- 1173 bedrooms
- 144 bedrooms
- 25+ bedrooms

- Bedrooms in renter-occupied apartments in Cathan, Washington
- 0no bedroom
- 01 bedroom
- 02 bedrooms
- 63 bedrooms
- 04 bedrooms
- 05+ bedrooms

- Cars and other vehicles available in Cathan in owner-occupied houses/condos
- 0no vehicle
- 161 vehicle
- 852 vehicles
- 393 vehicles
- 54 vehicles
- 145+ vehicles

- Cars and other vehicles available in Cathan in renter-occupied apartments
- 0no vehicle
- 31 vehicle
- 32 vehicles
- 03 vehicles
- 04 vehicles
- 05+ vehicles

- Rooms in owner-occupied houses in Cathan, Washington
- 01 room
- 32 rooms
- 93 rooms
- 154 rooms
- 485 rooms
- 346 rooms
- 187 rooms
- 248 rooms
- 89+ rooms

- Rooms in renter-occupied apartments in Cathan, Washington
- 01 room
- 02 rooms
- 03 rooms
- 34 rooms
- 35 rooms
- 06 rooms
- 07 rooms
- 08 rooms
- 09+ rooms


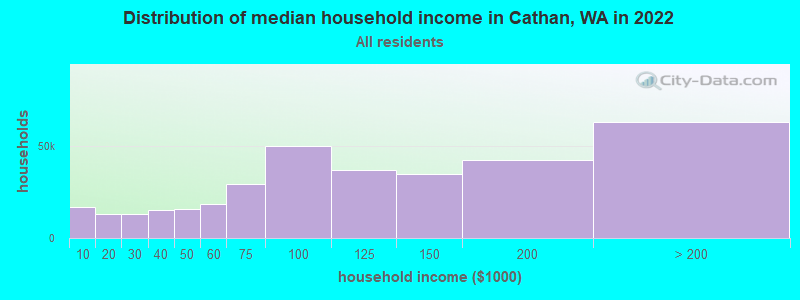
Cathan, WA household income distribution

- 16,690Less than $10,000
- 13,312$10,000 to $19,999
- 12,920$20,000 to $29,999
- 15,086$30,000 to $39,999
- 15,816$40,000 to $49,999
- 18,530$50,000 to $59,999
- 29,634$60,000 to $74,999
- 49,988$75,000 to $99,999
- 36,875$100,000 to $124,999
- 34,634$125,000 to $149,999
- 42,682$150,000 to $199,999
- 63,230$200,000 or more
Percentage of workers working in this county: 95.5%
Number of people working at home: 81 (21.5% of all workers)
Travel time to work (commute)
- Less than 5 minutes: 0
- 5 to 9 minutes: 2
- 10 to 14 minutes: 22
- 15 to 19 minutes: 40
- 20 to 24 minutes: 45
- 25 to 29 minutes: 25
- 30 to 34 minutes: 40
- 35 to 39 minutes: 9
- 40 to 44 minutes: 17
- 45 to 59 minutes: 25
- 60 to 89 minutes: 19
- 90 or more minutes: 14
Means of transportation to work:
- Drove a car alone: 215 (82.1%)
- Carpooled: 40 (15.3%)
- Motorcycle: 3 (1.1%)
- Worked at home: 4 (1.5%)

- Year of entry for the foreign-born population in Cathan, Washington
- 31995 to March 2000
- 01990 to 1994
- 01985 to 1989
- 01980 to 1984
- 31975 to 1979
- 01970 to 1974
- 01965 to 1969
- 5Before 1965

First ancestries reported:
- German: 117 (23.7%)
- Irish: 64 (13.0%)
- English: 61 (12.3%)
- Other: 54 (10.9%)
- United States: 37 (7.5%)
- Norwegian: 33 (6.7%)
- Swedish: 29 (5.9%)
- Italian: 22 (4.5%)
- French: 16 (3.2%)
- Scottish: 16 (3.2%)
- Scotch-Irish: 10 (2.0%)
- Dutch: 8 (1.6%)
- Welsh: 7 (1.4%)
- Danish: 5 (1.0%)
- Polish: 5 (1.0%)
- Portuguese: 5 (1.0%)
- French Canadian: 3 (0.6%)
- Swiss: 2 (0.4%)
Most common places of birth for foreign-born residents (%):
| Cathan: | 45.5% (5) |
| Washington: | 7.6% (46,733) |
| Cathan: | 27.3% (3) |
| Washington: | 3.4% (21,167) |
| Cathan: | 27.3% (3) |
| Washington: | 7.7% (47,568) |
Place of birth for U.S.-born residents:
- This state: 304
- Other state: 170
- Northeast: 5
- Midwest: 44
- South: 25
- West: 96
68% of Cathan residents lived in the same house 5 years ago.
Out of people who lived in different houses, 73% lived in this county.
Out of people who lived in different counties, 30% lived in Washington.
Education attainment for males 25 years and older:
- No schooling: 0
- Nursery to 4th grade: 0
- 5th and 6th grade: 0
- 7th and 8th grade: 0
- 9th grade: 0
- 10th grade: 0
- 11th grade: 0
- 12th grade, no diploma: 2
- High school graduate (or equivalency): 57
- Less than 1 year of college: 23
- Some college more than 1 year, no degree: 29
- Associate degree: 17
- Bachelor's degree: 27
- Master's degree: 0
- Professional school degree: 0
- Doctorate degree: 0

Education attainment for females 25 years and older:
- No schooling: 0
- Nursery to 4th grade: 0
- 5th and 6th grade: 0
- 7th and 8th grade: 6
- 9th grade: 0
- 10th grade: 0
- 11th grade: 5
- 12th grade, no diploma: 3
- High school graduate (or equivalency): 44
- Less than 1 year of college: 36
- Some college more than 1 year, no degree: 20
- Associate degree: 21
- Bachelor's degree: 8
- Master's degree: 5
- Professional school degree: 0
- Doctorate degree: 0

Housing units in structures:
- One, detached: 116
- Two: 2
- Mobile homes: 52
Median worth of mobile homes: $361,334

Private vs. public school enrollment:
| Here: | 11.3% |
| Washington: | 9.2% |
| Here: | 11.1% |
| Washington: | 7.0% |
| Here: | 0.0% |
| Washington: | 15.7% |


