Cedar Glen West, NJ (New Jersey) Houses and Residents
| Cedar Glen West: | $76,211 |
| New Jersey: | $428,900 |
Mean price in 2022:
Detached houses: $381,340
Here: $381,340 State: $537,591 Townhouses or other attached units: $71,731
Here: $71,731 State: $381,113 In 2-unit structures: $83,481
Here: $83,481 State: $444,476 In 3-to-4-unit structures: $55,205
Here: $55,205 State: $457,463 Mobile homes: $106,740
Here: $106,740 State: $119,788
Total population: 1,267 (All urban)
Houses: 1,080 (932 occupied: 870 owner occupied, 66 renter occupied)
| % of renters here: | 7% |
| State: | 35% |
Housing density: 994 houses/condos per square mile
Median price asked for vacant for-sale houses and condos in 2022 in this county: $113,957.
Median gross rent in Cedar Glen West, NJ in 2022: $-649,176,326
Housing units in Cedar Glen West with a mortgage: 117 (15 second mortgage, 0 home equity loan, 0 both second mortgage and home equity loan)
Houses without a mortgage: 0
Median household income for apartments without a mortgage: $53,371
Median monthly housing costs: $442
Compare current foreclosures near Cedar Glen West, NJ:
| Photo | Address | Area | Beds / Baths | Price | Details |
|---|---|---|---|---|---|

|
#1
Sumach St
Browns Mills, NJ 08015
|
1,274 sq. feet
|
1 baths 3 beds |
$299,900
|
show details |

|
#2
Cumberland Dr
Brick, NJ 08723
|
1,512 sq. feet
|
2 baths 3 beds |
show details | |

|
#3
Montana Trl
Browns Mills, NJ 08015
|
1,844 sq. feet
|
2 baths 4 beds |
show details | |

|
#4
Fontana St
Toms River, NJ 08757
|
1,232 sq. feet
|
2 baths 2 beds |
show details | |

|
#5
Beachwood Blvd
Beachwood, NJ 08722
|
2,550 sq. feet
|
3 baths 4 beds |
show details | |

|
#6
Hilltop Dr
Lanoka Harbor, NJ 08734
|
2,076 sq. feet
|
2 baths 4 beds |
show details | |

|
#7
Station Dr
Forked River, NJ 08731
|
1,761 sq. feet
|
3 baths 4 beds |
show details | |

|
#8
Kent Rd
Howell, NJ 07731
|
1,104 sq. feet
|
2 baths 4 beds |
show details | |

|
#9
Forman Ave
Point Pleasant Beach, NJ 08742
|
1,672 sq. feet
|
2 baths 3 beds |
show details | |

|
#10
Jib Cir
Brick, NJ 08723
|
1,580 sq. feet
|
2 baths 4 beds |
show details |
| Photo | Address | Area | Beds / Baths | Price | Details |
|---|---|---|---|---|---|

|
#11
Forest Dr
Lakewood, NJ 08701
|
1,768 sq. feet
|
1 baths 3 beds |
show details | |

|
#12
Heather St
Browns Mills, NJ 08015
|
1,276 sq. feet
|
1 baths 3 beds |
show details | |

|
#13
Baser Ln
Brick, NJ 08724
|
1,021 sq. feet
|
2 baths 2 beds |
show details | |

|
#14
Llewellyn Pkwy
Forked River, NJ 08731
|
1,547 sq. feet
|
2 baths 3 beds |
show details | |

|
#15
Bloomfield Rd
Englishtown, NJ 07726
|
3,053 sq. feet
|
3 baths 4 beds |
show details | |

|
#16
Potter Rd
Freehold, NJ 07728
|
4,062 sq. feet
|
3 baths 5 beds |
show details | |

|
#17
Cedar Swamp Rd
Jackson, NJ 08527
|
1,799 sq. feet
|
3 baths 4 beds |
show details | |

|
#18
Bimini Dr
Toms River, NJ 08757
|
1,124 sq. feet
|
1 baths 2 beds |
show details | |

|
#19
Brookforest Dr
Toms River, NJ 08757
|
1,248 sq. feet
|
2 baths 3 beds |
show details | |

|
#20
Forest Glen Ct
Toms River, NJ 08755
|
3,509 sq. feet
|
4 baths 5 beds |
show details |
| Photo | Address | Area | Beds / Baths | Price | Details |
|---|---|---|---|---|---|

|
#21
Woodlake Manor Dr
Lakewood, NJ 08701
|
1,059 sq. feet
|
1 baths 2 beds |
show details | |

|
#22
Front St
New Egypt, NJ 08533
|
1,224 sq. feet
|
2 baths 3 beds |
show details | |

|
#23
Morris St
Browns Mills, NJ 08015
|
1,236 sq. feet
|
2 baths 3 beds |
show details | |

|
#24
Meadow Run Ct
Jackson, NJ 08527
|
3,040 sq. feet
|
3 baths 4 beds |
show details | |

|
#25
Creamery Ct
Freehold, NJ 07728
|
1,510 sq. feet
|
1 baths 3 beds |
show details | |

|
#26
Pkwy Dr
Freehold, NJ 07728
|
1,262 sq. feet
|
1 baths 2 beds |
show details | |

|
#27
Groendyke Cir
Perrineville, NJ 08535
|
- sq. feet
|
3 baths 6 beds |
show details | |

|
#28
Widgeon Dr
Bayville, NJ 08721
|
1,600 sq. feet
|
2 baths 4 beds |
show details | |

|
#29
Wilkinson Dr
Toms River, NJ 08755
|
2,370 sq. feet
|
2 baths 4 beds |
show details | |

|
#30
Wooddale Ave
Point Pleasant Beach, NJ 08742
|
1,242 sq. feet
|
2 baths 3 beds |
show details |
| Photo | Address | Area | Beds / Baths | Price | Details |
|---|---|---|---|---|---|

|
#31
Primrose Ln
Brick, NJ 08724
|
1,120 sq. feet
|
1 baths 2 beds |
show details | |

|
#32
E Lakeshore Dr
Browns Mills, NJ 08015
|
961 sq. feet
|
1 baths 2 beds |
show details | |

|
#33
Cedar Swamp Rd
Jackson, NJ 08527
|
1,950 sq. feet
|
4 baths 5 beds |
show details | |

|
#34
Chateau Dr
Lakewood, NJ 08701
|
2,630 sq. feet
|
3 baths 5 beds |
show details | |

|
#35
Arrahbella Avenue
Browns Mills, NJ 08015
|
1,472 sq. feet
|
3 baths 3 beds |
show details | |

|
#36
Carter St
Toms River, NJ 08753
|
1,326 sq. feet
|
2 baths 3 beds |
show details | |

|
#37
Admiral Rd
Forked River, NJ 08731
|
990 sq. feet
|
1 baths 2 beds |
show details | |

|
#38
Fort De France Ave
Toms River, NJ 08757
|
1,124 sq. feet
|
1 baths 2 beds |
show details | |

|
#39
Susan Ln
Brielle, NJ 08730
|
- sq. feet
|
2 baths 2 beds |
show details | |

|
#40
Rankin Rd
Brielle, NJ 08730
|
- sq. feet
|
3 baths 4 beds |
show details |
| Photo | Address | Area | Beds / Baths | Price | Details |
|---|---|---|---|---|---|

|
#41
Marble Way
Lakewood, NJ 08701
|
2,652 sq. feet
|
- baths - beds |
show details | |

|
#42
Mccormick Dr
Toms River, NJ 08753
|
2,598 sq. feet
|
- baths - beds |
show details | |

|
#43
Kelm Woods Ave
Lakewood, NJ 08701
|
2,362 sq. feet
|
- baths - beds |
show details | |

|
#44
Bowman Rd
Jackson, NJ 08527
|
1,344 sq. feet
|
- baths - beds |
show details | |

|
#45
Mccormick Dr
Toms River, NJ 08753
|
2,598 sq. feet
|
- baths - beds |
show details | |

|
#46
Turner Rd
Freehold, NJ 07728
|
966 sq. feet
|
- baths 3 beds |
show details | |

|
#47
Lester Rd
Toms River, NJ 08753
|
2,120 sq. feet
|
- baths - beds |
show details | |

|
#48
Tennis Ct
Belmar, NJ 07719
|
1,700 sq. feet
|
- baths 3 beds |
show details | |

|
#49
Briarcliff Dr
Toms River, NJ 08753
|
2,410 sq. feet
|
- baths - beds |
show details | |

|
Check over 1 million property listings on Foreclosure.com!
|
browse all offers | |||


Median year apartment built: 1970
Household type by relationship:
Households: 2,043- Male householders: 377 (49 living alone), Female householders: 573 (240 living alone)
466 spouses (466 opposite-sex spouses), 82 unmarried partners, (82 opposite-sex unmarried partners), 430 children (397 natural, 0 adopted, 32 stepchildren), 64 grandchildren, 0 brothers or sisters, 11 parents, 0 foster children, 19 other relatives, 17 non-relatives
Size of family households: 431 2-persons, 123 3-persons, 70 4-persons, 18 6-persons.
Size of nonfamily households: 268 1-person, 26 2-persons.
0 married couples with children.
197 single-parent households (14 men, 183 women).
61.0% of residents of Cedar Glen West speak English at home.
35.3% of residents speak other Indo-European language at home (65% speak English very well, 20% speak English well, 14% speak English not well, 2% don't speak English at all).
0.6% of residents speak Asian or Pacific Island language at home (100% speak English not well).
Foreign born population: 705 (34.5%)
(90.5% of them are naturalized citizens)
| Here: | 4.5 |
| State: | 6.8 |
| Here: | 5.1 |
| State: | 3.9 |

- Bedrooms in owner-occupied houses and condos in Cedar Glen West, New Jersey
- 0no bedroom
- 2211 bedroom
- 4702 bedrooms
- 1013 bedrooms
- 594 bedrooms
- 195+ bedrooms

- Bedrooms in renter-occupied apartments in Cedar Glen West, New Jersey
- 0no bedroom
- 01 bedroom
- 552 bedrooms
- 123 bedrooms
- 04 bedrooms
- 05+ bedrooms

- Cars and other vehicles available in Cedar Glen West in owner-occupied houses/condos
- 12no vehicle
- 4201 vehicle
- 2962 vehicles
- 1223 vehicles
- 194 vehicles
- 05+ vehicles

- Cars and other vehicles available in Cedar Glen West in renter-occupied apartments
- 0no vehicle
- 291 vehicle
- 372 vehicles
- 03 vehicles
- 04 vehicles
- 05+ vehicles

- Rooms in owner-occupied houses in Cedar Glen West, New Jersey
- 01 room
- 02 rooms
- 363 rooms
- 4154 rooms
- 2235 rooms
- 836 rooms
- 07 rooms
- 568 rooms
- 579+ rooms

- Rooms in renter-occupied apartments in Cedar Glen West, New Jersey
- 01 room
- 02 rooms
- 03 rooms
- 124 rooms
- 415 rooms
- 136 rooms
- 07 rooms
- 08 rooms
- 09+ rooms


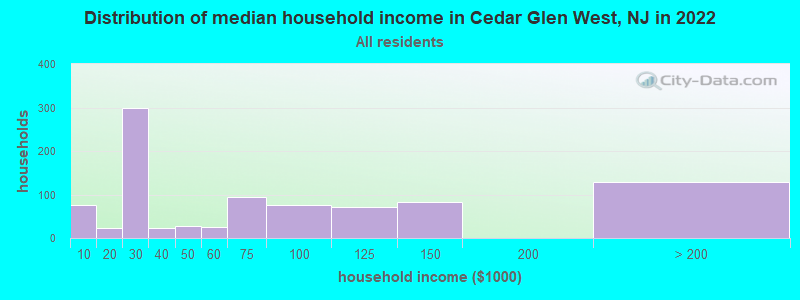
Cedar Glen West, NJ household income distribution

- 77Less than $10,000
- 24$10,000 to $19,999
- 299$20,000 to $29,999
- 24$30,000 to $39,999
- 27$40,000 to $49,999
- 25$50,000 to $59,999
- 95$60,000 to $74,999
- 76$75,000 to $99,999
- 72$100,000 to $124,999
- 83$125,000 to $149,999
- 129$200,000 or more
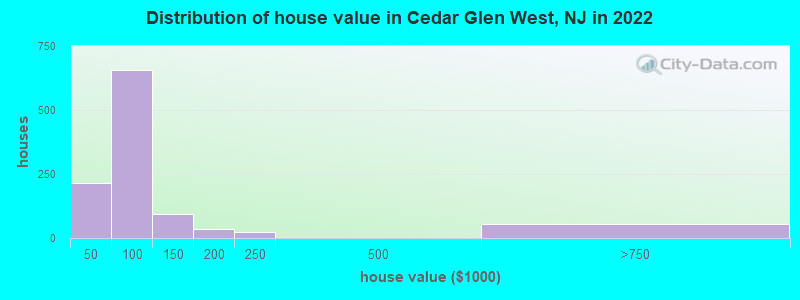
Home value of owner - occupied houses in 2022 in Cedar Glen West, NJ
-
- 8$20,000 to $24,999
- 4$25,000 to $29,999
- 12$30,000 to $34,999
- 20$35,000 to $39,999
- 165$40,000 to $49,999
- 114$50,000 to $59,999
- 118$60,000 to $69,999
- 42$70,000 to $79,999
- 135$80,000 to $89,999
- 78$90,000 to $99,999
- 93$100,000 to $124,999
- 34$150,000 to $174,999
- 22$200,000 to $249,999
- 53$500,000 to $749,999
Rent paid by renters in 2022 in Cedar Glen West, NJ
-
- 21$250 to $299
- 18$500 to $549
- 11$1,500 to $1,999
- 10No cash rent


Percentage of workers working in this county: 67.6%
Number of people working at home: 16 (2.0% of all workers)
Travel time to work (commute)
- Less than 5 minutes: 0
- 5 to 9 minutes: 0
- 10 to 14 minutes: 70
- 15 to 19 minutes: 10
- 20 to 24 minutes: 174
- 25 to 29 minutes: 79
- 30 to 34 minutes: 211
- 35 to 39 minutes: 0
- 40 to 44 minutes: 150
- 45 to 59 minutes: 48
- 60 to 89 minutes: 0
- 90 or more minutes: 21
Means of transportation to work:
- Drove a car alone: 290 (100.0%)

- Unemployment by race in 2022
- Unemployment rate for Black residents
- 35.9%Males
- Unemployment rate for Asian residents
- 100.0%Females
- Unemployment rate for two or more race residents
- 100.0%Females

- Year of entry for the foreign-born population in Cedar Glen West, New Jersey
- 302010 or later
- 2982000 to 2009
- 711990 to 1999
- 01980 to 1989
- 171970 to 1979
- 134Before 1970

First ancestries reported:
- Latvian: 263 (18.8%)
- Romanian: 200 (14.3%)
- Irish: 167 (11.9%)
- Italian: 167 (11.9%)
- Russian: 135 (9.6%)
- Polish: 107 (7.6%)
- German: 73 (5.2%)
- Slovak: 58 (4.1%)
- American: 31 (2.2%)
- Greek: 20 (1.4%)
- Armenian: 12 (0.9%)
- English: 12 (0.9%)
- French Canadian: 12 (0.9%)
- Portuguese: 11 (0.8%)
- Scottish: 11 (0.8%)
- European: 10 (0.7%)
Most common places of birth for foreign-born residents (%):
| Cedar Glen West: | 52.1% (369) |
| New Jersey: | 0.1% (1,789) |
| Cedar Glen West: | 35.6% (252) |
| New Jersey: | 0.1% (2,316) |
| Cedar Glen West: | 16.5% (117) |
| New Jersey: | 0.9% (20,371) |
| Cedar Glen West: | 7.1% (50) |
| New Jersey: | 0.0% (584) |
| Cedar Glen West: | 5.1% (36) |
| New Jersey: | 2.3% (48,811) |
| Cedar Glen West: | 2.1% (15) |
| New Jersey: | 1.5% (33,198) |
| Cedar Glen West: | 1.7% (12) |
| New Jersey: | 3.7% (78,969) |
Place of birth for U.S.-born residents:
- This state: 873
- Other state: 449
- Northeast: 368
- Midwest: 30
- South: 17
- West: 34
99.4% of Cedar Glen West residents lived in the same house 1 years ago.
Out of people who lived in different houses, 41.5% lived in this county.
Out of people who lived in different counties, 0.0% lived in New Jersey.
| Cedar Glen West: | 99.4% |
| State average: | 90.4% |
Education attainment for males 25 years and older:
- No schooling: 0
- Nursery to 4th grade: 0
- 5th and 6th grade: 0
- 7th and 8th grade: 12
- 9th grade: 18
- 10th grade: 0
- 11th grade: 0
- 12th grade, no diploma: 17
- High school graduate (or equivalency): 460
- Less than 1 year of college: 26
- Some college more than 1 year, no degree: 107
- Associate degree: 106
- Bachelor's degree: 18
- Master's degree: 13
- Professional school degree: 40
- Doctorate degree: 0

Education attainment for females 25 years and older:
- No schooling: 0
- Nursery to 4th grade: 0
- 5th and 6th grade: 0
- 7th and 8th grade: 0
- 9th grade: 0
- 10th grade: 30
- 11th grade: 14
- 12th grade, no diploma: 26
- High school graduate (or equivalency): 434
- Less than 1 year of college: 122
- Some college more than 1 year, no degree: 44
- Associate degree: 33
- Bachelor's degree: 168
- Master's degree: 40
- Professional school degree: 15
- Doctorate degree: 0

Housing units in structures:
- One, detached: 119
- One, attached: 183
- Two: 296
- 3 or 4: 257
- Mobile homes: 223
Median worth of mobile homes: $161,348
House/condo owner moved in on average 9 years ago
Renter moved in on average 2 years ago

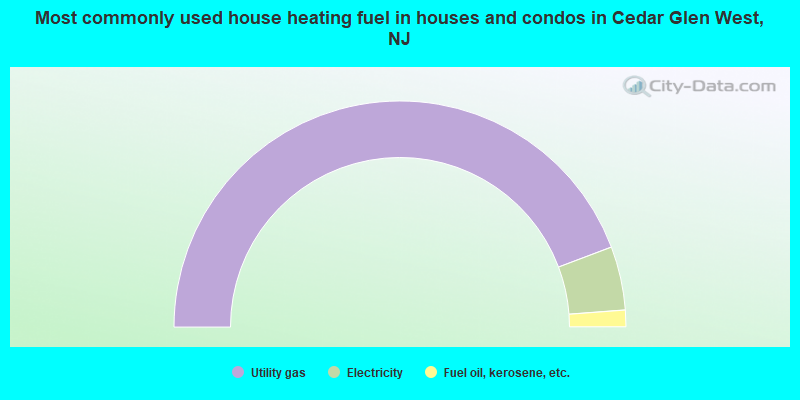
- 88.5%Utility gas
- 9.1%Electricity
- 2.4%Fuel oil, kerosene, etc.
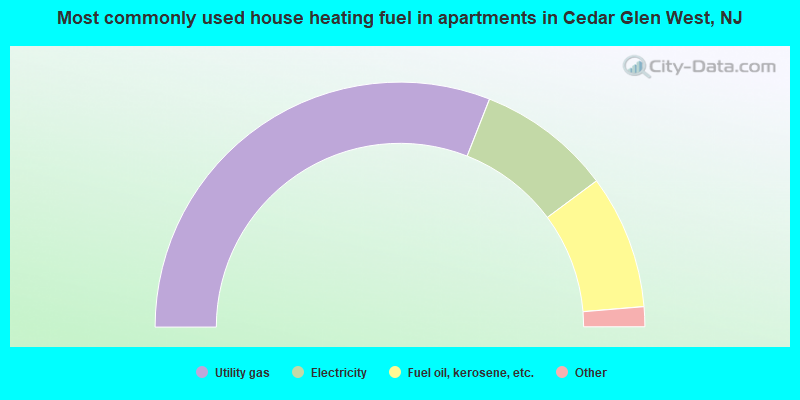
- 63.6%Utility gas
- 18.2%Electricity
- 18.2%Fuel oil, kerosene, etc.
Private vs. public school enrollment:
| Here: | 0.0% |
| New Jersey: | 12.3% |
| Here: | 63.9% |
| New Jersey: | 33.2% |


