Cedarville, NJ (New Jersey) Houses and Residents
| Cedarville: | $171,153 |
| New Jersey: | $428,900 |
Mean price in 2022:
Detached houses: $176,407
Here: $176,407 State: $537,591
Total population: 776 (Urban population: 0, Rural population: 823 (all nonfarm))
Houses: 240 (180 occupied: 135 owner occupied, 52 renter occupied)
| % of renters here: | 28% |
| State: | 35% |
Housing density: 106 houses/condos per square mile
Median price asked for vacant for-sale houses and condos in 2022 in this county: $480,169.
Median contract rent in 2022: $1,009 (lower quartile is $751, upper quartile is $1,453)
Median rent asked for vacant for-rent units in 2022: $1,286
Median gross rent in Cedarville, NJ in 2022: $1,280
Housing units in Cedarville with a mortgage: 82 (4 second mortgage, 0 home equity loan, 3 both second mortgage and home equity loan)
Houses without a mortgage: 0
Compare current foreclosures near Cedarville, NJ:
| Photo | Address | Area | Beds / Baths | Price | Details |
|---|---|---|---|---|---|

|
#1
Sheppard Davis Rd
Cedarville, NJ 08311
|
1,908 sq. feet
|
- baths - beds |
show details | |

|
#2
Main St
Cedarville, NJ 08311
|
1,526 sq. feet
|
- baths - beds |
show details | |

|
#3
Main St
Cedarville, NJ 08311
|
1,526 sq. feet
|
- baths - beds |
show details | |

|
#4
Main St
Cedarville, NJ 08311
|
- sq. feet
|
- baths - beds |
show details | |

|
#5
Maple Ave
Cedarville, NJ 08311
|
1,438 sq. feet
|
- baths - beds |
show details | |

|
#6
North Ave
Cedarville, NJ 08311
|
1,780 sq. feet
|
- baths - beds |
show details | |

|
#7
N Avenue
Cedarville, NJ 08311
|
1,780 sq. feet
|
- baths - beds |
show details | |

|
#8
Schaffer Ave
Cedarville, NJ 08311
|
1,440 sq. feet
|
- baths - beds |
show details | |

|
#9
Main St
Cedarville, NJ 08311
|
1,792 sq. feet
|
- baths - beds |
show details | |

|
#10
Cedar Ln
Elmer, NJ 08318
|
1,512 sq. feet
|
2 baths 4 beds |
$157,500
|
show details |
| Photo | Address | Area | Beds / Baths | Price | Details |
|---|---|---|---|---|---|

|
#11
S 2nd St
Millville, NJ 08332
|
- sq. feet
|
1 baths 2 beds |
$73,500
|
show details |

|
#12
S Valley Ave
Vineland, NJ 08360
|
1,092 sq. feet
|
1 baths 2 beds |
show details | |

|
#13
W Main St
Millville, NJ 08332
|
2,184 sq. feet
|
2 baths 4 beds |
show details | |

|
#14
Smick Rd
Salem, NJ 08079
|
- sq. feet
|
- baths - beds |
$300,000
|
show details |

|
#15
Gooseberry Rd
Millville, NJ 08332
|
1,216 sq. feet
|
- baths - beds |
$39,900
|
show details |

|
#16
Kemble Ave
Millville, NJ 08332
|
1,377 sq. feet
|
1 baths 3 beds |
show details | |

|
#17
Mistle Rd
Millville, NJ 08332
|
1,064 sq. feet
|
2 baths 3 beds |
show details | |

|
#18
Sherwood Dr
Vineland, NJ 08361
|
- sq. feet
|
2 baths 4 beds |
show details | |

|
#19
Coral Ave
Bridgeton, NJ 08302
|
1,196 sq. feet
|
2 baths 3 beds |
show details | |

|
#20
W Chestnut Ave
Vineland, NJ 08360
|
1,191 sq. feet
|
1 baths 2 beds |
show details |
| Photo | Address | Area | Beds / Baths | Price | Details |
|---|---|---|---|---|---|

|
#21
Greenwich Rd
Bridgeton, NJ 08302
|
1,468 sq. feet
|
2 baths 3 beds |
show details | |

|
#22
E Elmer Rd
Vineland, NJ 08361
|
1,144 sq. feet
|
2 baths 2 beds |
show details | |

|
#23
Fairton Rd
Millville, NJ 08332
|
1,270 sq. feet
|
1 baths 3 beds |
show details | |

|
#24
Heritage Dr
Vineland, NJ 08361
|
1,940 sq. feet
|
3 baths 3 beds |
show details | |

|
#25
Kristian Dr
Vineland, NJ 08360
|
2,108 sq. feet
|
3 baths 4 beds |
show details | |

|
#26
E Main St
Millville, NJ 08332
|
2,228 sq. feet
|
2 baths 4 beds |
show details | |

|
#27
W Walnut Rd
Vineland, NJ 08360
|
642 sq. feet
|
1 baths 2 beds |
show details | |

|
#28
Point Breeze Dr
Millville, NJ 08332
|
1,050 sq. feet
|
2 baths 2 beds |
show details | |

|
#29
Division St
Bridgeton, NJ 08302
|
1,006 sq. feet
|
1 baths 3 beds |
show details | |

|
#30
S 4th St
Vineland, NJ 08360
|
- sq. feet
|
2 baths 3 beds |
show details |
| Photo | Address | Area | Beds / Baths | Price | Details |
|---|---|---|---|---|---|

|
#31
Carmel Rd
Millville, NJ 08332
|
2,476 sq. feet
|
3 baths - beds |
show details | |

|
#32
Cedar St
Millville, NJ 08332
|
1,738 sq. feet
|
2 baths - beds |
show details | |

|
#33
Columbine Ave
Millville, NJ 08332
|
1,112 sq. feet
|
1 baths - beds |
show details | |

|
#34
Coventry Way
Millville, NJ 08332
|
1,008 sq. feet
|
1 baths - beds |
show details | |

|
#35
East Ave
Bridgeton, NJ 08302
|
1,344 sq. feet
|
- baths - beds |
show details | |

|
#36
Woodland Ave
Millville, NJ 08332
|
875 sq. feet
|
2 baths - beds |
show details | |

|
#37
E Mcneal St
Millville, NJ 08332
|
1,527 sq. feet
|
1 baths - beds |
show details | |

|
#38
King Ave
Millville, NJ 08332
|
1,196 sq. feet
|
2 baths - beds |
show details | |

|
#39
Hogbin Rd
Millville, NJ 08332
|
1,680 sq. feet
|
2 baths - beds |
show details | |

|
#40
Circle Dr
Millville, NJ 08332
|
1,080 sq. feet
|
1 baths - beds |
show details |
| Photo | Address | Area | Beds / Baths | Price | Details |
|---|---|---|---|---|---|

|
#41
Fairton Rd
Millville, NJ 08332
|
1,097 sq. feet
|
1 baths - beds |
show details | |

|
#42
W Main St
Millville, NJ 08332
|
1,740 sq. feet
|
2 baths - beds |
show details | |

|
#43
Debbie Ln
Millville, NJ 08332
|
1,784 sq. feet
|
3 baths - beds |
show details | |

|
#44
W Main St
Millville, NJ 08332
|
1,428 sq. feet
|
1 baths - beds |
show details | |

|
#45
Fairton Rd
Millville, NJ 08332
|
1,676 sq. feet
|
1 baths - beds |
show details | |

|
#46
Mcdougall Ter
Millville, NJ 08332
|
1,322 sq. feet
|
1 baths - beds |
show details | |

|
#47
Lloyd Ter
Millville, NJ 08332
|
1,623 sq. feet
|
2 baths - beds |
show details | |

|
#48
W Main St
Millville, NJ 08332
|
1,376 sq. feet
|
1 baths - beds |
show details | |

|
#49
Louis Dr
Millville, NJ 08332
|
1,044 sq. feet
|
1 baths - beds |
show details | |

|
Check over 1 million property listings on Foreclosure.com!
|
browse all offers | |||

Latest news about housing in Cedarville, NJ collected exclusively by city-data.com from local newspapers, TV, and radio stations

 | Landlord/tenant law. (23 replies) |
| Atlantic/Cumberland/Cape May towns "missing" from City Data (0 replies) |

Median year apartment built: 1939
Household type by relationship:
Households: 518- Male householders: 106 (25 living alone), Female householders: 70 (11 living alone)
99 spouses (99 opposite-sex spouses), 0 unmarried partners, (0 opposite-sex unmarried partners), 206 children (202 natural, 0 adopted, 4 stepchildren), 4 grandchildren, 7 brothers or sisters, 5 parents, 0 foster children, 0 other relatives, 15 non-relatives
Size of family households: 50 2-persons, 43 3-persons, 28 4-persons, 5 5-persons, 11 6-persons.
Size of nonfamily households: 37 1-person, 8 2-persons.
69 married couples with children.
75 single-parent households (0 men, 75 women).
98.8% of residents of Cedarville speak English at home.
1.2% of residents speak other Indo-European language at home (100% speak English very well).
| Here: | 6.6 |
| State: | 6.8 |
| Here: | 5.0 |
| State: | 3.9 |

- Bedrooms in owner-occupied houses and condos in Cedarville, New Jersey
- 0no bedroom
- 01 bedroom
- 222 bedrooms
- 953 bedrooms
- 194 bedrooms
- 05+ bedrooms

- Bedrooms in renter-occupied apartments in Cedarville, New Jersey
- 0no bedroom
- 51 bedroom
- 82 bedrooms
- 393 bedrooms
- 04 bedrooms
- 05+ bedrooms

- Cars and other vehicles available in Cedarville in owner-occupied houses/condos
- 6no vehicle
- 191 vehicle
- 722 vehicles
- 253 vehicles
- 144 vehicles
- 05+ vehicles

- Cars and other vehicles available in Cedarville in renter-occupied apartments
- 8no vehicle
- 371 vehicle
- 02 vehicles
- 73 vehicles
- 04 vehicles
- 05+ vehicles

- Rooms in owner-occupied houses in Cedarville, New Jersey
- 01 room
- 02 rooms
- 03 rooms
- 04 rooms
- 55 rooms
- 496 rooms
- 317 rooms
- 148 rooms
- 379+ rooms

- Rooms in renter-occupied apartments in Cedarville, New Jersey
- 01 room
- 02 rooms
- 03 rooms
- 144 rooms
- 145 rooms
- 86 rooms
- 97 rooms
- 08 rooms
- 79+ rooms


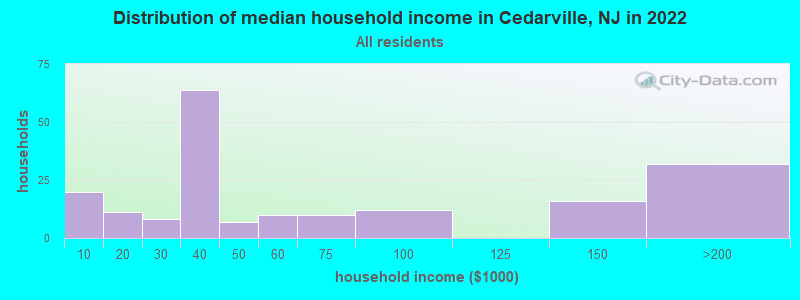
Cedarville, NJ household income distribution

- 20Less than $10,000
- 11$10,000 to $19,999
- 8$20,000 to $29,999
- 64$30,000 to $39,999
- 7$40,000 to $49,999
- 10$50,000 to $59,999
- 10$60,000 to $74,999
- 12$75,000 to $99,999
- 16$125,000 to $149,999
- 32$150,000 to $199,999
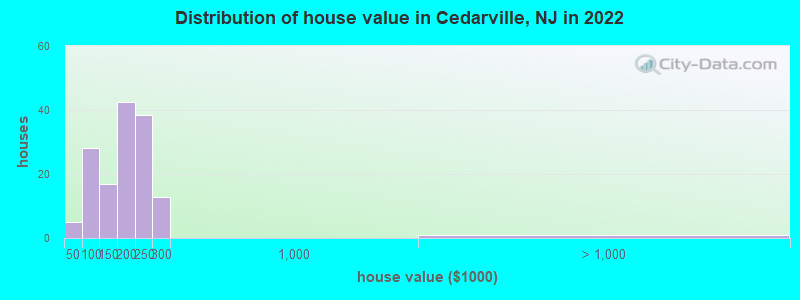
Home value of owner - occupied houses in 2022 in Cedarville, NJ
-
- 4$35,000 to $39,999
- 28$70,000 to $79,999
- 9$100,000 to $124,999
- 7$125,000 to $149,999
- 42$150,000 to $174,999
- 38$200,000 to $249,999
- 12$250,000 to $299,999
- 1$2,000,000 or more
Rent paid by renters in 2022 in Cedarville, NJ
-
- 18$700 to $749
- 5$900 to $999
- 17$1,000 to $1,249
- 5$1,500 to $1,999


Percentage of workers working in this county: 78.2%
Number of people working at home: 0 (0.0% of all workers)
Travel time to work (commute)
- Less than 5 minutes: 3
- 5 to 9 minutes: 8
- 10 to 14 minutes: 20
- 15 to 19 minutes: 70
- 20 to 24 minutes: 5
- 25 to 29 minutes: 13
- 30 to 34 minutes: 41
- 35 to 39 minutes: 0
- 40 to 44 minutes: 0
- 45 to 59 minutes: 10
- 60 to 89 minutes: 0
- 90 or more minutes: 0
Means of transportation to work:
- Drove a car alone: 271 (77.0%)
- Carpooled: 31 (8.8%)
- Bicycle: 10 (2.8%)
- Walked: 12 (3.4%)
- Other means: 19 (5.4%)
- Worked at home: 9 (2.6%)

- Unemployment by race in 2022
- Unemployment rate for White non-Hispanic residents
- 24.7%Males

- Year of entry for the foreign-born population in Cedarville, New Jersey
- 381995 to March 2000
- 121990 to 1994
- 121985 to 1989
- 01980 to 1984
- 01975 to 1979
- 01970 to 1974
- 01965 to 1969
- 3Before 1965

First ancestries reported:
- Italian: 48 (21.8%)
- Irish: 41 (18.7%)
- American: 19 (8.6%)
- German: 18 (8.2%)
- Pennsylvania German: 8 (3.6%)
- English: 6 (2.7%)
- French: 5 (2.3%)
Most common places of birth for foreign-born residents (%):
| Cedarville: | 44.6% (29) |
| New Jersey: | 8.1% (119,497) |
| Cedarville: | 32.3% (21) |
| New Jersey: | 4.6% (67,667) |
| Cedarville: | 18.5% (12) |
| New Jersey: | 3.5% (51,970) |
| Cedarville: | 4.6% (3) |
| New Jersey: | 1.1% (16,333) |
Place of birth for U.S.-born residents:
- This state: 418
- Other state: 86
- Northeast: 63
- Midwest: 0
- South: 8
- West: 23
97.9% of Cedarville residents lived in the same house 1 years ago.
Out of people who lived in different houses, 41.7% lived in this county.
| Cedarville: | 97.9% |
| State average: | 90.4% |
Education attainment for males 25 years and older:
- No schooling: 6
- Nursery to 4th grade: 5
- 5th and 6th grade: 0
- 7th and 8th grade: 0
- 9th grade: 0
- 10th grade: 0
- 11th grade: 9
- 12th grade, no diploma: 1
- High school graduate (or equivalency): 59
- Less than 1 year of college: 21
- Some college more than 1 year, no degree: 11
- Associate degree: 36
- Bachelor's degree: 0
- Master's degree: 0
- Professional school degree: 0
- Doctorate degree: 0

Education attainment for females 25 years and older:
- No schooling: 0
- Nursery to 4th grade: 0
- 5th and 6th grade: 0
- 7th and 8th grade: 1
- 9th grade: 0
- 10th grade: 4
- 11th grade: 0
- 12th grade, no diploma: 0
- High school graduate (or equivalency): 146
- Less than 1 year of college: 0
- Some college more than 1 year, no degree: 20
- Associate degree: 0
- Bachelor's degree: 15
- Master's degree: 13
- Professional school degree: 0
- Doctorate degree: 0


Housing units in structures:
- One, detached: 219
- One, attached: 13
- Two: 8
House/condo owner moved in on average 27 years ago
Renter moved in on average 10 years ago

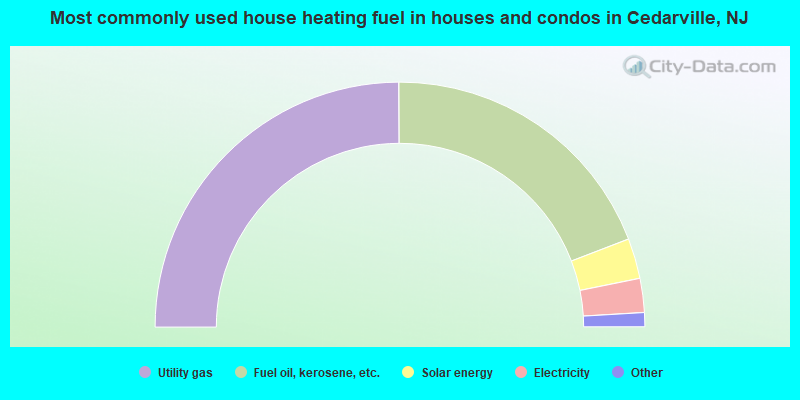
- 50.8%Utility gas
- 39.2%Fuel oil, kerosene, etc.
- 5.4%Solar energy
- 4.6%Electricity
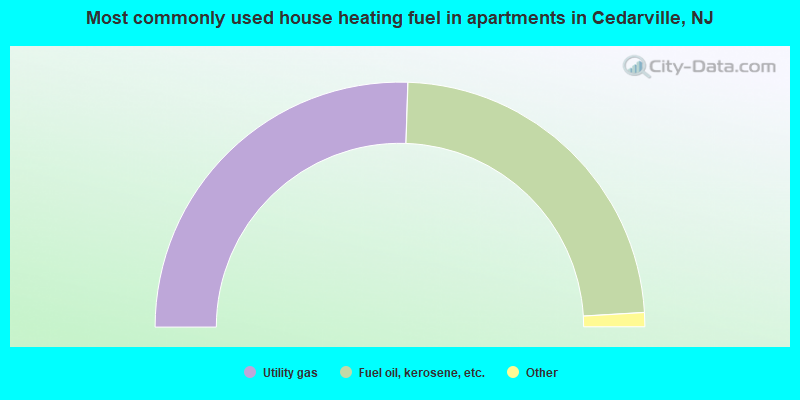
- 52.0%Utility gas
- 48.0%Fuel oil, kerosene, etc.
Private vs. public school enrollment:
| Here: | 0.0% |
| New Jersey: | 12.3% |
| Here: | 0.0% |
| New Jersey: | 13.1% |
| Here: | 52.6% |
| New Jersey: | 33.2% |


