Centerville, TN (Tennessee) Houses and Residents
| Centerville: | $217,312 |
| Tennessee: | $284,800 |
Mean price in 2022:
Detached houses: $240,927
Here: $240,927 State: $374,382
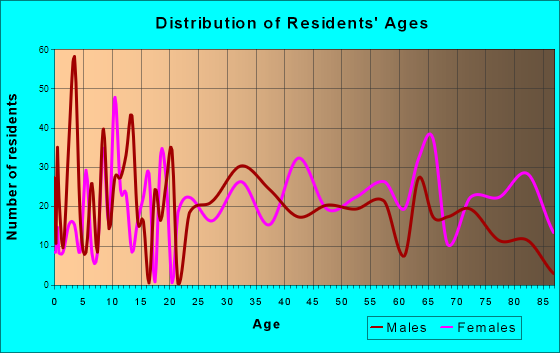
Total population: 3,595 (Urban population: 0, Rural population: 3,732 (32 farm, 3,700 nonfarm))
Houses: 1,683 (1,425 occupied: 838 owner occupied, 612 renter occupied)
| % of renters here: | 42% |
| State: | 33% |
Housing density: 155 houses/condos per square mile
Median price asked for vacant for-sale houses and condos in 2022: $259,880.
Median contract rent in 2022: $634 (lower quartile is $259, upper quartile is $880)
Median rent asked for vacant for-rent units in 2022: $875
Median gross rent in Centerville, TN in 2022: $812
Housing units in Centerville with a mortgage: 496 (27 second mortgage, 0 home equity loan, 27 both second mortgage and home equity loan)
Houses without a mortgage: 0
Median household income for houses/condos with a mortgage: $55,357
Median household income for apartments without a mortgage: $52,579
Median monthly housing costs: $777
Compare current foreclosures near Centerville, TN:
| Photo | Address | Area | Beds / Baths | Price | Details |
|---|---|---|---|---|---|

|
#1
Columbia Ave
Centerville, TN 37033
|
2,116 sq. feet
|
2 baths 4 beds |
show details | |

|
#2
Perry St
Centerville, TN 37033
|
2,709 sq. feet
|
1 baths - beds |
show details | |

|
#3
Grays Bend Rd
Centerville, TN 37033
|
1,494 sq. feet
|
1 baths - beds |
show details | |

|
#4
E Ward St
Centerville, TN 37033
|
1,320 sq. feet
|
1 baths - beds |
show details | |

|
#5
Riverside Dr
Centerville, TN 37033
|
2,099 sq. feet
|
2 baths - beds |
show details | |

|
#6
Highway 100
Centerville, TN 37033
|
- sq. feet
|
- baths - beds |
show details | |

|
#7
Porter St
Centerville, TN 37033
|
- sq. feet
|
- baths - beds |
show details | |

|
#8
Defeated Creek Rd
Centerville, TN 37033
|
- sq. feet
|
- baths - beds |
show details | |

|
#9
White Pine Dr
Centerville, TN 37033
|
- sq. feet
|
- baths - beds |
show details | |

|
#10
Highway 48 S
Centerville, TN 37033
|
- sq. feet
|
- baths - beds |
show details |
| Photo | Address | Area | Beds / Baths | Price | Details |
|---|---|---|---|---|---|

|
#11
Highway 50
Centerville, TN 37033
|
- sq. feet
|
- baths - beds |
show details | |

|
#12
E Point Dr
Centerville, TN 37033
|
- sq. feet
|
- baths - beds |
show details | |

|
#13
Middle School Rd
Centerville, TN 37033
|
- sq. feet
|
- baths - beds |
show details | |

|
#14
Lance Ct
Centerville, TN 37033
|
- sq. feet
|
- baths - beds |
show details | |

|
#15
Honey Hill Dr
Bon Aqua, TN 37025
|
1,620 sq. feet
|
2 baths 3 beds |
show details | |

|
#16
Dodd Holw
Nunnelly, TN 37137
|
3,584 sq. feet
|
3 baths - beds |
show details | |

|
#17
Highway 100
Bon Aqua, TN 37025
|
1,486 sq. feet
|
2 baths - beds |
show details | |

|
#18
Greenfield Bend Rd
Williamsport, TN 38487
|
1,512 sq. feet
|
2 baths - beds |
show details | |

|
#19
Garners Creek Rd
Dickson, TN 37055
|
896 sq. feet
|
1 baths - beds |
show details | |

|
#20
Old Locust Creek Rd
Bon Aqua, TN 37025
|
1,566 sq. feet
|
1 baths - beds |
show details |
| Photo | Address | Area | Beds / Baths | Price | Details |
|---|---|---|---|---|---|

|
#21
Centerville Hwy
Hohenwald, TN 38462
|
850 sq. feet
|
1 baths - beds |
show details | |

|
#22
Martin Branch Rd
Mc Ewen, TN 37101
|
1,983 sq. feet
|
1 baths - beds |
show details | |

|
#23
Indian Creek Rd
Hohenwald, TN 38462
|
1,849 sq. feet
|
2 baths - beds |
show details | |

|
#24
Davis Branch Rd
Bon Aqua, TN 37025
|
936 sq. feet
|
1 baths - beds |
show details | |

|
#25
Crescent Dr
Bon Aqua, TN 37025
|
1,872 sq. feet
|
1 baths - beds |
show details | |

|
#26
Ponderosa St
Hohenwald, TN 38462
|
950 sq. feet
|
1 baths - beds |
show details | |

|
#27
Ridgetop Rd
Hampshire, TN 38461
|
1,200 sq. feet
|
1 baths - beds |
show details | |

|
#28
Hampshire Pike
Hampshire, TN 38461
|
1,484 sq. feet
|
3 baths - beds |
show details | |

|
#29
Urubamba Dr
Lyles, TN 37098
|
1,680 sq. feet
|
2 baths - beds |
show details | |

|
#30
N Oak St
Hohenwald, TN 38462
|
1,007 sq. feet
|
1 baths - beds |
show details |
| Photo | Address | Area | Beds / Baths | Price | Details |
|---|---|---|---|---|---|

|
#31
Community Rd
Nunnelly, TN 37137
|
1,784 sq. feet
|
2 baths - beds |
show details | |

|
#32
Weems Rd
Nunnelly, TN 37137
|
1,008 sq. feet
|
1 baths - beds |
show details | |

|
#33
Woodland Park Cir
Nunnelly, TN 37137
|
1,050 sq. feet
|
1 baths - beds |
show details | |

|
#34
Hackberry Dr
Nunnelly, TN 37137
|
- sq. feet
|
- baths - beds |
show details | |

|
#35
High Meadow Ct
Nunnelly, TN 37137
|
1,680 sq. feet
|
- baths - beds |
show details | |

|
#36
Leipers Creek Rd
Williamsport, TN 38487
|
1,216 sq. feet
|
- baths - beds |
show details | |

|
#37
Gatlyn Ln
Hohenwald, TN 38462
|
- sq. feet
|
- baths - beds |
show details | |

|
#38
Highway 48 N
Nunnelly, TN 37137
|
- sq. feet
|
- baths - beds |
show details | |

|
#39
Falls Branch Rd
Duck River, TN 38454
|
- sq. feet
|
- baths - beds |
show details | |

|
#40
Tidwell Switch Rd
Dickson, TN 37055
|
- sq. feet
|
- baths - beds |
show details |
| Photo | Address | Area | Beds / Baths | Price | Details |
|---|---|---|---|---|---|

|
#41
Old State Rd
Hampshire, TN 38461
|
- sq. feet
|
- baths - beds |
show details | |

|
#42
Kimmins St
Hohenwald, TN 38462
|
- sq. feet
|
- baths - beds |
show details | |

|
#43
Tracy Ln
Duck River, TN 38454
|
- sq. feet
|
- baths - beds |
show details | |

|
#44
Hinson St
Hohenwald, TN 38462
|
1,680 sq. feet
|
- baths - beds |
show details | |

|
#45
Caroline Ln
Dickson, TN 37055
|
- sq. feet
|
- baths - beds |
show details | |

|
#46
Moss Hill Dr
Nunnelly, TN 37137
|
- sq. feet
|
- baths - beds |
show details | |

|
#47
Abiff Rd
Bon Aqua, TN 37025
|
1,216 sq. feet
|
- baths - beds |
show details | |

|
#48
S Bear Creek Rd
Dickson, TN 37055
|
784 sq. feet
|
- baths - beds |
show details | |

|
#49
Anna Jo Rd
Lyles, TN 37098
|
1,216 sq. feet
|
- baths - beds |
show details | |

|
Check over 1 million property listings on Foreclosure.com!
|
browse all offers | |||

Latest news about housing in Centerville, TN collected exclusively by city-data.com from local newspapers, TV, and radio stations

 | Relocating to Centerville (1 reply) |
| Nice towns within 1 hour of Blair School of Music (16 replies) |
| Columbia area towns? (20 replies) |
| Realtor recommendations for rural areas? (1 reply) |
| Needing rental home in Franklin area (4 replies) |
| Hi relocating to possibly Liberty Tennessee, McEwen area or Lynchburg. (16 replies) |
Median year apartment built: 1975
Household type by relationship:
Households: 3,579- Male householders: 783 (203 living alone), Female householders: 625 (206 living alone)
658 spouses (658 opposite-sex spouses), 53 unmarried partners, (53 opposite-sex unmarried partners), 940 children (736 natural, 50 adopted, 152 stepchildren), 80 grandchildren, 21 brothers or sisters, 71 parents, 0 foster children, 63 other relatives, 51 non-relatives
- In group quarters: 230
Size of family households: 576 2-persons, 122 3-persons, 151 4-persons, 73 5-persons, 37 6-persons, 16 7-or-more-persons.
Size of nonfamily households: 417 1-person, 51 2-persons.
490 married couples with children.
76 single-parent households (11 men, 65 women).
99.8% of residents of Centerville speak English at home.
0.2% of residents speak Spanish at home (100% speak English well).
Foreign born population: 6 (0.2%)
(100.0% of them are naturalized citizens)
| Here: | 6.1 |
| State: | 6.5 |
| Here: | 4.0 |
| State: | 4.4 |

- Bedrooms in owner-occupied houses and condos in Centerville, Tennessee
- 0no bedroom
- 01 bedroom
- 2082 bedrooms
- 4303 bedrooms
- 1924 bedrooms
- 85+ bedrooms

- Bedrooms in renter-occupied apartments in Centerville, Tennessee
- 5no bedroom
- 2261 bedroom
- 852 bedrooms
- 2553 bedrooms
- 364 bedrooms
- 65+ bedrooms

- Cars and other vehicles available in Centerville in owner-occupied houses/condos
- 13no vehicle
- 1811 vehicle
- 3502 vehicles
- 1703 vehicles
- 834 vehicles
- 415+ vehicles

- Cars and other vehicles available in Centerville in renter-occupied apartments
- 63no vehicle
- 2711 vehicle
- 1652 vehicles
- 913 vehicles
- 234 vehicles
- 05+ vehicles

- Rooms in owner-occupied houses in Centerville, Tennessee
- 01 room
- 02 rooms
- 73 rooms
- 804 rooms
- 1935 rooms
- 2336 rooms
- 1247 rooms
- 1118 rooms
- 909+ rooms

- Rooms in renter-occupied apartments in Centerville, Tennessee
- 01 room
- 1082 rooms
- 1353 rooms
- 1054 rooms
- 1515 rooms
- 886 rooms
- 07 rooms
- 108 rooms
- 159+ rooms


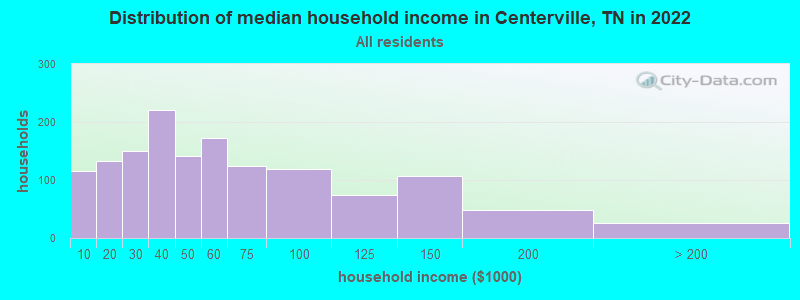
Centerville, TN household income distribution

- 115Less than $10,000
- 133$10,000 to $19,999
- 150$20,000 to $29,999
- 221$30,000 to $39,999
- 141$40,000 to $49,999
- 173$50,000 to $59,999
- 125$60,000 to $74,999
- 119$75,000 to $99,999
- 75$100,000 to $124,999
- 107$125,000 to $149,999
- 49$150,000 to $199,999
- 26$200,000 or more
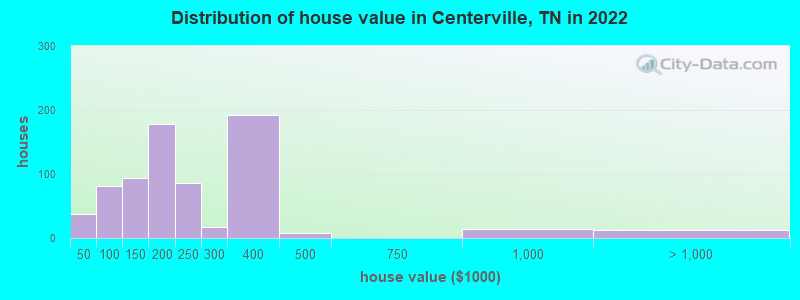
Home value of owner - occupied houses in 2022 in Centerville, TN
-
- 5$15,000 to $19,999
- 20$20,000 to $24,999
- 13$30,000 to $34,999
- 28$50,000 to $59,999
- 14$70,000 to $79,999
- 9$80,000 to $89,999
- 28$90,000 to $99,999
- 30$100,000 to $124,999
- 62$125,000 to $149,999
- 87$150,000 to $174,999
- 90$175,000 to $199,999
- 85$200,000 to $249,999
- 16$250,000 to $299,999
- 191$300,000 to $399,999
- 8$400,000 to $499,999
- 14$750,000 to $999,999
- 13$2,000,000 or more
Rent paid by renters in 2022 in Centerville, TN
-
- 38$100 to $149
- 7$150 to $199
- 111$200 to $249
- 10$250 to $299
- 11$300 to $349
- 13$400 to $449
- 72$500 to $549
- 27$550 to $599
- 39$600 to $649
- 30$700 to $749
- 49$750 to $799
- 64$800 to $899
- 66$900 to $999
- 21$1,000 to $1,249
- 13$1,500 to $1,999
- 14No cash rent


Percentage of workers working in this county: 52.2%
Number of people working at home: 122 (9.5% of all workers)
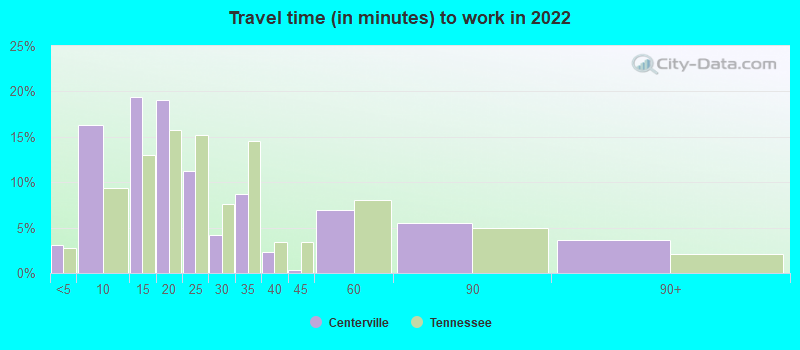
Travel time to work (commute)
- Less than 5 minutes: 65
- 5 to 9 minutes: 117
- 10 to 14 minutes: 174
- 15 to 19 minutes: 108
- 20 to 24 minutes: 16
- 25 to 29 minutes: 0
- 30 to 34 minutes: 97
- 35 to 39 minutes: 5
- 40 to 44 minutes: 21
- 45 to 59 minutes: 174
- 60 to 89 minutes: 311
- 90 or more minutes: 50
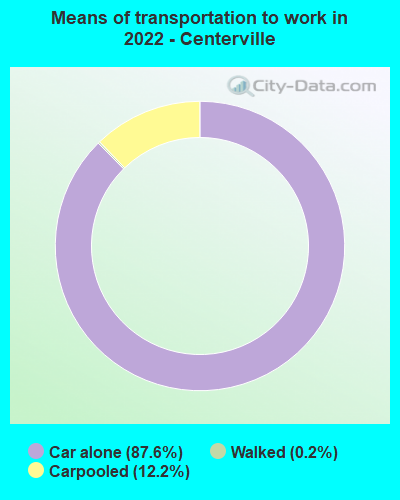
Means of transportation to work:
- Drove a car alone: 1,686 (79.9%)
- Carpooled: 249 (11.8%)
- Walked: 3 (0.1%)
- Worked at home: 122 (5.8%)

- Unemployment by race in 2022
- Unemployment rate for White non-Hispanic residents
- 3.0%Males
- 3.4%Females
- Unemployment rate for American Indian and Alaska Native residents
- 100.0%Females

- Year of entry for the foreign-born population in Centerville, Tennessee
- 02010 or later
- 62000 to 2009
- 01990 to 1999
- 01980 to 1989
- 01970 to 1979
- 11Before 1970

First ancestries reported:
- American: 711 (40.0%)
- English: 563 (31.7%)
- European: 57 (3.2%)
- Italian: 56 (3.1%)
- German: 46 (2.6%)
- Irish: 45 (2.5%)
- Scottish: 28 (1.6%)
- Scotch-Irish: 10 (0.6%)
- British: 6 (0.3%)
Most common places of birth for foreign-born residents (%):
| Centerville: | 83.3% (5) |
| Tennessee: | 1.0% (3,809) |
Place of birth for U.S.-born residents:
- This state: 2,604
- Other state: 909
- Northeast: 205
- Midwest: 190
- South: 286
- West: 244
82.0% of Centerville residents lived in the same house 1 years ago.
Out of people who lived in different houses, 37.0% lived in this county.
Out of people who lived in different counties, 53.8% lived in Tennessee.
| Centerville: | 82.0% |
| State average: | 87.0% |
Education attainment for males 25 years and older:
- No schooling: 10
- Nursery to 4th grade: 34
- 5th and 6th grade: 44
- 7th and 8th grade: 90
- 9th grade: 2
- 10th grade: 22
- 11th grade: 20
- 12th grade, no diploma: 9
- High school graduate (or equivalency): 636
- Less than 1 year of college: 62
- Some college more than 1 year, no degree: 151
- Associate degree: 182
- Bachelor's degree: 72
- Master's degree: 31
- Professional school degree: 2
- Doctorate degree: 0

Education attainment for females 25 years and older:
- No schooling: 6
- Nursery to 4th grade: 0
- 5th and 6th grade: 31
- 7th and 8th grade: 27
- 9th grade: 44
- 10th grade: 33
- 11th grade: 34
- 12th grade, no diploma: 19
- High school graduate (or equivalency): 517
- Less than 1 year of college: 66
- Some college more than 1 year, no degree: 116
- Associate degree: 217
- Bachelor's degree: 109
- Master's degree: 59
- Professional school degree: 0
- Doctorate degree: 2

Housing units in structures:
- One, detached: 1,333
- Two: 20
- 3 or 4: 115
- 5 to 9: 18
- 10 to 19: 15
- 20 to 49: 25
- 50 or more: 73
- Mobile homes: 75
- Boats, RVs, vans, etc.: 5
House/condo owner moved in on average 13 years ago
Renter moved in on average 5 years ago

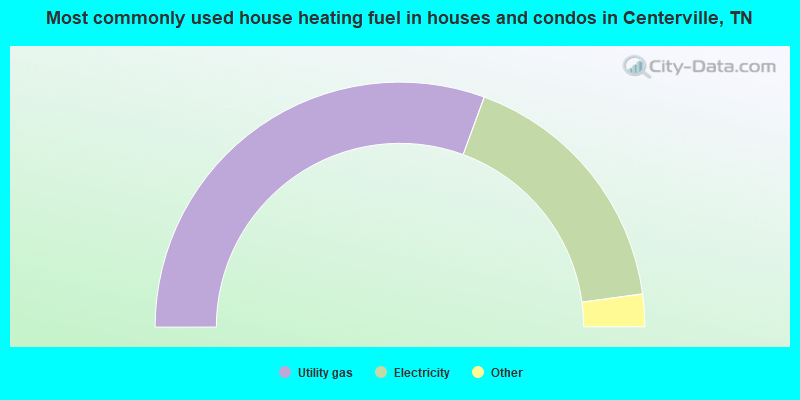
- 61.2%Utility gas
- 34.5%Electricity
- 2.0%Bottled, tank, or LP gas
- 1.3%No fuel used
- 1.0%Wood
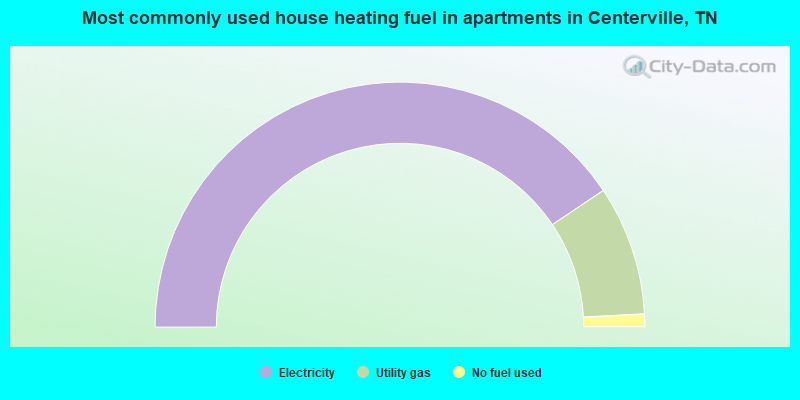
- 81.2%Electricity
- 17.1%Utility gas
- 1.7%No fuel used
Private vs. public school enrollment:
| Here: | 8.6% |
| Tennessee: | 15.0% |
| Here: | 0.0% |
| Tennessee: | 16.2% |
| Here: | 18.1% |
| Tennessee: | 23.5% |


