Central Falls, RI (Rhode Island) Houses and Residents
| Central Falls: | $283,486 |
| Rhode Island: | $383,900 |
Mean price in 2022:
Detached houses: $265,757
Here: $265,757 State: $445,354 Townhouses or other attached units: $269,572
Here: $269,572 State: $371,092 In 2-unit structures: $317,090
Here: $317,090 State: $317,098 In 3-to-4-unit structures: $271,896
Here: $271,896 State: $315,052 In 5-or-more-unit structures: $228,905
Here: $228,905 State: $291,252
Total population: 19,328 (Urban population: 18,928, Rural population: 0)
Houses: 8,317 (7,394 occupied: 1,988 owner occupied, 5,655 renter occupied)
| % of renters here: | 74% |
| State: | 37% |
Housing density: 6,878 houses/condos per square mile
Median price asked for vacant for-sale houses and condos in 2022: $233,633.
Median contract rent in 2022: $968 (lower quartile is $685, upper quartile is $1,205)
Median rent asked for vacant for-rent units in 2022: $579
Median gross rent in Central Falls, RI in 2022: $1,129
Housing units in Central Falls with a mortgage: 1,200 (76 second mortgage, 0 home equity loan, 67 both second mortgage and home equity loan)
Houses without a mortgage: 32
Median household income for houses/condos with a mortgage: $76,556
Median household income for apartments without a mortgage: $59,403
Median monthly housing costs: $1,109
Compare current foreclosures near Central Falls, RI:
| Photo | Address | Area | Beds / Baths | Price | Details |
|---|---|---|---|---|---|

|
#1
Worth St
Central Falls, RI 02863
|
2,352 sq. feet
|
2 baths 6 beds |
show details | |

|
#2
Jenks St # 3
Central Falls, RI 02863
|
- sq. feet
|
- baths - beds |
show details | |

|
#3
Washington St
Central Falls, RI 02863
|
- sq. feet
|
- baths - beds |
show details | |

|
#4
Hebron Ave
Attleboro, MA 02703
|
2,939 sq. feet
|
4 baths 6 beds |
$559,900
|
show details |

|
#5
Mount Pleasant Rd
Harrisville, RI 02830
|
1,232 sq. feet
|
1 baths 3 beds |
$449,900
|
show details |

|
#6
Loomis St
North Attleboro, MA 02760
|
2,294 sq. feet
|
2 baths 4 beds |
$700,000
|
show details |

|
#7
Horton St
North Dighton, MA 02764
|
816 sq. feet
|
1 baths 2 beds |
$259,900
|
show details |

|
#8
Cook Rd
Cumberland, RI 02864
|
2,050 sq. feet
|
2 baths 4 beds |
$749,500
|
show details |

|
#9
Somerset Ave
Taunton, MA 02780
|
3,196 sq. feet
|
3 baths 4 beds |
$754,900
|
show details |

|
#10
Whittier Ave
Providence, RI 02909
|
3 sq. feet
|
3 baths 6 beds |
$109,900
|
show details |
| Photo | Address | Area | Beds / Baths | Price | Details |
|---|---|---|---|---|---|

|
#11
Putnam Pike
Greenville, RI 02828
|
1,114 sq. feet
|
1 baths 2 beds |
show details | |

|
#12
Cynthia Dr Apt 13
North Providence, RI 02911
|
768 sq. feet
|
1 baths 2 beds |
show details | |

|
#13
Pinnery Ave
Warwick, RI 02886
|
1,299 sq. feet
|
1 baths 3 beds |
show details | |

|
#14
Pridemark Ln
Attleboro, MA 02703
|
1,340 sq. feet
|
1 baths 2 beds |
show details | |

|
#15
Bracken St
Cranston, RI 02920
|
1,248 sq. feet
|
1 baths 4 beds |
show details | |

|
#16
Knotty Oak Rd
Coventry, RI 02816
|
1,080 sq. feet
|
1 baths 2 beds |
show details | |

|
#17
Valley Green Court
Providence, RI 02904
|
1,440 sq. feet
|
3 baths 2 beds |
show details | |

|
#18
Chace Ave
Warren, RI 02885
|
1,224 sq. feet
|
1 baths 2 beds |
show details | |

|
#19
Van Zandt Ave
Warwick, RI 02889
|
800 sq. feet
|
1 baths 4 beds |
show details | |

|
#20
Depot St
North Attleboro, MA 02760
|
- sq. feet
|
2 baths 3 beds |
show details |
| Photo | Address | Area | Beds / Baths | Price | Details |
|---|---|---|---|---|---|

|
#21
Atwood Ave
Johnston, RI 02919
|
1,792 sq. feet
|
2 baths 4 beds |
show details | |

|
#22
What Cheer Ave
Providence, RI 02909
|
2,280 sq. feet
|
2 baths 3 beds |
show details | |

|
#23
Atwood Ave
Johnston, RI 02919
|
1,792 sq. feet
|
1 baths 4 beds |
show details | |

|
#24
Maxwell St
Taunton, MA 02780
|
1,537 sq. feet
|
2 baths 5 beds |
show details | |

|
#25
Lisa Ln
Bristol, RI 02809
|
1,658 sq. feet
|
2 baths 3 beds |
show details | |

|
#26
Guertin St
West Warwick, RI 02893
|
1,338 sq. feet
|
2 baths 4 beds |
show details | |

|
#27
Blanding Ave
East Providence, RI 02914
|
1,165 sq. feet
|
1 baths 3 beds |
show details | |

|
#28
Follett St
East Providence, RI 02914
|
1,584 sq. feet
|
2 baths 4 beds |
show details | |

|
#29
Branch Ave
Providence, RI 02904
|
2,921 sq. feet
|
4 baths 6 beds |
show details | |

|
#30
Snake Hill Rd
North Scituate, RI 02857
|
864 sq. feet
|
2 baths 2 beds |
show details |
| Photo | Address | Area | Beds / Baths | Price | Details |
|---|---|---|---|---|---|

|
#31
Thacher St
Attleboro, MA 02703
|
1,040 sq. feet
|
1 baths 3 beds |
show details | |

|
#32
Lewis St
Dighton, MA 02715
|
3,144 sq. feet
|
2 baths 3 beds |
show details | |

|
#33
Verndale St
Warwick, RI 02889
|
1,206 sq. feet
|
1 baths 2 beds |
show details | |

|
#34
Marion Avenue
Providence, RI 02905
|
1,252 sq. feet
|
1 baths 3 beds |
show details | |

|
#35
Tyndall Ave
Providence, RI 02908
|
1,523 sq. feet
|
1 baths 4 beds |
show details | |

|
#36
N Main St
Pascoag, RI 02859
|
- sq. feet
|
- baths - beds |
$100,000
|
show details |

|
#37
Claremont Avenue A/k/a 5 Claremont Avenue
Bristol, RI 02809
|
1,852 sq. feet
|
2 baths 2 beds |
show details | |

|
#38
Mill St
Foxboro, MA 02035
|
1,584 sq. feet
|
2 baths 3 beds |
show details | |

|
#39
Woburn St
Cranston, RI 02910
|
1,212 sq. feet
|
1 baths 4 beds |
show details | |

|
#40
Spooner Ave
Warwick, RI 02886
|
1,777 sq. feet
|
2 baths 4 beds |
show details |
| Photo | Address | Area | Beds / Baths | Price | Details |
|---|---|---|---|---|---|

|
#41
Hazard Ave
Warwick, RI 02889
|
1,017 sq. feet
|
1 baths 3 beds |
show details | |

|
#42
Mount Hope St
North Attleboro, MA 02760
|
3,554 sq. feet
|
2 baths 4 beds |
show details | |

|
#43
Cedar Swamp Rd
Warwick, RI 02889
|
804 sq. feet
|
2 baths 3 beds |
show details | |

|
#44
Arbor Way
Taunton, MA 02780
|
2,614 sq. feet
|
2 baths 4 beds |
show details | |

|
#45
Lakeshore Dr
Bellingham, MA 02019
|
2,044 sq. feet
|
2 baths 3 beds |
show details | |

|
#46
Williams St
Dighton, MA 02715
|
1,732 sq. feet
|
1 baths 3 beds |
show details | |

|
#47
Indian Trl
Taunton, MA 02780
|
1,166 sq. feet
|
1 baths 3 beds |
show details | |

|
#48
Johnson Dr
Norton, MA 02766
|
2,128 sq. feet
|
1 baths 4 beds |
show details | |

|
#49
Sefton Ave
Warwick, RI 02889
|
1,008 sq. feet
|
1 baths 3 beds |
show details | |

|
Check over 1 million property listings on Foreclosure.com!
|
browse all offers | |||


 | 2-month-old found dead in the Festival Field Housing Projects in Newport's North End (86 replies) |
| Rhode Island Housing Crisis? (51 replies) |
| RI Real Estate in huge demand (147 replies) |
| Boston (more than ever) Drives RI's housing market - Up (239 replies) |
| Man shot in Central Falls (5 replies) |
| Rhode Island residential real estate on fire. Up 12%+ over last year. (59 replies) |
Median year apartment built: 1946
Household type by relationship:
Households: 22,335- Male householders: 3,585 (903 living alone), Female householders: 3,765 (910 living alone)
2,903 spouses (2,867 opposite-sex spouses), 866 unmarried partners, (851 opposite-sex unmarried partners), 8,334 children (7,898 natural, 140 adopted, 294 stepchildren), 427 grandchildren, 310 brothers or sisters, 271 parents, 0 foster children, 550 other relatives, 651 non-relatives
- In group quarters: 669
Size of family households: 1,783 2-persons, 1,017 3-persons, 1,076 4-persons, 679 5-persons, 542 6-persons, 58 7-or-more-persons.
Size of nonfamily households: 1,938 1-person, 482 2-persons, 40 3-persons.
3,512 married couples with children.
2,182 single-parent households (997 men, 1,185 women).
30.2% of residents of Central Falls speak English at home.
59.9% of residents speak Spanish at home (51% speak English very well, 21% speak English well, 18% speak English not well, 11% don't speak English at all).
8.8% of residents speak other Indo-European language at home (55% speak English very well, 32% speak English well, 7% speak English not well, 7% don't speak English at all).
0.1% of residents speak Asian or Pacific Island language at home (100% speak English well).
0.2% of residents speak other language at home (100% speak English well).
Foreign born population: 8,943 (40.0%)
(33.2% of them are naturalized citizens)
| Here: | 6.1 |
| State: | 6.2 |
| Here: | 4.6 |
| State: | 4.1 |

- Bedrooms in owner-occupied houses and condos in Central Falls, Rhode Island
- 0no bedroom
- 1081 bedroom
- 4782 bedrooms
- 1,0103 bedrooms
- 3354 bedrooms
- 585+ bedrooms

- Bedrooms in renter-occupied apartments in Central Falls, Rhode Island
- 111no bedroom
- 1,3501 bedroom
- 1,9182 bedrooms
- 2,1273 bedrooms
- 1254 bedrooms
- 265+ bedrooms

- Cars and other vehicles available in Central Falls in owner-occupied houses/condos
- 220no vehicle
- 5031 vehicle
- 8532 vehicles
- 2743 vehicles
- 1234 vehicles
- 165+ vehicles

- Cars and other vehicles available in Central Falls in renter-occupied apartments
- 1,765no vehicle
- 2,4721 vehicle
- 9942 vehicles
- 3653 vehicles
- 604 vehicles
- 05+ vehicles

- Rooms in owner-occupied houses in Central Falls, Rhode Island
- 01 room
- 02 rooms
- 523 rooms
- 2124 rooms
- 3905 rooms
- 5786 rooms
- 3647 rooms
- 2628 rooms
- 1329+ rooms

- Rooms in renter-occupied apartments in Central Falls, Rhode Island
- 1111 room
- 4242 rooms
- 9723 rooms
- 1,1704 rooms
- 1,5195 rooms
- 1,1036 rooms
- 1837 rooms
- 1278 rooms
- 479+ rooms


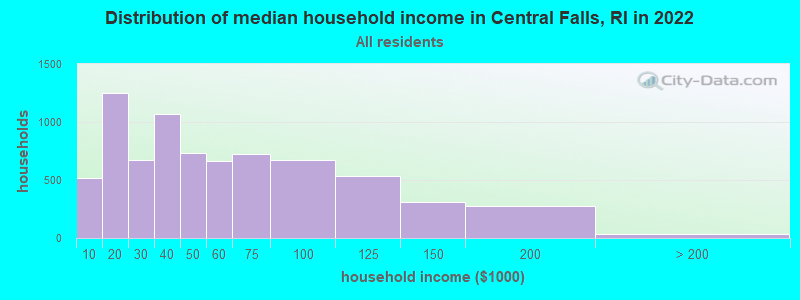
Central Falls, RI household income distribution

- 519Less than $10,000
- 1,252$10,000 to $19,999
- 676$20,000 to $29,999
- 1,068$30,000 to $39,999
- 734$40,000 to $49,999
- 665$50,000 to $59,999
- 721$60,000 to $74,999
- 672$75,000 to $99,999
- 531$100,000 to $124,999
- 313$125,000 to $149,999
- 272$150,000 to $199,999
- 35$200,000 or more
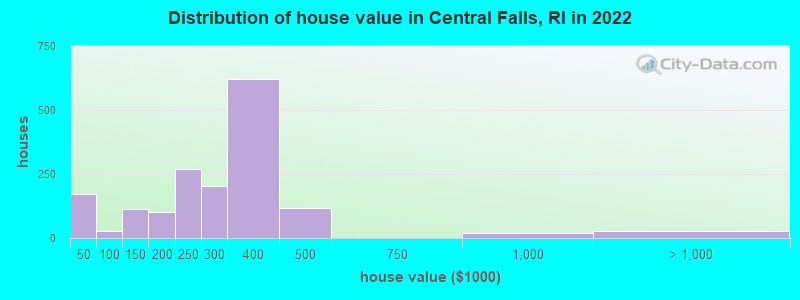
Home value of owner - occupied houses in 2022 in Central Falls, RI
-
- 141Less than $10,000
- 12$10,000 to $14,999
- 2$15,000 to $19,999
- 16$30,000 to $34,999
- 26$70,000 to $79,999
- 8$100,000 to $124,999
- 104$125,000 to $149,999
- 44$150,000 to $174,999
- 54$175,000 to $199,999
- 270$200,000 to $249,999
- 202$250,000 to $299,999
- 620$300,000 to $399,999
- 118$400,000 to $499,999
- 18$750,000 to $999,999
- 27$1,000,000 to $1,499,999
Rent paid by renters in 2022 in Central Falls, RI
-
- 30$100 to $149
- 46$200 to $249
- 232$250 to $299
- 179$300 to $349
- 25$350 to $399
- 111$400 to $449
- 169$450 to $499
- 15$500 to $549
- 76$550 to $599
- 167$600 to $649
- 229$650 to $699
- 220$700 to $749
- 247$750 to $799
- 723$800 to $899
- 558$900 to $999
- 906$1,000 to $1,249
- 608$1,250 to $1,499
- 428$1,500 to $1,999
- 96No cash rent


Percentage of workers working in this county: 66.8%
Number of people working at home: 438 (4.6% of all workers)
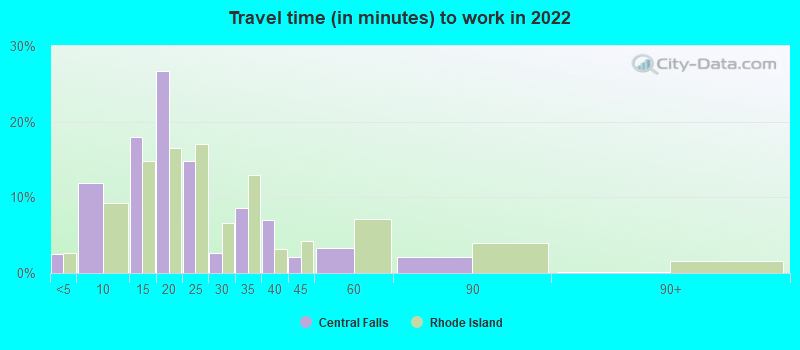
Travel time to work (commute)
- Less than 5 minutes: 261
- 5 to 9 minutes: 609
- 10 to 14 minutes: 1,087
- 15 to 19 minutes: 1,599
- 20 to 24 minutes: 1,559
- 25 to 29 minutes: 524
- 30 to 34 minutes: 1,263
- 35 to 39 minutes: 432
- 40 to 44 minutes: 316
- 45 to 59 minutes: 684
- 60 to 89 minutes: 356
- 90 or more minutes: 87
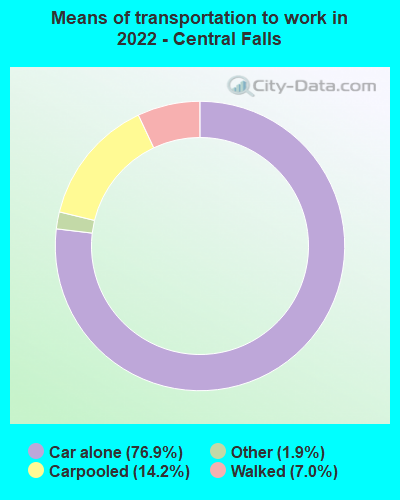
Means of transportation to work:
- Drove a car alone: 2,511 (66.2%)
- Carpooled: 515 (13.6%)
- Taxi: 102 (2.7%)
- Walked: 257 (6.8%)
- Worked at home: 438 (11.6%)

- Unemployment by race in 2022
- Unemployment rate for White non-Hispanic residents
- 2.8%Males
- 4.3%Females
- Unemployment rate for Black residents
- 21.9%Females
- Unemployment rate for other race residents
- 5.6%Males
- 3.0%Females
- Unemployment rate for two or more race residents
- 12.0%Males
- 6.4%Females
- Unemployment rate for Hispanic or Latino residents
- 5.7%Males
- 7.4%Females

- Year of entry for the foreign-born population in Central Falls, Rhode Island
- 3,5062010 or later
- 2,6142000 to 2009
- 1,7001990 to 1999
- 1,8741980 to 1989
- 1,0331970 to 1979
- 489Before 1970
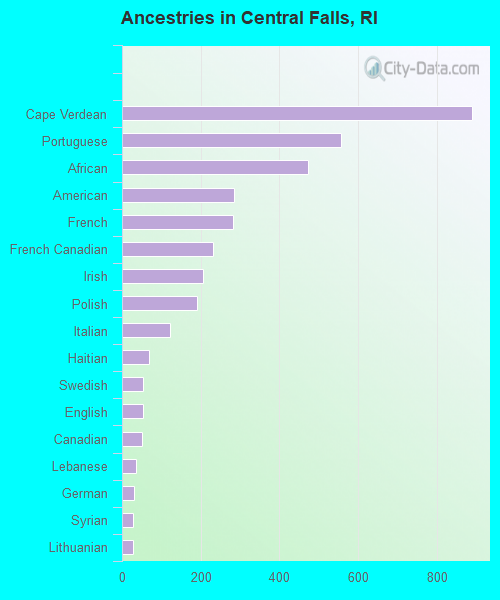
First ancestries reported:
- Cape Verdean: 889 (6.0%)
- Portuguese: 558 (3.8%)
- African: 474 (3.2%)
- American: 286 (1.9%)
- French: 282 (1.9%)
- French Canadian: 231 (1.6%)
- Irish: 206 (1.4%)
- Polish: 191 (1.3%)
- Italian: 122 (0.8%)
- Haitian: 68 (0.5%)
- Swedish: 54 (0.4%)
- English: 53 (0.4%)
- Canadian: 50 (0.3%)
- Lebanese: 36 (0.2%)
- German: 30 (0.2%)
- Syrian: 29 (0.2%)
- Lithuanian: 29 (0.2%)
- Arab: 8 (0.05%)
- Armenian: 2 (0.01%)
Most common places of birth for foreign-born residents (%):
| Central Falls: | 36.0% (3,239) |
| Rhode Island: | 10.4% (16,385) |
| Central Falls: | 17.1% (1,537) |
| Rhode Island: | 4.1% (6,520) |
| Central Falls: | 11.3% (1,012) |
| Rhode Island: | 1.7% (2,654) |
| Central Falls: | 10.1% (907) |
| Rhode Island: | 21.0% (33,163) |
| Central Falls: | 9.5% (857) |
| Rhode Island: | 5.1% (8,042) |
| Central Falls: | 7.5% (674) |
| Rhode Island: | 2.4% (3,836) |
| Central Falls: | 3.1% (279) |
| Rhode Island: | 10.0% (15,766) |
| Central Falls: | 2.0% (177) |
| Rhode Island: | 0.6% (895) |
| Central Falls: | 1.6% (145) |
| Rhode Island: | 0.5% (756) |
Place of birth for U.S.-born residents:
- This state: 8,239
- Other state: 3,284
- Northeast: 2,606
- Midwest: 175
- South: 264
- West: 246
78.6% of Central Falls residents lived in the same house 1 years ago.
Out of people who lived in different houses, 34.3% lived in this county.
Out of people who lived in different counties, 6.6% lived in Rhode Island.
| Central Falls: | 78.6% |
| State average: | 89.3% |
Education attainment for males 25 years and older:
- No schooling: 499
- Nursery to 4th grade: 343
- 5th and 6th grade: 442
- 7th and 8th grade: 230
- 9th grade: 258
- 10th grade: 158
- 11th grade: 325
- 12th grade, no diploma: 104
- High school graduate (or equivalency): 2,054
- Less than 1 year of college: 464
- Some college more than 1 year, no degree: 887
- Associate degree: 470
- Bachelor's degree: 449
- Master's degree: 19
- Professional school degree: 9
- Doctorate degree: 44

Education attainment for females 25 years and older:
- No schooling: 739
- Nursery to 4th grade: 360
- 5th and 6th grade: 193
- 7th and 8th grade: 346
- 9th grade: 359
- 10th grade: 168
- 11th grade: 92
- 12th grade, no diploma: 187
- High school graduate (or equivalency): 2,129
- Less than 1 year of college: 488
- Some college more than 1 year, no degree: 402
- Associate degree: 329
- Bachelor's degree: 746
- Master's degree: 98
- Professional school degree: 44
- Doctorate degree: 0

Housing units in structures:
- One, detached: 875
- One, attached: 274
- Two: 1,983
- 3 or 4: 3,689
- 5 to 9: 486
- 10 to 19: 68
- 20 to 49: 100
- 50 or more: 823
- Boats, RVs, vans, etc.: 16
Housing units lacking complete kitchen facilities in 2022: 3.0%
House/condo owner moved in on average 11 years ago
Renter moved in on average 3 years ago

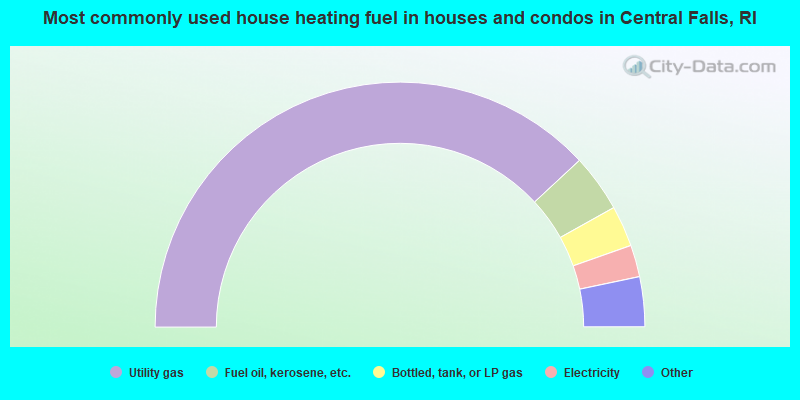
- 76.2%Utility gas
- 7.6%Fuel oil, kerosene, etc.
- 5.4%Bottled, tank, or LP gas
- 4.2%Electricity
- 3.0%Wood
- 2.7%Other fuel
- 0.8%No fuel used
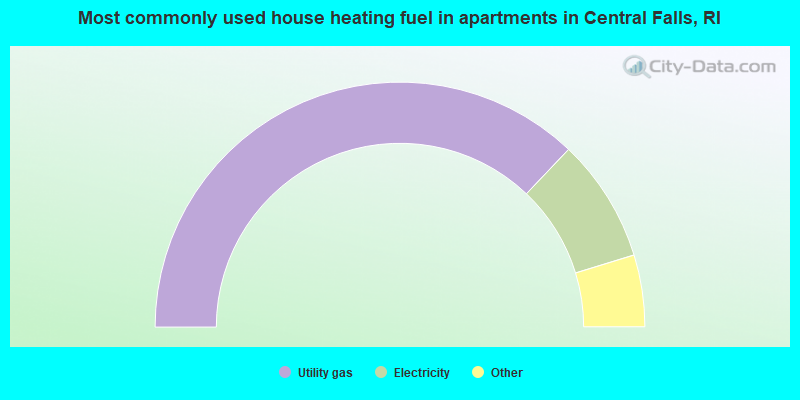
- 74.2%Utility gas
- 16.3%Electricity
- 3.3%Bottled, tank, or LP gas
- 3.1%Fuel oil, kerosene, etc.
- 1.9%No fuel used
- 1.2%Other fuel
Private vs. public school enrollment:
| Here: | 14.1% |
| Rhode Island: | 12.2% |
| Here: | 6.5% |
| Rhode Island: | 11.6% |
| Here: | 28.1% |
| Rhode Island: | 41.1% |


