Chillum, MD (Maryland) Houses and Residents
Estimated median house or condo value in 2022: $398,816 (it was $136,300 in 2000 )
Chillum:
$398,816Maryland:
$398,100
Lower value quartile - upper value quartile: $331,843 - $478,942Mean price in 2022: Detached houses: $398,921 Here:
$398,921State:
$526,819
Townhouses or other attached units: $597,593 Here:
$597,593State:
$328,305
In 5-or-more-unit structures: $106,785 Here:
$106,785State:
$350,378
Total population: 33,513 (All urban)
Houses: 11,777 (11,137 occupied: 4,641 owner occupied, 6,546 renter occupied )
% of renters here:
59%State:
32%
Housing density: 2,932 houses/condos per square mile
Median price asked for vacant for-sale houses and condos in 2022: $354,852.
Median contract rent in 2022: $1,533 (lower quartile is $1,236, upper quartile is $1,874)
Median rent asked for vacant for-rent units in 2022: $2,216
Median gross rent in Chillum, MD in 2022: $1,638
Housing units in Chillum with a mortgage: 3,437 (257 second mortgage, 32 home equity loan, 110 both second mortgage and home equity loan )Houses without a mortgage: 89
Median household income for houses/condos with a mortgage: $101,228
Median household income for apartments without a mortgage: $65,480
Median monthly housing costs: $1,615
Data:
Median house or condo value ($)
Median house or condo value ($ change since 2000)
Median house or condo value ($) - White
Median house or condo value ($) - Black or African American
Median house or condo value ($) - Asian
Median house or condo value ($) - Hispanic or Latino
Median house or condo value ($) - American Indian and Alaska Native
Median house or condo value ($) - Multirace
Median house or condo value ($) - Other Race
Median price asked for mobile homes ($)
Household density (households per square mile)
Mean house or condo value by units in structure - 1, detached ($)
Mean house or condo value by units in structure - 1, attached ($)
Mean house or condo value by units in structure - 2 ($)
Mean house or condo value by units in structure by units in structure - 3 or 4 ($)
Mean house or condo value by units in structure - 5 or more ($)
Mean house or condo value by units in structure - Boat, RV, van, etc. ($)
Mean house or condo value by units in structure - Mobile home ($)
Median contract rent ($)
Median contract rent - Lower quartile ($)
Median contract rent - Upper quartile ($)
Median gross rent ($)
Urban houses (%)
Rural houses (%)
Houses occupied (%)
Houses occupied (% change since 2000)
Houses owner occupied (%)
Houses owner occupied (% change since 2000)
Houses renter occupied (%)
Houses renter occupied (% change since 2000)
Vacant housing units - For rent (%)
Vacant housing units - For rent (% change since 2000)
Vacant housing units - For sale only (%)
Vacant housing units - For sale only (% change since 2000)
Vacant housing units - Rented or sold, not occupied (%)
Vacant housing units - Rented or sold, not occupied (% change since 2000)
Vacant housing units - For seasonal, recreational, or occasional use (%)
Vacant housing units - For seasonal, recreational, or occasional use (% change since 2000)
Vacant housing units - For migrant workers (%)
Vacant housing units - For migrant workers (% change since 2000)
Vacant housing units - Other vacant (%)
Vacant housing units - Other vacant (% change since 2000)
Median monthly housing costs ($)
Median household income for houses/condos with a mortgage ($)
Median household income for houses/condos without a mortgage ($)
Median household income ($)
Median household income ($) - White
Median household income ($) - Black or African American
Median household income ($) - Asian
Median household income ($) - Hispanic or Latino
Median household income ($) - American Indian and Alaska Native
Median household income ($) - Multirace
Median household income ($) - Other Race
Mortgage status - with mortgage (%)
Mortgage status - with second mortgage (%)
Mortgage status - with home equity loan (%)
Mortgage status - with both second mortgage and home equity loan (%)
Mortgage status - without a mortgage (%)
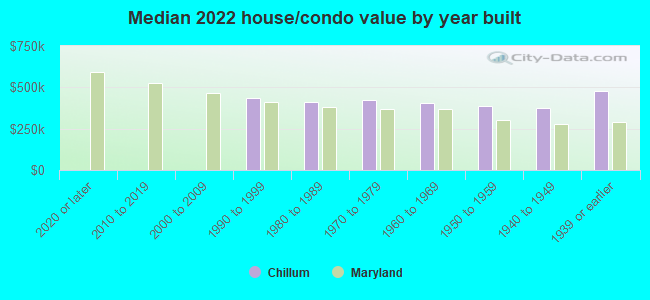
Median year house/condo built
Median year apartment built
Household type by relationship - Male householder living alone (%)
Household type by relationship - Male householder not living alone (%)
Household type by relationship - Female householder living alone (%)
Household type by relationship - Female householder not living alone (%)
Household type by relationship - Opposite-Sex spouse (%)
Household type by relationship - Same-Sex spouse (%)
Household type by relationship - Opposite-Sex unmarried partner (%)
Household type by relationship - Same-Sex unmarried partner (%)
Household type by relationship - In group quarters (%)
Size of family households - 2-person household (%)
Size of family households - 3-person household (%)
Size of family households - 4-person household (%)
Size of family households - 5-person household (%)
Size of family households - 6-person household (%)
Size of family households - 7-or-more-person household (%)
Size of nonfamily households - 1-person household (%)
Size of nonfamily households - 2-person household (%)
Size of nonfamily households - 3-person household (%)
Size of nonfamily households - 4-person household (%)
Size of nonfamily households - 5-person household (%)
Size of nonfamily households - 6-person household (%)
Size of nonfamily households - 7-or-moreperson household (%)
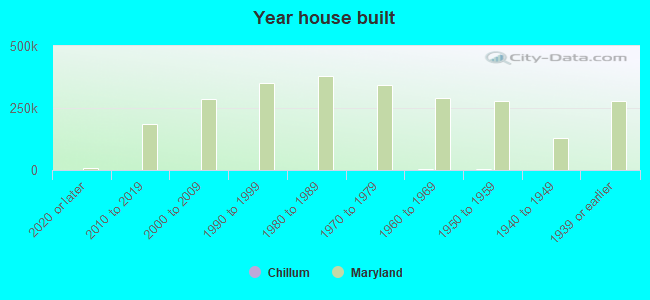
Year house built - Built 2010 or later (%)
Year house built - Built 2000 to 2009 (%)
Year house built - Built 1990 to 1999 (%)
Year house built - Built 1980 to 1989 (%)
Year house built - Built 1970 to 1979 (%)
Year house built - Built 1960 to 1969 (%)
Year house built - Built 1950 to 1959 (%)
Year house built - Built 1940 to 1949 (%)
Year house built - Built 1939 or earlier (%)
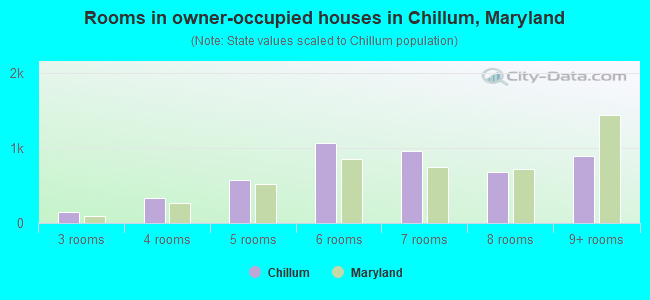
Median number of rooms in houses and condos
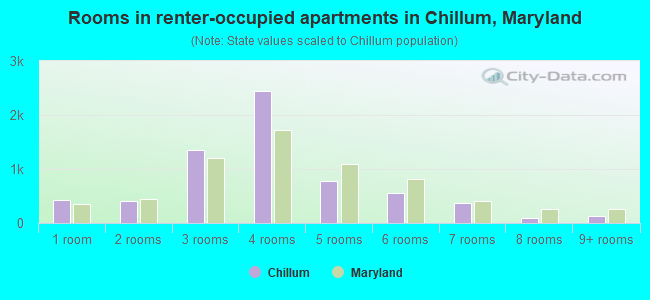
Median number of rooms in apartments
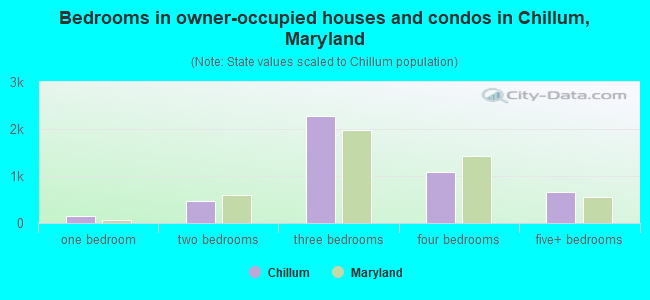
Median number of bedrooms in owner occupied houses
Mean number of bedrooms in owner occupied houses
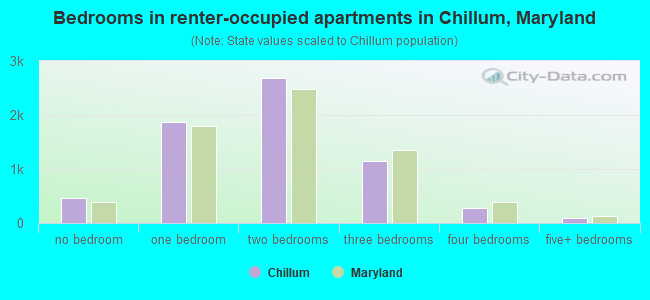
Median number of bedrooms in renter occupied houses
Mean number of bedrooms in renter occupied houses
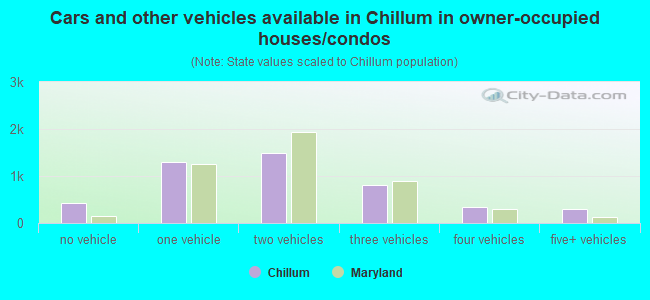
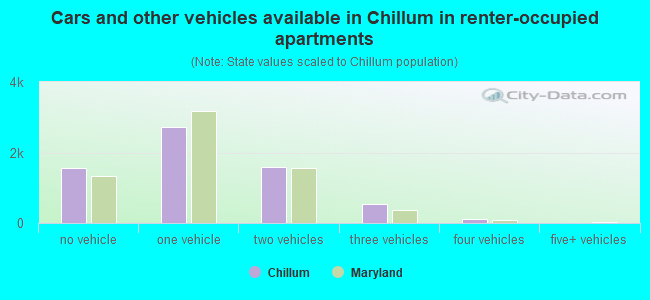
Median number of vehichles in owner occupied houses
Mean number of vehichles in owner occupied houses
Median number of vehichles in renter occupied houses
Mean number of vehichles in renter occupied houses
Rooms in owner-occupied houses - 1 room (%)
Rooms in owner-occupied houses - 2 rooms (%)
Rooms in owner-occupied houses - 3 rooms (%)
Rooms in owner-occupied houses - 4 rooms (%)
Rooms in owner-occupied houses - 5 rooms (%)
Rooms in owner-occupied houses - 6 rooms (%)
Rooms in owner-occupied houses - 7 rooms (%)
Rooms in owner-occupied houses - 8 rooms (%)
Rooms in owner-occupied houses - 9+ rooms (%)
Rooms in renter-occupied houses - 1 room (%)
Rooms in renter-occupied houses - 2 rooms (%)
Rooms in renter-occupied houses - 3 rooms (%)
Rooms in renter-occupied houses - 4 rooms (%)
Rooms in renter-occupied houses - 5 rooms (%)
Rooms in renter-occupied houses - 6 rooms (%)
Rooms in renter-occupied houses - 7 rooms (%)
Rooms in renter-occupied houses - 8 rooms (%)
Rooms in renter-occupied houses - 9+ rooms (%)
Bedrooms in owner-occupied houses - no bedrooms (%)
Bedrooms in owner-occupied houses - 1 bedroom (%)
Bedrooms in owner-occupied houses - 2 bedrooms (%)
Bedrooms in owner-occupied houses - 3 bedrooms (%)
Bedrooms in owner-occupied houses - 4 bedrooms (%)
Bedrooms in owner-occupied houses - 5+ bedrooms (%)
Bedrooms in renter-occupied houses - no bedrooms (%)
Bedrooms in renter-occupied houses - 1 bedroom (%)
Bedrooms in renter-occupied houses - 2 bedrooms (%)
Bedrooms in renter-occupied houses - 3 bedrooms (%)
Bedrooms in renter-occupied houses - 4 bedrooms (%)
Bedrooms in renter-occupied houses - 5+ bedrooms (%)
Vehicles available in owner-occupied houses - no vehicle available (%)
Vehicles available in owner-occupied houses - 1 vehicle available(%)
Vehicles available in owner-occupied houses - 2 Vehicles available (%)
Vehicles available in owner-occupied houses - 3 Vehicles available (%)
Vehicles available in owner-occupied houses - 4 Vehicles available (%)
Vehicles available in owner-occupied houses - 5+ Vehicles available (%)
Vehicles available in renter-occupied houses - no vehicle available (%)
Vehicles available in renter-occupied houses - 1 vehicle available (%)
Vehicles available in renter-occupied houses - 2 Vehicles available (%)
Vehicles available in renter-occupied houses - 3 Vehicles available (%)
Vehicles available in renter-occupied houses - 4 Vehicles available (%)
Vehicles available in renter-occupied houses - 5+ Vehicles available (%)
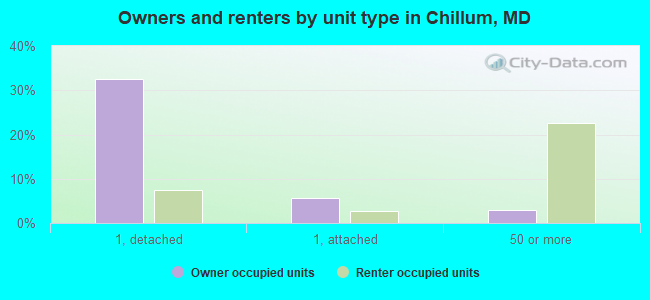
Housing units in structures - 1, detached (%)
Housing units in structures - 1, attached (%)
Housing units in structures - 2 (%)
Housing units in structures - 3 or 4 (%)
Housing units in structures - 5 to 9 (%)
Housing units in structures - 10 to 19 (%)
Housing units in structures - 20 to 49 (%)
Housing units in structures - 50 or more (%)
Housing units in structures - Mobile home (%)
Housing units in structures - Boat, RV, van, etc. (%)
Housing units in structures - Owners - 1, detached (%)
Housing units in structures - Owners - 1, attached (%)
Housing units in structures - Owners - 2 (%)
Housing units in structures - Owners - 3 or 4 (%)
Housing units in structures - Owners - 5 to 9 (%)
Housing units in structures - Owners - 10 to 19 (%)
Housing units in structures - Owners - 20 to 49 (%)
Housing units in structures - Owners - 50 or more (%)
Housing units in structures - Owners - Mobile home (%)
Housing units in structures - Owners - Boat, RV, van, etc. (%)
Housing units in structures - Renters - 1, detached (%)
Housing units in structures - Renters - 1, attached (%)
Housing units in structures - Renters - 2 (%)
Housing units in structures - Renters - 3 or 4 (%)
Housing units in structures - Renters - 5 to 9 (%)
Housing units in structures - Renters - 10 to 19 (%)
Housing units in structures - Renters - 20 to 49 (%)
Housing units in structures - Renters - 50 or more (%)
Housing units in structures - Renters - Mobile home (%)
Housing units in structures - Renters - Boat, RV, van, etc. (%)
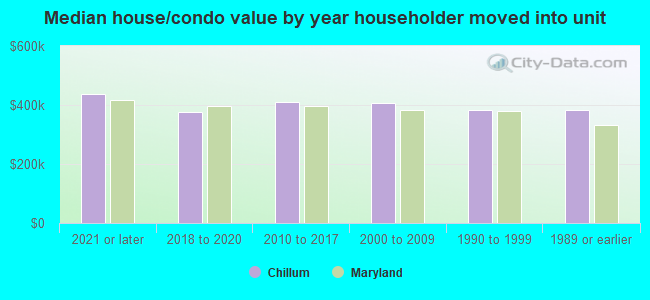
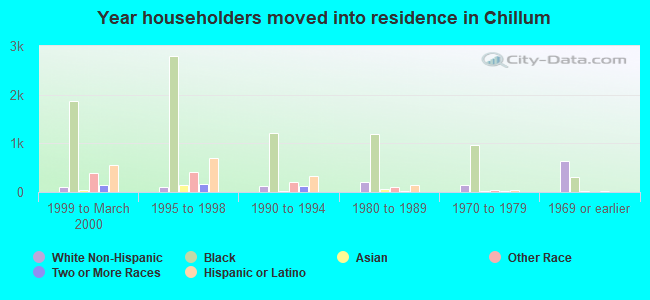
House/condo owner moved in on average (years ago)
Renter moved in on average (years ago)
Year householder moved into unit - Moved in 1999 to March 2000 (%)
Year householder moved into unit - Moved in 1999 to March 2000 (%) - White
Year householder moved into unit - Moved in 1999 to March 2000 (%) - Black or African American
Year householder moved into unit - Moved in 1999 to March 2000 (%) - Asian
Year householder moved into unit - Moved in 1999 to March 2000 (%) - Hispanic or Latino
Year householder moved into unit - Moved in 1999 to March 2000 (%) - American Indian and Alaska Native
Year householder moved into unit - Moved in 1999 to March 2000 (%) - Multirace
Year householder moved into unit - Moved in 1999 to March 2000 (%) - Other Race
Year householder moved into unit - Moved in 1995 to 1998 (%)
Year householder moved into unit - Moved in 1995 to 1998 (%) - White
Year householder moved into unit - Moved in 1995 to 1998 (%) - Black or African American
Year householder moved into unit - Moved in 1995 to 1998 (%) - Asian
Year householder moved into unit - Moved in 1995 to 1998 (%) - Hispanic or Latino
Year householder moved into unit - Moved in 1995 to 1998 (%) - American Indian and Alaska Native
Year householder moved into unit - Moved in 1995 to 1998 (%) - Multirace
Year householder moved into unit - Moved in 1995 to 1998 (%) - Other Race
Year householder moved into unit - Moved in 1990 to 1994 (%)
Year householder moved into unit - Moved in 1990 to 1994 (%) - White
Year householder moved into unit - Moved in 1990 to 1994 (%) - Black or African American
Year householder moved into unit - Moved in 1990 to 1994 (%) - Asian
Year householder moved into unit - Moved in 1990 to 1994 (%) - Hispanic or Latino
Year householder moved into unit - Moved in 1990 to 1994 (%) - American Indian and Alaska Native
Year householder moved into unit - Moved in 1990 to 1994 (%) - Multirace
Year householder moved into unit - Moved in 1990 to 1994 (%) - Other Race
Year householder moved into unit - Moved in 1980 to 1989 (%)
Year householder moved into unit - Moved in 1980 to 1989 (%) - White
Year householder moved into unit - Moved in 1980 to 1989 (%) - Black or African American
Year householder moved into unit - Moved in 1980 to 1989 (%) - Asian
Year householder moved into unit - Moved in 1980 to 1989 (%) - Hispanic or Latino
Year householder moved into unit - Moved in 1980 to 1989 (%) - American Indian and Alaska Native
Year householder moved into unit - Moved in 1980 to 1989 (%) - Multirace
Year householder moved into unit - Moved in 1980 to 1989 (%) - Other Race
Year householder moved into unit - Moved in 1970 to 1979 (%)
Year householder moved into unit - Moved in 1970 to 1979 (%) - White
Year householder moved into unit - Moved in 1970 to 1979 (%) - Black or African American
Year householder moved into unit - Moved in 1970 to 1979 (%) - Asian
Year householder moved into unit - Moved in 1970 to 1979 (%) - Hispanic or Latino
Year householder moved into unit - Moved in 1970 to 1979 (%) - American Indian and Alaska Native
Year householder moved into unit - Moved in 1970 to 1979 (%) - Multirace
Year householder moved into unit - Moved in 1970 to 1979 (%) - Other Race
Year householder moved into unit - Moved in 1969 or earlier (%)
Year householder moved into unit - Moved in 1969 or earlier (%) - White
Year householder moved into unit - Moved in 1969 or earlier (%) - Black or African American
Year householder moved into unit - Moved in 1969 or earlier (%) - Asian
Year householder moved into unit - Moved in 1969 or earlier (%) - Hispanic or Latino
Year householder moved into unit - Moved in 1969 or earlier (%) - American Indian and Alaska Native
Year householder moved into unit - Moved in 1969 or earlier (%) - Multirace
Year householder moved into unit - Moved in 1969 or earlier (%) - Other Race
Housing units lacking complete plumbing facilities (%)
Housing units lacking complete kitchen facilities (%)
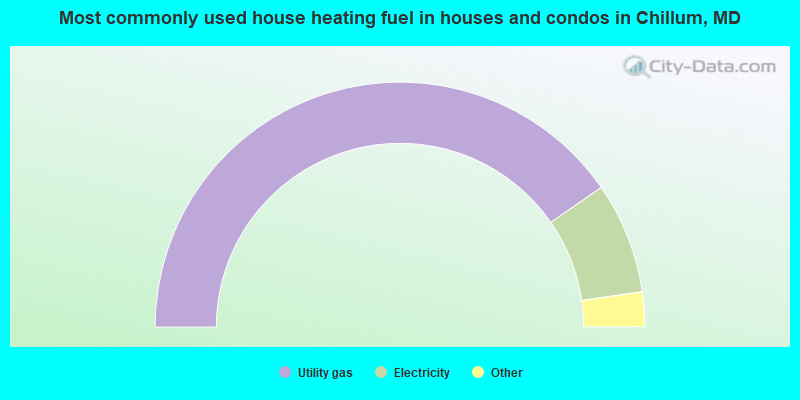
House heating fuel used in houses and condos - Utility gas (%)
House heating fuel used in houses and condos - Bottled, tank, or LP gas (%)
House heating fuel used in houses and condos - Electricity (%)
House heating fuel used in houses and condos - Fuel oil, kerosene, etc. (%)
House heating fuel used in houses and condos - Coal or coke (%)
House heating fuel used in houses and condos - Wood (%)
House heating fuel used in houses and condos - Solar energy (%)
House heating fuel used in houses and condos - Other fuel (%)
House heating fuel used in houses and condos - No fuel used (%)
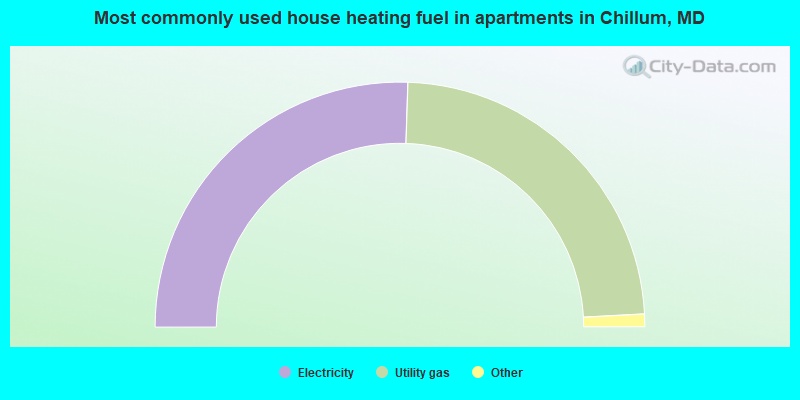
House heating fuel used in apartments - Utility gas (%)
House heating fuel used in apartments - Bottled, tank, or LP gas (%)
House heating fuel used in apartments - Electricity (%)
House heating fuel used in apartments - Fuel oil, kerosene, etc. (%)
House heating fuel used in apartments - Coal or coke (%)
House heating fuel used in apartments - Wood (%)
House heating fuel used in apartments - Solar energy (%)
House heating fuel used in apartments - Other fuel (%)
House heating fuel used in apartments - No fuel used (%)
Latest news about housing in Chillum, MD collected exclusively by city-data.com from local newspapers, TV, and radio stations
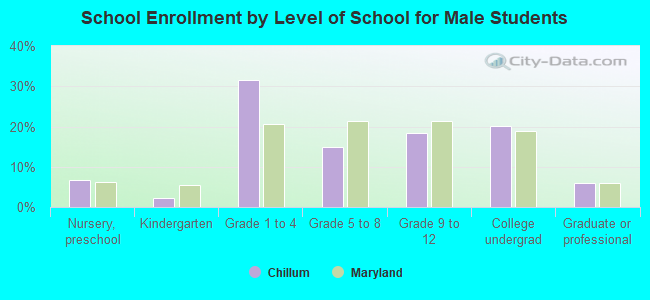
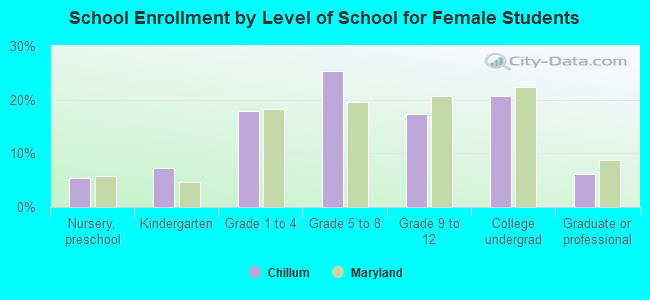
Median year house/condo built: 1955Median year apartment built: 1967Household type by relationship:
Households: 35,524
Male householders: 5,379 (1,183 living alone ), Female householders: 5,492 (1,592 living alone )3,891 spouses (3,731 opposite-sex spouses ), 1,007 unmarried partners , (980 opposite-sex unmarried partners ), 10,571 children (9,967 natural , 29 adopted , 574 stepchildren ), 1,265 grandchildren , 1,208 brothers or sisters , 996 parents , 0 foster children , 2,670 other relatives , 2,425 non-relatives In group quarters: 615
Size of family households: 2,141 2-persons , 1,909 3-persons , 1,609 4-persons , 836 5-persons , 594 6-persons , 628 7-or-more-persons .
Size of nonfamily households: 2,732 1-person , 470 2-persons , 166 3-persons , 25 4-persons , 9 5-persons , 17 7-or-more-persons .
3,914 married couples with children. single-parent households (1,036 men , 1,867 women ).
35.6% of residents of Chillum speak English at home. of residents speak Spanish at home (34% speak English very well , 23% speak English well , 24% speak English not well , 18% don't speak English at all ).of residents speak other Indo-European language at home (65% speak English very well , 15% speak English well , 18% speak English not well , 2% don't speak English at all ).of residents speak Asian or Pacific Island language at home (45% speak English very well , 25% speak English well , 13% speak English not well , 17% don't speak English at all ).of residents speak other language at home (70% speak English very well , 23% speak English well , 4% speak English not well , 3% don't speak English at all ).
Foreign born population: 18,288 (51.5%)of them are naturalized citizens )
Median number of rooms in houses and condos:
Median number of rooms in apartments
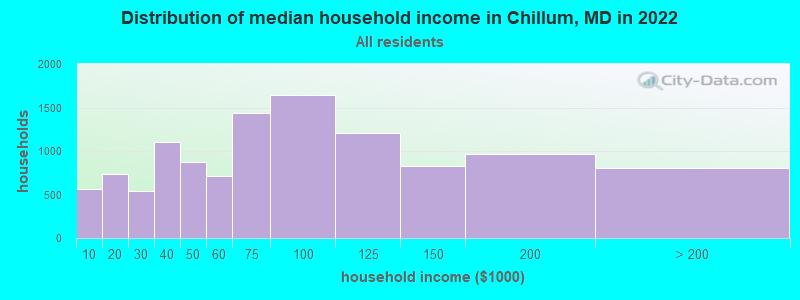
Chillum, MD household income distribution 568 Less than $10,000735 $10,000 to $19,999543 $20,000 to $29,9991,101 $30,000 to $39,999872 $40,000 to $49,999718 $50,000 to $59,9991,435 $60,000 to $74,9991,642 $75,000 to $99,9991,203 $100,000 to $124,999823 $125,000 to $149,999962 $150,000 to $199,999804 $200,000 or more
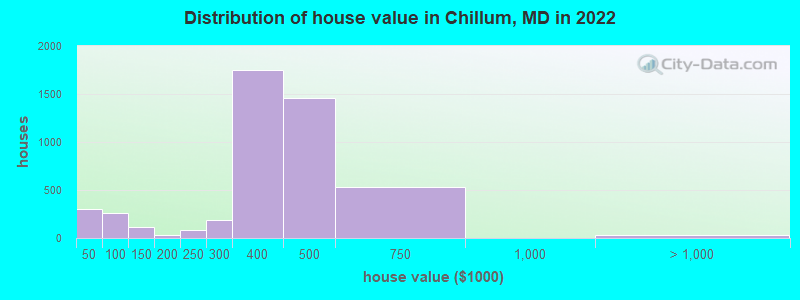
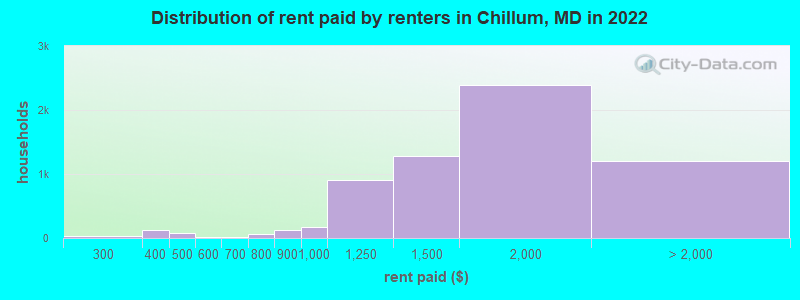
Home value of owner - occupied houses in 2022 in Chillum, MD 149 Less than $10,00013 $10,000 to $14,99914 $15,000 to $19,99921 $25,000 to $29,99919 $30,000 to $34,9997 $35,000 to $39,99975 $40,000 to $49,99927 $50,000 to $59,99929 $70,000 to $79,999112 $80,000 to $89,99919 $90,000 to $99,99993 $100,000 to $124,99923 $125,000 to $149,99911 $150,000 to $174,99915 $175,000 to $199,99986 $200,000 to $249,999182 $250,000 to $299,9991,752 $300,000 to $399,9991,461 $400,000 to $499,999535 $500,000 to $749,99916 $1,000,000 to $1,499,99917 $2,000,000 or moreRent paid by renters in 2022 in Chillum, MD 20 Less than $10014 $100 to $14910 $200 to $24928 $250 to $299120 $300 to $34910 $350 to $39954 $400 to $44918 $450 to $49912 $550 to $59911 $650 to $69961 $700 to $7497 $750 to $799123 $800 to $899166 $900 to $999902 $1,000 to $1,2491,281 $1,250 to $1,4992,392 $1,500 to $1,999913 $2,000 to $2,49982 $2,500 to $2,99932 $3,000 to $3,499169 No cash rent
Percentage of workers working in this county: 42.2%Number of people working at home: 1,801 (10.2% of all workers )
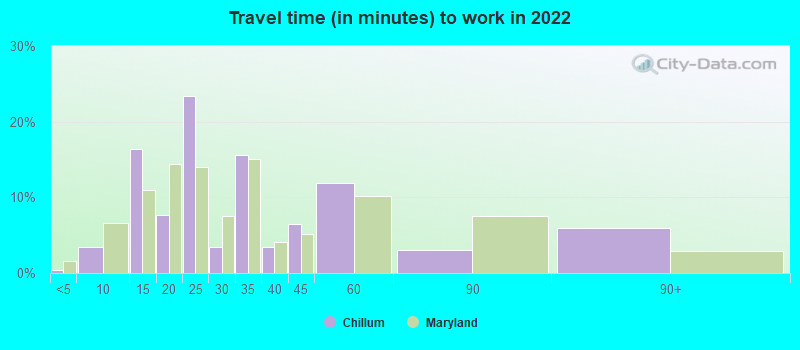
Travel time to work (commute)
Less than 5 minutes: 1485 to 9 minutes: 22010 to 14 minutes: 83615 to 19 minutes: 1,19620 to 24 minutes: 1,52625 to 29 minutes: 1,23530 to 34 minutes: 3,49435 to 39 minutes: 92840 to 44 minutes: 1,47445 to 59 minutes: 2,46260 to 89 minutes: 1,34890 or more minutes: 493
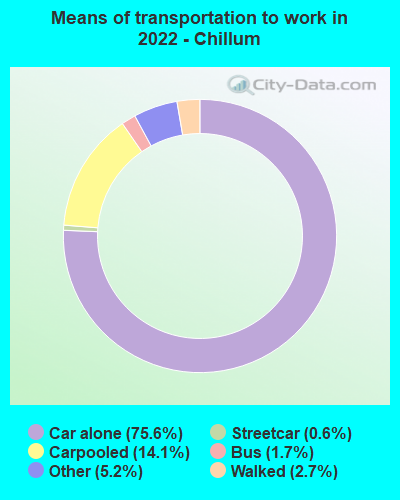
Means of transportation to work:
Drove a car alone: 2,591 (52.0%)Carpooled: 439 (8.8%)Bus : 41 (0.8%)Subway or elevated rail : 14 (0.3%)Taxi: 229 (4.6%)Walked: 93 (1.9%)Worked at home: 1,801 (36.1%)
Unemployment by race in 2022
Unemployment rate for White non-Hispanic residents 8.3% FemalesUnemployment rate for Black residents 7.0% Males4.6% FemalesUnemployment rate for American Indian and Alaska Native residents 4.1% FemalesUnemployment rate for Asian residents 16.5% Males25.8% FemalesUnemployment rate for other race residents 1.4% Males5.7% FemalesUnemployment rate for two or more race residents 2.4% Males3.7% FemalesUnemployment rate for Hispanic or Latino residents 1.6% Males5.4% Females
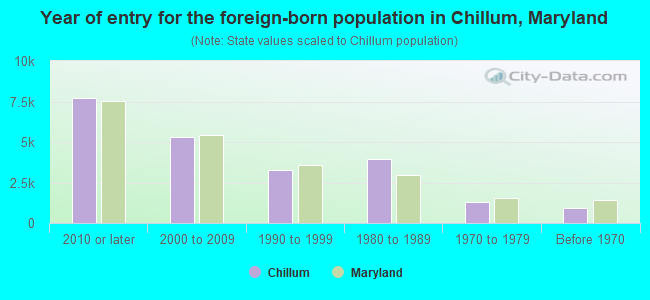
Year of entry for the foreign-born population in Chillum, Maryland
7,710 2010 or later 5,320 2000 to 2009 3,246 1990 to 1999 3,972 1980 to 1989 1,293 1970 to 1979 903 Before 1970
First ancestries reported:
Ethiopian: 2,656 (9.5%)
African: 844 (3.0%)
Jamaican: 668 (2.4%)
Nigerian: 393 (1.4%)
American: 359 (1.3%)
Haitian: 297 (1.1%)
Ghanaian: 229 (0.8%)
Liberian: 204 (0.7%)
Trinidadian and Tobagonian: 171 (0.6%)
West Indian: 131 (0.5%)
Kenyan: 109 (0.4%)
Zimbabwean: 98 (0.3%)
Afghan: 89 (0.3%)
Albanian: 75 (0.3%)
Sierra Leonean: 64 (0.2%)
Guyanese: 43 (0.2%)
Senegalese: 36 (0.1%)
Italian: 29 (0.1%)
Croatian: 27 (0.10%)
European: 25 (0.09%)
Irish: 24 (0.09%)
English: 17 (0.06%)
German: 15 (0.05%)
Ukrainian: 15 (0.05%)
Turkish: 11 (0.04%)
Hungarian: 10 (0.04%)
Scotch-Irish: 8 (0.03%)
British: 7 (0.02%)
South African: 6 (0.02%)
Romanian: 4 (0.01%)
Armenian: 3 (0.01%)
Russian: 2 (0.01%) Most common places of birth for foreign-born residents (%): El Salvador Chillum:
43.7% (7,889)Maryland:
12.0% (115,412)
Ethiopia Chillum:
7.0% (1,265)Maryland:
3.2% (30,870)
Guatemala Chillum:
6.9% (1,247)Maryland:
4.4% (42,350)
Honduras Chillum:
5.0% (899)Maryland:
2.5% (24,026)
Eritrea Chillum:
3.9% (695)Maryland:
0.3% (2,915)
Jamaica Chillum:
3.6% (653)Maryland:
2.8% (27,444)
Cameroon Chillum:
3.3% (603)Maryland:
2.5% (23,969)
Dominican Republic Chillum:
2.6% (467)Maryland:
1.4% (13,947)
Mexico Chillum:
2.6% (465)Maryland:
3.5% (34,065)
Nigeria Chillum:
2.0% (367)Maryland:
4.6% (44,825)
Trinidad and Tobago Chillum:
1.9% (346)Maryland:
1.2% (11,481)
Zimbabwe Chillum:
1.7% (310)Maryland:
0.1% (1,254)
Ghana Chillum:
1.6% (282)Maryland:
1.8% (17,774)
Place of birth for U.S.-born residents:
This state: 7,161Other state: 10,603Northeast: 1,182Midwest: 364South: 8,418West: 508 90.9% of Chillum residents lived in the same house 1 years ago.
Out of people who lived in different houses, 37.4% lived in this county.
Out of people who lived in different counties, 23.8% lived in Maryland.
Chillum:
90.9%State average:
88.5%
Education attainment for males 25 years and older:
No schooling: 758Nursery to 4th grade: 6805th and 6th grade: 6427th and 8th grade: 6299th grade: 36010th grade: 22211th grade: 18612th grade, no diploma: 405High school graduate (or equivalency): 2,799Less than 1 year of college: 458Some college more than 1 year, no degree: 1,176Associate degree: 481Bachelor's degree: 1,628Master's degree: 818Professional school degree: 57Doctorate degree: 123
Education attainment for females 25 years and older:
No schooling: 706Nursery to 4th grade: 4105th and 6th grade: 5877th and 8th grade: 2189th grade: 40210th grade: 5011th grade: 29912th grade, no diploma: 442High school graduate (or equivalency): 3,080Less than 1 year of college: 599Some college more than 1 year, no degree: 1,213Associate degree: 945Bachelor's degree: 2,146Master's degree: 867Professional school degree: 45Doctorate degree: 101
Housing units in structures:
One, detached: 4,682One, attached: 903Two: 803 or 4: 1085 to 9: 93210 to 19: 1,73720 to 49: 34650 or more: 2,985Housing units lacking complete kitchen facilities in 2022: 0.5%House/condo owner moved in on average 14 years ago
Renter moved in on average 5 years ago
Private vs. public school enrollment:
Students in private schools in grades 1 to 8 (elementary and middle school): 468 Students in private schools in grades 9 to 12 (high school): 86 Students in private undergraduate colleges: 406