Chino Hills, CA (California) Houses and Residents
| Chino Hills: | $821,300 |
| California: | $715,900 |
Total population: 77,005 (Urban population: 63,339, Rural population: 3,377 (all nonfarm))
Houses: 25,054 (24,929 occupied: 17,613 owner occupied, 7,316 renter occupied)
| % of renters here: | 29% |
| State: | 44% |
Housing density: 559 houses/condos per square mile
Median price asked for vacant for-sale houses and condos in 2022: $1,546,890.
Median contract rent in 2022: over $2,000 (lower quartile is $1,939, upper quartile is over $2,000)
Median rent asked for vacant for-rent units in 2022: $2,895
Median gross rent in Chino Hills, CA in 2022: over $2,000
Housing units in Chino Hills with a mortgage: 11,579 (2,004 second mortgage, 50 home equity loan, 1,799 both second mortgage and home equity loan)
Houses without a mortgage: 233
Median household income for houses/condos with a mortgage: $154,179
Median household income for apartments without a mortgage: $100,176
Median monthly housing costs: $2,351
Compare current foreclosures in Chino Hills, CA:
| Photo | Address | Area | Beds / Baths | Price | Details |
|---|---|---|---|---|---|

|
#1
Sunny Brook Ln
Chino Hills, CA 91709
|
1,833 sq. feet
|
2 baths 4 beds |
show details | |

|
#2
Hunter Rd
Chino Hills, CA 91709
|
2,360 sq. feet
|
2 baths 3 beds |
show details | |

|
#3
Quail St
Chino Hills, CA 91709
|
825 sq. feet
|
1 baths 2 beds |
show details | |

|
#4
Bainbridge Way
Chino Hills, CA 91709
|
2,198 sq. feet
|
3 baths 3 beds |
show details | |

|
#5
Pheasant St
Chino Hills, CA 91709
|
825 sq. feet
|
1 baths 3 beds |
show details | |

|
#6
Torrey Pines Dr
Chino Hills, CA 91709
|
2,854 sq. feet
|
3 baths 4 beds |
show details | |

|
#7
Lariat Dr
Chino Hills, CA 91709
|
1,171 sq. feet
|
2 baths 2 beds |
show details | |

|
#8
Diamond Valley Ln
Chino Hills, CA 91709
|
3,066 sq. feet
|
3 baths 4 beds |
show details | |

|
#9
Fresno Ave
Chino Hills, CA 91709
|
1,485 sq. feet
|
1 baths 2 beds |
show details | |

|
#10
Steeple Chase Dr
Chino Hills, CA 91709
|
1,808 sq. feet
|
2 baths 3 beds |
show details |
| Photo | Address | Area | Beds / Baths | Price | Details |
|---|---|---|---|---|---|

|
#11
South Trail Drive
Chino Hills, CA 91709
|
1,419 sq. feet
|
2 baths 3 beds |
show details | |

|
#12
Copper Rd
Chino Hills, CA 91709
|
1,718 sq. feet
|
2 baths 3 beds |
show details | |

|
#13
Ficus St
Chino Hills, CA 91709
|
1,758 sq. feet
|
2 baths 3 beds |
show details | |

|
#14
Valle Vista Dr
Chino Hills, CA 91709
|
1,287 sq. feet
|
2 baths 3 beds |
show details | |

|
#15
Glen Ct Unit 13
Chino Hills, CA 91709
|
1,243 sq. feet
|
2 baths 2 beds |
show details | |

|
#16
Shady Hollow Ln
Chino Hills, CA 91709
|
2,588 sq. feet
|
3 baths 4 beds |
show details | |

|
#17
El Molino Blvd
Chino Hills, CA 91709
|
1,247 sq. feet
|
1 baths 3 beds |
show details | |

|
#18
Sonrisa Dr
Chino Hills, CA 91709
|
1,002 sq. feet
|
1 baths 2 beds |
show details | |

|
#19
Monte Vista Ave Spc 234
Chino Hills, CA 91709
|
1,456 sq. feet
|
2 baths 3 beds |
show details | |

|
#20
Sunscape Ct
Chino Hills, CA 91709
|
1,923 sq. feet
|
2 baths 3 beds |
show details |
| Photo | Address | Area | Beds / Baths | Price | Details |
|---|---|---|---|---|---|

|
#21
Woodsorrel Dr
Chino Hills, CA 91709
|
1,333 sq. feet
|
2 baths 3 beds |
show details | |

|
#22
Sagebrush St
Chino Hills, CA 91709
|
3,180 sq. feet
|
3 baths 5 beds |
show details | |

|
#23
Canterbury Dr Unit 202
Chino Hills, CA 91709
|
1,146 sq. feet
|
2 baths 2 beds |
show details | |

|
#24
Sorrel Hills Ave
Chino Hills, CA 91709
|
2,485 sq. feet
|
3 baths 3 beds |
show details | |

|
#25
Homeridge Ln
Chino Hills, CA 91709
|
- sq. feet
|
- baths - beds |
show details | |

|
#26
Hunter Rd
Chino Hills, CA 91709
|
- sq. feet
|
- baths - beds |
show details | |

|
#27
Scenic Ridge Dr
Chino Hills, CA 91709
|
- sq. feet
|
- baths - beds |
show details | |

|
#28
High Knoll Dr Unit 268
Chino Hills, CA 91709
|
- sq. feet
|
- baths - beds |
show details | |

|
#29
Torrey Pines Dr
Chino Hills, CA 91709
|
- sq. feet
|
- baths - beds |
show details | |

|
#30
Peyton Dr Ste C
Chino Hills, CA 91709
|
- sq. feet
|
- baths - beds |
show details |
| Photo | Address | Area | Beds / Baths | Price | Details |
|---|---|---|---|---|---|

|
#31
Rancho Hills Dr
Chino Hills, CA 91709
|
- sq. feet
|
- baths - beds |
show details | |

|
#32
Rancho Hills Dr
Chino Hills, CA 91709
|
- sq. feet
|
- baths - beds |
show details | |

|
#33
Moon Crest Ln Unit A
Chino Hills, CA 91709
|
- sq. feet
|
- baths - beds |
show details | |

|
#34
Lynoak Drive
Chino Hills, CA 91709
|
- sq. feet
|
- baths - beds |
show details | |

|
#35
Fairfield Ranch Rd, Unit 8101
Chino Hills, CA 91709
|
- sq. feet
|
- baths - beds |
show details | |

|
#36
Cardinal Ridge Rd Unit E
Chino Hills, CA 91709
|
- sq. feet
|
- baths - beds |
show details | |

|
#37
Chino Hills Pkwy Unit 935
Chino Hills, CA 91709
|
- sq. feet
|
- baths - beds |
show details | |

|
#38
Frost Ave Apt 68
Chino Hills, CA 91709
|
- sq. feet
|
- baths - beds |
show details | |

|
#39
Mesa Blvd Unit D
Chino Hills, CA 91709
|
- sq. feet
|
- baths - beds |
show details | |

|
#40
Village Dr Apt D
Chino Hills, CA 91709
|
- sq. feet
|
- baths - beds |
show details |
| Photo | Address | Area | Beds / Baths | Price | Details |
|---|---|---|---|---|---|

|
#41
Canyon Oaks Xing
Chino Hills, CA 91709
|
- sq. feet
|
- baths - beds |
show details | |

|
Check over 1 million property listings on Foreclosure.com!
|
browse all offers | |||


 | Looking for a house to rent in Chino Hills,ca (6 replies) |
| Best apartment complexes in Chino and or Chino Hills (0 replies) |
| New home in Chino or small townhouse in Chino Hills (17 replies) |
| Quality and Cost of Living in Chino Hills vs. OC (8 replies) |
| How to find condos for rent? (2 replies) |
| Covina area vs Chino hills area (0 replies) |
Median year apartment built: 1990
Household type by relationship:
Households: 77,923- Male householders: 12,880 (1,033 living alone), Female householders: 12,049 (2,138 living alone)
15,639 spouses (15,560 opposite-sex spouses), 1,165 unmarried partners, (1,050 opposite-sex unmarried partners), 26,612 children (25,689 natural, 482 adopted, 441 stepchildren), 1,465 grandchildren, 780 brothers or sisters, 3,842 parents, 0 foster children, 1,816 other relatives, 1,358 non-relatives
- In group quarters: 317
Size of family households: 7,205 2-persons, 5,976 3-persons, 3,616 4-persons, 1,711 5-persons, 1,553 6-persons, 411 7-or-more-persons.
Size of nonfamily households: 3,171 1-person, 1,206 2-persons, 80 3-persons.
13,664 married couples with children.
2,107 single-parent households (720 men, 1,387 women).
49.1% of residents of Chino Hills speak English at home.
15.3% of residents speak Spanish at home (80% speak English very well, 12% speak English well, 4% speak English not well, 4% don't speak English at all).
3.3% of residents speak other Indo-European language at home (77% speak English very well, 13% speak English well, 9% speak English not well, 1% don't speak English at all).
30.6% of residents speak Asian or Pacific Island language at home (52% speak English very well, 28% speak English well, 16% speak English not well, 4% don't speak English at all).
2.1% of residents speak other language at home (58% speak English very well, 37% speak English well, 5% speak English not well).
Foreign born population: 27,905 (35.8%)
(65.0% of them are naturalized citizens)
| Here: | 6.7 |
| State: | 6.0 |
| Here: | 5.0 |
| State: | 3.9 |

- Bedrooms in owner-occupied houses and condos in Chino Hills, California
- 102no bedroom
- 1561 bedroom
- 7082 bedrooms
- 7,0613 bedrooms
- 7,7294 bedrooms
- 1,8575+ bedrooms

- Bedrooms in renter-occupied apartments in Chino Hills, California
- 182no bedroom
- 5281 bedroom
- 2,9002 bedrooms
- 2,6973 bedrooms
- 8864 bedrooms
- 1235+ bedrooms

- Cars and other vehicles available in Chino Hills in owner-occupied houses/condos
- 183no vehicle
- 2,6551 vehicle
- 6,0912 vehicles
- 4,6513 vehicles
- 2,5624 vehicles
- 1,4715+ vehicles

- Cars and other vehicles available in Chino Hills in renter-occupied apartments
- 61no vehicle
- 2,2061 vehicle
- 3,3792 vehicles
- 1,4953 vehicles
- 1754 vehicles
- 05+ vehicles

- Rooms in owner-occupied houses in Chino Hills, California
- 01 room
- 02 rooms
- 4953 rooms
- 9674 rooms
- 3,5185 rooms
- 3,1636 rooms
- 3,6347 rooms
- 3,1438 rooms
- 2,6939+ rooms

- Rooms in renter-occupied apartments in Chino Hills, California
- 1821 room
- 2172 rooms
- 7833 rooms
- 1,6354 rooms
- 1,7275 rooms
- 1,4146 rooms
- 8597 rooms
- 4298 rooms
- 709+ rooms


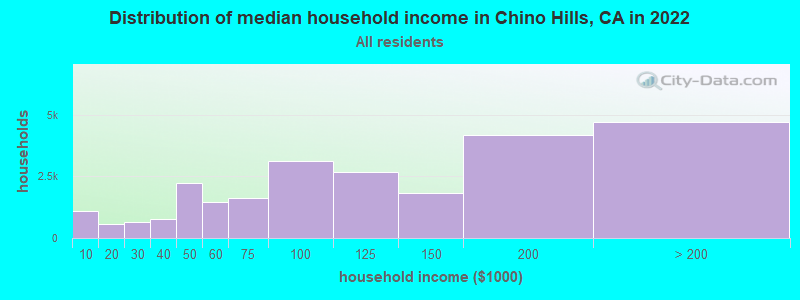
Chino Hills, CA household income distribution

- 1,091Less than $10,000
- 559$10,000 to $19,999
- 645$20,000 to $29,999
- 781$30,000 to $39,999
- 2,252$40,000 to $49,999
- 1,470$50,000 to $59,999
- 1,617$60,000 to $74,999
- 3,138$75,000 to $99,999
- 2,678$100,000 to $124,999
- 1,816$125,000 to $149,999
- 4,173$150,000 to $199,999
- 4,709$200,000 or more
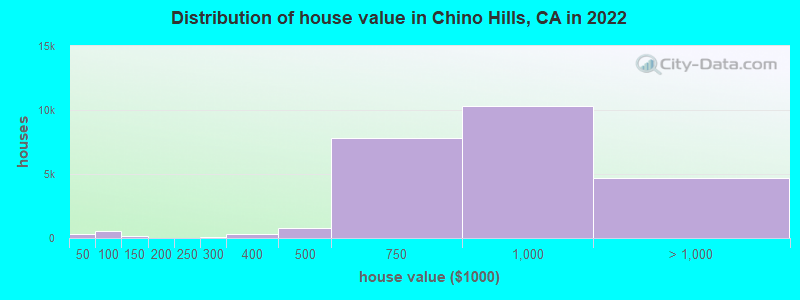
Home value of owner - occupied houses in 2022 in Chino Hills, CA
-
- 97Less than $10,000
- 3$10,000 to $14,999
- 36$15,000 to $19,999
- 17$20,000 to $24,999
- 124$40,000 to $49,999
- 156$50,000 to $59,999
- 145$60,000 to $69,999
- 93$70,000 to $79,999
- 29$80,000 to $89,999
- 17$90,000 to $99,999
- 133$100,000 to $124,999
- 41$125,000 to $149,999
- 9$150,000 to $174,999
- 11$175,000 to $199,999
- 9$200,000 to $249,999
- 47$250,000 to $299,999
- 287$300,000 to $399,999
- 795$400,000 to $499,999
- 7,781$500,000 to $749,999
- 10,291$750,000 to $999,999
- 3,671$1,000,000 to $1,499,999
- 539$1,500,000 to $1,999,999
- 495$2,000,000 or more
Rent paid by renters in 2022 in Chino Hills, CA
-
- 55Less than $100
- 11$300 to $349
- 24$500 to $549
- 36$550 to $599
- 30$750 to $799
- 42$800 to $899
- 10$900 to $999
- 253$1,000 to $1,249
- 95$1,250 to $1,499
- 1,000$1,500 to $1,999
- 3,298$2,000 to $2,499
- 2,070$2,500 to $2,999
- 681$3,000 to $3,499
- 227$3,500 or more
- 340No cash rent


Percentage of workers working in this county: 52.5%
Number of people working at home: 7,158 (18.3% of all workers)
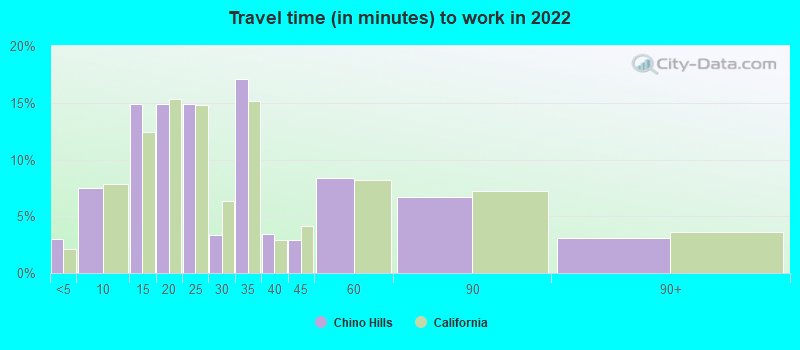
Travel time to work (commute)
- Less than 5 minutes: 230
- 5 to 9 minutes: 1,365
- 10 to 14 minutes: 2,827
- 15 to 19 minutes: 2,587
- 20 to 24 minutes: 3,451
- 25 to 29 minutes: 1,223
- 30 to 34 minutes: 4,984
- 35 to 39 minutes: 2,312
- 40 to 44 minutes: 2,201
- 45 to 59 minutes: 4,459
- 60 to 89 minutes: 3,689
- 90 or more minutes: 2,016
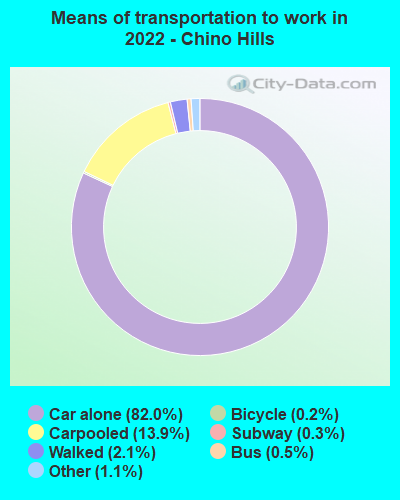
Means of transportation to work:
- Drove a car alone: 13,558 (58.8%)
- Carpooled: 2,463 (10.7%)
- Bus: 77 (0.3%)
- Long-distance train or commuter rail: 29 (0.1%)
- Taxi: 205 (0.9%)
- Bicycle: 23 (0.1%)
- Walked: 382 (1.7%)
- Worked at home: 7,158 (31.0%)

- Unemployment by race in 2022
- Unemployment rate for White non-Hispanic residents
- 2.5%Males
- 2.3%Females
- Unemployment rate for Black residents
- 4.2%Males
- 14.4%Females
- Unemployment rate for Asian residents
- 6.5%Males
- 5.9%Females
- Unemployment rate for other race residents
- 8.2%Males
- 3.5%Females
- Unemployment rate for two or more race residents
- 7.3%Males
- 7.2%Females
- Unemployment rate for Hispanic or Latino residents
- 5.9%Males
- 6.8%Females

- Year of entry for the foreign-born population in Chino Hills, California
- 8,0902010 or later
- 4,3402000 to 2009
- 4,6441990 to 1999
- 5,5891980 to 1989
- 4,1021970 to 1979
- 1,977Before 1970

First ancestries reported:
- German: 1,383 (2.7%)
- English: 1,091 (2.2%)
- Irish: 994 (2.0%)
- American: 894 (1.8%)
- European: 584 (1.2%)
- Nigerian: 501 (1.0%)
- Italian: 460 (0.9%)
- Egyptian: 308 (0.6%)
- Eastern European: 273 (0.5%)
- Iranian: 234 (0.5%)
- French: 179 (0.4%)
- British: 166 (0.3%)
- Armenian: 144 (0.3%)
- Greek: 124 (0.2%)
- Arab: 123 (0.2%)
- Portuguese: 120 (0.2%)
- Ethiopian: 118 (0.2%)
- Dutch: 113 (0.2%)
- Russian: 107 (0.2%)
- Norwegian: 103 (0.2%)
- French Canadian: 103 (0.2%)
- Serbian: 95 (0.2%)
- Polish: 92 (0.2%)
- Slovak: 88 (0.2%)
- African: 87 (0.2%)
- Scottish: 84 (0.2%)
- Swedish: 80 (0.2%)
- Northern European: 67 (0.1%)
- Lebanese: 66 (0.1%)
- Swiss: 60 (0.1%)
- Danish: 52 (0.1%)
- Brazilian: 51 (0.1%)
- Canadian: 39 (0.08%)
- Scotch-Irish: 38 (0.08%)
- Palestinian: 37 (0.07%)
- Estonian: 33 (0.07%)
- Bulgarian: 25 (0.05%)
- Syrian: 23 (0.05%)
- Austrian: 22 (0.04%)
- Basque: 18 (0.04%)
- Ukrainian: 18 (0.04%)
- Scandinavian: 17 (0.03%)
- Hungarian: 16 (0.03%)
- Welsh: 12 (0.02%)
- Romanian: 10 (0.02%)
- Belgian: 10 (0.02%)
- Jamaican: 9 (0.02%)
- Czech: 8 (0.02%)
- Australian: 6 (0.01%)
Most common places of birth for foreign-born residents (%):
| Chino Hills: | 29.3% (7,406) |
| California: | 6.6% (684,672) |
| Chino Hills: | 12.4% (3,130) |
| California: | 7.8% (818,297) |
| Chino Hills: | 9.9% (2,507) |
| California: | 37.2% (3,881,193) |
| Chino Hills: | 9.0% (2,286) |
| California: | 3.0% (315,248) |
| Chino Hills: | 8.9% (2,251) |
| California: | 1.7% (176,274) |
| Chino Hills: | 4.2% (1,063) |
| California: | 5.2% (539,184) |
| Chino Hills: | 3.4% (870) |
| California: | 1.0% (105,215) |
| Chino Hills: | 2.6% (659) |
| California: | 4.9% (512,335) |
Place of birth for U.S.-born residents:
- This state: 43,866
- Other state: 5,825
- Northeast: 1,827
- Midwest: 2,021
- South: 1,114
- West: 863
88.7% of Chino Hills residents lived in the same house 1 years ago.
Out of people who lived in different houses, 24.7% lived in this county.
Out of people who lived in different counties, 78.5% lived in California.
| Chino Hills: | 88.7% |
| State average: | 88.9% |
Education attainment for males 25 years and older:
- No schooling: 673
- Nursery to 4th grade: 51
- 5th and 6th grade: 352
- 7th and 8th grade: 40
- 9th grade: 371
- 10th grade: 280
- 11th grade: 37
- 12th grade, no diploma: 356
- High school graduate (or equivalency): 4,793
- Less than 1 year of college: 894
- Some college more than 1 year, no degree: 3,870
- Associate degree: 2,452
- Bachelor's degree: 6,943
- Master's degree: 2,769
- Professional school degree: 845
- Doctorate degree: 817

Education attainment for females 25 years and older:
- No schooling: 650
- Nursery to 4th grade: 102
- 5th and 6th grade: 624
- 7th and 8th grade: 179
- 9th grade: 572
- 10th grade: 103
- 11th grade: 185
- 12th grade, no diploma: 698
- High school graduate (or equivalency): 6,313
- Less than 1 year of college: 2,011
- Some college more than 1 year, no degree: 3,237
- Associate degree: 3,724
- Bachelor's degree: 7,970
- Master's degree: 2,828
- Professional school degree: 502
- Doctorate degree: 423

Housing units in structures:
- One, detached: 19,288
- One, attached: 1,117
- Two: 279
- 3 or 4: 742
- 5 to 9: 858
- 10 to 19: 683
- 20 to 49: 328
- 50 or more: 598
- Mobile homes: 1,161
Median worth of mobile homes: $49,000
House/condo owner moved in on average 16 years ago
Renter moved in on average 3 years ago

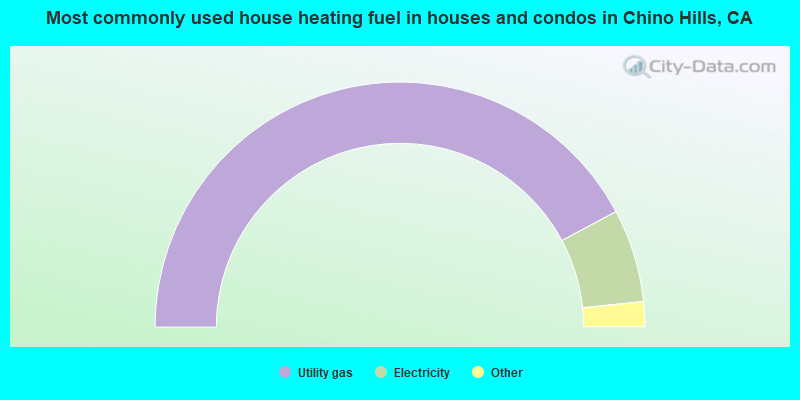
- 84.4%Utility gas
- 12.3%Electricity
- 1.9%Bottled, tank, or LP gas
- 0.9%Solar energy
- 0.3%No fuel used
- 0.1%Other fuel
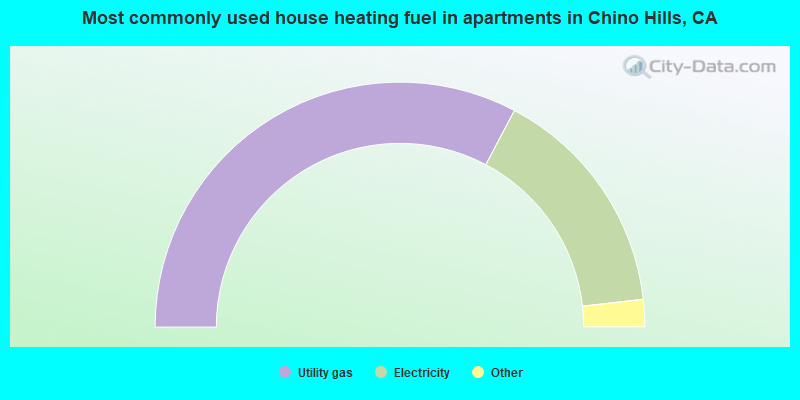
- 65.5%Utility gas
- 30.9%Electricity
- 3.3%Bottled, tank, or LP gas
- 0.3%No fuel used
Private vs. public school enrollment:
| Here: | 19.4% |
| California: | 10.5% |
| Here: | 1.5% |
| California: | 8.5% |
| Here: | 12.1% |
| California: | 15.9% |