Jump to a detailed profile or search site with Google Custom Search

Chuckwalla, CA (California) Houses and Residents

Estimated median house or condo value in 2022: $292,099 (it was $71,000 in 2000)
Chuckwalla:

$292,099
California:

$715,900
Lower value quartile - upper value quartile: $253,432 - $338,114

Total population: 14,948 (Urban population: 8,348 (all inside urban clusters), Rural population: 2,988 (4 farm, 2,984 nonfarm))

Houses: 2,876 (965 occupied: 680 owner occupied, 285 renter occupied)

% of renters here:

30%
State:

44%

Housing density: 1 houses/condos per square mile

Median price asked for vacant for-sale houses and condos in 2022 in this county: $550,307.

Median contract rent in 2022: $654 (lower quartile is $356, upper quartile is $1,208)


Median rent asked for vacant for-rent units in 2022: $1,411


Median gross rent in Chuckwalla, CA in 2022: $1,017

Housing units in Chuckwalla with a mortgage: 204 (14 second mortgage, 32 home equity loan, 0 both second mortgage and home equity loan)
Houses without a mortgage: 168

Compare current foreclosures near your location:

Check out more offers near your location.
Powered by Foreclosure.com


Chuckwalla, California Age and Sex of Residents

Household type by relationship:

Households: 2,153,812
  • In family households: 1,916,707 (357,691 male householders, 152,550 female householders)
    376,381 spouses, 728,028 children (675,451 natural, 15,499 adopted, 37,078 stepchildren), 69,455 grandchildren, 34,232 brothers or sisters, 33,896 parents, foster children, 57,727 other relatives, 76,462 non-relatives
  • In nonfamily households: 237,105 (84,686 male householders (58,397 living alone)), 91,333 female householders (74,097 living alone)), 61,086 nonrelatives
  • In group quarters: 35,829 (20,862 institutionalized population)

308,692 married couples with children.
98,911 single-parent households (26,262 men, 72,649 women).

58.8% of residents of Chuckwalla speak English at home.
37.8% of residents speak Spanish at home (57% speak English very well, 24% speak English well, 11% speak English not well, 8% don't speak English at all).
1.1% of residents speak other Indo-European language at home (100% speak English very well).
2.0% of residents speak Asian or Pacific Island language at home (40% speak English very well, 52% speak English well, 8% speak English not well).
0.3% of residents speak other language at home (45% speak English very well, 55% speak English not well).

Foreign born population: 3,749 (20.7%)
(32.8% of them are naturalized citizens)

Median number of rooms in houses and condos:
Here:

4.9
State:

6.0

Median number of rooms in apartments
Here:

5.7
State:

3.9

Owner-occupied Renter-occupied
Bedrooms in owner-occupied houses and condos in Chuckwalla, California
  • Bedrooms in owner-occupied houses and condos in Chuckwalla, California
  • 6no bedroom
  • 931 bedroom
  • 3302 bedrooms
  • 2163 bedrooms
  • 334 bedrooms
  • 25+ bedrooms
Bedrooms in renter-occupied apartments in Chuckwalla, California
  • Bedrooms in renter-occupied apartments in Chuckwalla, California
  • 25no bedroom
  • 201 bedroom
  • 832 bedrooms
  • 1383 bedrooms
  • 154 bedrooms
  • 45+ bedrooms
Owner-occupied Renter-occupied
Cars and other vehicles available in Chuckwalla in owner-occupied houses/condos
  • Cars and other vehicles available in Chuckwalla in owner-occupied houses/condos
  • 37no vehicle
  • 2071 vehicle
  • 2762 vehicles
  • 1193 vehicles
  • 364 vehicles
  • 55+ vehicles
Cars and other vehicles available in Chuckwalla in renter-occupied apartments
  • Cars and other vehicles available in Chuckwalla in renter-occupied apartments
  • 38no vehicle
  • 1111 vehicle
  • 1012 vehicles
  • 293 vehicles
  • 64 vehicles
  • 05+ vehicles
Owner-occupied Renter-occupied
Rooms in owner-occupied houses in Chuckwalla, California
  • Rooms in owner-occupied houses in Chuckwalla, California
  • 01 room
  • 232 rooms
  • 1033 rooms
  • 1904 rooms
  • 2005 rooms
  • 1266 rooms
  • 237 rooms
  • 58 rooms
  • 109+ rooms
Rooms in renter-occupied apartments in Chuckwalla, California
  • Rooms in renter-occupied apartments in Chuckwalla, California
  • 101 room
  • 252 rooms
  • 333 rooms
  • 484 rooms
  • 1145 rooms
  • 396 rooms
  • 97 rooms
  • 78 rooms
  • 09+ rooms
Year house built
Breakdown of mean house values by ages of householders
Owners and renters by unit type in Chuckwalla, CA
  • Chuckwalla, CA household income distribution

  • Distribution of median household income in Chuckwalla, CA in 2022
  • 22,648Less than $10,000
  • 25,612$10,000 to $19,999
  • 30,913$20,000 to $29,999
  • 32,847$30,000 to $39,999
  • 32,440$40,000 to $49,999
  • 33,361$50,000 to $59,999
  • 46,713$60,000 to $74,999
  • 69,125$75,000 to $99,999
  • 59,488$100,000 to $124,999
  • 45,499$125,000 to $149,999
  • 58,132$150,000 to $199,999
  • 60,830$200,000 or more

Percentage of workers working in this county: 90.8%
Number of people working at home: 203 (11.7% of all workers)

Travel time to work (commute)

  • Less than 5 minutes: 116
  • 5 to 9 minutes: 90
  • 10 to 14 minutes: 151
  • 15 to 19 minutes: 195
  • 20 to 24 minutes: 90
  • 25 to 29 minutes: 32
  • 30 to 34 minutes: 174
  • 35 to 39 minutes: 2
  • 40 to 44 minutes: 21
  • 45 to 59 minutes: 21
  • 60 to 89 minutes: 7
  • 90 or more minutes: 0

Means of transportation to work:

  • Drove a car alone: 577 (62.9%)
  • Carpooled: 236 (25.7%)
  • Bus or trolley bus: 4 (0.4%)
  • Motorcycle: 4 (0.4%)
  • Walked: 52 (5.7%)
  • Other means: 26 (2.8%)
  • Worked at home: 19 (2.1%)
Class of Workers in 2000
Year of entry for the foreign-born population in Chuckwalla, California
  • Year of entry for the foreign-born population in Chuckwalla, California
  • 1621995 to March 2000
  • 3021990 to 1994
  • 4601985 to 1989
  • 4231980 to 1984
  • 2811975 to 1979
  • 2581970 to 1974
  • 511965 to 1969
  • 88Before 1965

Most common places of birth for foreign-born residents (%):

Mexico
Chuckwalla:

75.9% (1,537)
California:

44.3% (3,928,701)

Guatemala
Chuckwalla:

3.8% (76)
California:

2.4% (211,458)

Vietnam
Chuckwalla:

3.4% (68)
California:

4.7% (418,249)

El Salvador
Chuckwalla:

2.4% (48)
California:

4.1% (359,673)

Other Eastern Africa
Chuckwalla:

1.8% (37)
California:

0.2% (20,704)

Iran
Chuckwalla:

1.8% (36)
California:

1.8% (158,613)

Philippines
Chuckwalla:

1.5% (31)
California:

7.5% (664,935)

Cuba
Chuckwalla:

1.5% (31)
California:

0.5% (41,065)

Canada
Chuckwalla:

1.5% (31)
California:

1.6% (141,181)

Place of birth for U.S.-born residents:

  • This state: 6,538
  • Other state: 2,667
  • Northeast: 443
  • Midwest: 808
  • South: 1,056
  • West: 360

43% of Chuckwalla residents lived in the same house 5 years ago.
   Out of people who lived in different houses, 25% lived in this county.
   Out of people who lived in different counties, 95% lived in California.

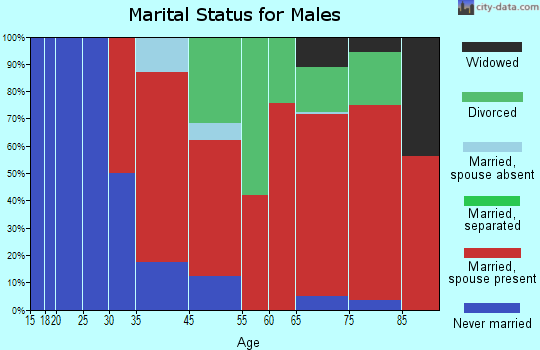
Education attainment for males 25 years and older:

  • No schooling: 370
  • Nursery to 4th grade: 60
  • 5th and 6th grade: 235
  • 7th and 8th grade: 158
  • 9th grade: 350
  • 10th grade: 669
  • 11th grade: 926
  • 12th grade, no diploma: 767
  • High school graduate (or equivalency): 2,514
  • Less than 1 year of college: 491
  • Some college more than 1 year, no degree: 729
  • Associate degree: 369
  • Bachelor's degree: 202
  • Master's degree: 73
  • Professional school degree: 17
  • Doctorate degree: 9
Educational Attainment for Males

Education attainment for females 25 years and older:

  • No schooling: 14
  • Nursery to 4th grade: 8
  • 5th and 6th grade: 58
  • 7th and 8th grade: 48
  • 9th grade: 43
  • 10th grade: 25
  • 11th grade: 21
  • 12th grade, no diploma: 55
  • High school graduate (or equivalency): 201
  • Less than 1 year of college: 70
  • Some college more than 1 year, no degree: 85
  • Associate degree: 45
  • Bachelor's degree: 131
  • Master's degree: 8
  • Professional school degree: 0
  • Doctorate degree: 9
Educational Attainment for Females
Chuckwalla marital status for males
Chuckwalla marital status for females

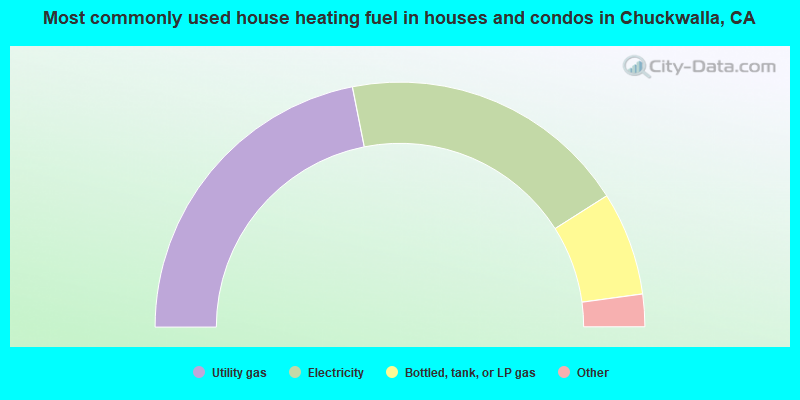
Housing units in structures:

  • One, detached: 912
  • One, attached: 17
  • Two: 16
  • 3 or 4: 7
  • Mobile homes: 1,844
  • Boats, RVs, vans, etc.: 80

Median worth of mobile homes: $162,590

Housing units lacking complete plumbing facilities: 2.6%

Housing units lacking complete kitchen facilities: 3.4%
Year householders moved into residence in Chuckwalla
Houses and condos Apartments
Most commonly used house heating fuel in houses and condos in Chuckwalla, CA
  • 43.8%Utility gas
  • 38.2%Electricity
  • 13.7%Bottled, tank, or LP gas
  • 2.1%Other fuel
  • 1.2%No fuel used
  • 1.0%Wood
Most commonly used house heating fuel in apartments in Chuckwalla, CA
  • 49.8%Electricity
  • 40.0%Utility gas
  • 8.4%Bottled, tank, or LP gas
  • 1.8%No fuel used

Private vs. public school enrollment:

Students in private schools in grades 1 to 8 (elementary and middle school): 18
Here:

5.4%
California:

9.9%

Students in private schools in grades 9 to 12 (high school): 93
Here:

15.4%
California:

7.8%

Students in private undergraduate colleges: 101
Here:

16.3%
California:

15.4%
School Enrollment by Level of School for Male Students
School Enrollment by Level of School for Female Students
Age and Sex of Sensory-Disabled Noninstitutionalized Residents
Age and Sex of Physically-Disabled Noninstitutionalized Residents
Age and Sex of Mentally-Disabled Noninstitutionalized Residents
Age and Sex of Self-Care Disabled Noninstitutionalized Residents
Age and Sex of Go-Outside-Home Disabled Noninstitutionalized Residents
Age and Sex of Noninstitutionalized Residents with Employment Disability