Columbia, CT (Connecticut) Houses and Residents
| Columbia: | $350,443 |
| Connecticut: | $347,200 |
Total population: 5,485 (Urban population: 0, Rural population: 4,971 (38 farm, 4,933 nonfarm))
Houses: 1,988 (1,864 occupied: 1,710 owner occupied, 154 renter occupied)
| % of renters here: | 8% |
| State: | 34% |
Housing density: 93 houses/condos per square mile
Median price asked for vacant for-sale houses and condos in 2022 in this county: $251,692.
Median contract rent in 2022: $1,293 (lower quartile is $938, upper quartile is $1,703)
Median rent asked for vacant for-rent units in 2022: $935
Median gross rent in Columbia, CT in 2022: $1,563
Housing units in Columbia with a mortgage: 1,127 (106 second mortgage, 234 home equity loan, 19 both second mortgage and home equity loan)
Houses without a mortgage: 406
Compare current foreclosures near Columbia, CT:
| Photo | Address | Area | Beds / Baths | Price | Details |
|---|---|---|---|---|---|

|
#1
Connecticut Route 87
Columbia, CT 06237
|
1,796 sq. feet
|
1 baths 3 beds |
show details | |

|
#2
Route 66 E
Columbia, CT 06237
|
- sq. feet
|
- baths - beds |
show details | |

|
#3
Talcott Ave
Vernon Rockville, CT 06066
|
1,832 sq. feet
|
2 baths 4 beds |
$148,000
|
show details |

|
#4
N Society Rd
Canterbury, CT 06331
|
768 sq. feet
|
1 baths 2 beds |
$269,900
|
show details |

|
#5
Spring St
Glastonbury, CT 06033
|
1,284 sq. feet
|
1 baths 3 beds |
$296,400
|
show details |

|
#6
Westchester Rd
Colchester, CT 06415
|
900 sq. feet
|
1 baths 2 beds |
$309,900
|
show details |

|
#7
Shares Ln
South Windsor, CT 06074
|
1,850 sq. feet
|
2 baths 4 beds |
$385,000
|
show details |

|
#8
Lake Dr E
Oakdale, CT 06370
|
1,346 sq. feet
|
1 baths 3 beds |
$365,000
|
show details |

|
#9
Irving St
Manchester, CT 06042
|
1,335 sq. feet
|
2 baths 3 beds |
$265,000
|
show details |

|
#10
Mansfield Ave
Willimantic, CT 06226
|
920 sq. feet
|
1 baths 3 beds |
show details |
| Photo | Address | Area | Beds / Baths | Price | Details |
|---|---|---|---|---|---|

|
#11
Circle Dr
Mansfield Center, CT 06250
|
1,152 sq. feet
|
1 baths 3 beds |
show details | |

|
#12
Hope Valley Rd
Amston, CT 06231
|
2,128 sq. feet
|
2 baths 3 beds |
show details | |

|
#13
Anthony Rd
Tolland, CT 06084
|
1,584 sq. feet
|
3 baths 4 beds |
show details | |

|
#14
Park Rd
Marlborough, CT 06447
|
1,134 sq. feet
|
1 baths 3 beds |
show details | |

|
#15
Bell Ct Apt C1
East Hartford, CT 06108
|
890 sq. feet
|
1 baths 2 beds |
show details | |

|
#16
Llynwood Dr
Bolton, CT 06043
|
1,335 sq. feet
|
1 baths 4 beds |
show details | |

|
#17
Oakland Rd
South Windsor, CT 06074
|
1,040 sq. feet
|
1 baths 2 beds |
show details | |

|
#18
Boswell Ave
Norwich, CT 06360
|
2,244 sq. feet
|
4 baths 4 beds |
show details | |

|
#19
Broad St
Norwich, CT 06360
|
1,703 sq. feet
|
1 baths 4 beds |
show details | |

|
#20
Boswell Ave
Norwich, CT 06360
|
1,768 sq. feet
|
2 baths 4 beds |
show details |
| Photo | Address | Area | Beds / Baths | Price | Details |
|---|---|---|---|---|---|

|
#21
Deepwood Dr
Manchester, CT 06040
|
734 sq. feet
|
1 baths 2 beds |
show details | |

|
#22
Ferncrest Dr
East Hartford, CT 06118
|
1,890 sq. feet
|
3 baths 4 beds |
show details | |

|
#23
Lake Dr E
Oakdale, CT 06370
|
1,371 sq. feet
|
2 baths 3 beds |
show details | |

|
#24
Talcottville Rd Apt 7
Vernon Rockville, CT 06066
|
1,018 sq. feet
|
1 baths 2 beds |
show details | |

|
#25
Foster St
South Windsor, CT 06074
|
2,500 sq. feet
|
2 baths 3 beds |
show details | |

|
#26
Curry Ln
East Hampton, CT 06424
|
2,066 sq. feet
|
2 baths 3 beds |
show details | |

|
#27
Center St
Manchester, CT 06040
|
1,008 sq. feet
|
1 baths 3 beds |
show details | |

|
#28
Old Town Rd Unit 75
Vernon Rockville, CT 06066
|
1,292 sq. feet
|
1 baths 2 beds |
show details | |

|
#29
Old Acres Rd
Moodus, CT 06469
|
996 sq. feet
|
1 baths 2 beds |
show details | |

|
#30
Baltic Rd
Norwich, CT 06360
|
2,318 sq. feet
|
2 baths 6 beds |
show details |
| Photo | Address | Area | Beds / Baths | Price | Details |
|---|---|---|---|---|---|

|
#31
Conestoga Way
Glastonbury, CT 06033
|
1,360 sq. feet
|
2 baths 3 beds |
show details | |

|
#32
Johnson Rd
Tolland, CT 06084
|
1,056 sq. feet
|
1 baths 1 beds |
show details | |

|
#33
Kelly Rd
South Windsor, CT 06074
|
1,514 sq. feet
|
1 baths 3 beds |
show details | |

|
#34
Sholes Ave
Norwich, CT 06360
|
1,362 sq. feet
|
1 baths 3 beds |
show details | |

|
#35
Hayes Rd
East Hampton, CT 06424
|
1,152 sq. feet
|
1 baths 3 beds |
show details | |

|
#36
Kathleen Way
Manchester, CT 06042
|
1,402 sq. feet
|
1 baths 3 beds |
show details | |

|
#37
Avery St
South Windsor, CT 06074
|
1,957 sq. feet
|
1 baths 3 beds |
show details | |

|
#38
Joan Cir
Manchester, CT 06040
|
1,856 sq. feet
|
2 baths 3 beds |
show details | |

|
#39
Howard Dr
Vernon Rockville, CT 06066
|
3,270 sq. feet
|
4 baths 5 beds |
show details | |

|
#40
Diane Dr
South Windsor, CT 06074
|
1,534 sq. feet
|
1 baths 3 beds |
show details |
| Photo | Address | Area | Beds / Baths | Price | Details |
|---|---|---|---|---|---|

|
#41
N Main St Unit 32
East Hampton, CT 06424
|
1,040 sq. feet
|
1 baths 2 beds |
show details | |

|
#42
Thompson Rd # 2g
Manchester, CT 06040
|
734 sq. feet
|
1 baths 1 beds |
show details | |

|
#43
Mckinley St
Manchester, CT 06040
|
1,238 sq. feet
|
1 baths 2 beds |
show details | |

|
#44
Homestead St
Manchester, CT 06042
|
1,403 sq. feet
|
1 baths 2 beds |
show details | |

|
#45
Woodland St
Manchester, CT 06042
|
1,888 sq. feet
|
2 baths 5 beds |
show details | |

|
#46
Maiden Ln
Vernon Rockville, CT 06066
|
1,665 sq. feet
|
2 baths 5 beds |
show details | |

|
#47
Shenipsit Lake Rd
Tolland, CT 06084
|
1,623 sq. feet
|
1 baths 3 beds |
show details | |

|
#48
Burke St
East Hartford, CT 06118
|
1,058 sq. feet
|
1 baths 3 beds |
show details | |

|
#49
Mulcahy Dr
East Hartford, CT 06118
|
1,703 sq. feet
|
1 baths 3 beds |
show details | |

|
Check over 1 million property listings on Foreclosure.com!
|
browse all offers | |||
Latest news about housing in Columbia, CT collected exclusively by city-data.com from local newspapers, TV, and radio stations

 | Current Real estate markets (3987 replies) |
| Considering a move back to CT and I want to buy a house (53 replies) |
| 2024 Connecticut Town Tournament VI (Celebrating the 10-Year Anniversary & Dazzleman's Memorial) (746 replies) |
| Another billionaire leaves Connecticut (67 replies) |
| CT 2022 governor election (716 replies) |
| Metro Hartford Development (2393 replies) |

Household type by relationship:
Households: 136,574- In family households: 112,649 (26,574 male householders, 10,133 female householders)
29,922 spouses, 38,844 children (36,460 natural, 1,015 adopted, 1,369 stepchildren), 1,606 grandchildren, 688 brothers or sisters, 931 parents, foster children, 693 other relatives, 2,519 non-relatives
- In nonfamily households: 23,925 (8,485 male householders (5,980 living alone)), 9,285 female householders (7,198 living alone)), 6,155 nonrelatives
- In group quarters: 16,117 (4,028 institutionalized population)
24,754 married couples with children.
5,247 single-parent households (1,309 men, 3,938 women).
92.9% of residents of Columbia speak English at home.
2.4% of residents speak Spanish at home (58% speak English very well, 32% speak English well, 4% speak English not well, 6% don't speak English at all).
4.2% of residents speak other Indo-European language at home (87% speak English very well, 13% speak English well).
0.5% of residents speak other language at home (48% speak English very well, 52% speak English well).
Foreign born population: 487 (8.1%)
(90.3% of them are naturalized citizens)
| Here: | 7.2 |
| State: | 6.5 |
| Here: | 4.7 |
| State: | 4.0 |

- Bedrooms in owner-occupied houses and condos in Columbia, Connecticut
- 0no bedroom
- 381 bedroom
- 3082 bedrooms
- 1,0383 bedrooms
- 3124 bedrooms
- 145+ bedrooms

- Bedrooms in renter-occupied apartments in Columbia, Connecticut
- 6no bedroom
- 241 bedroom
- 522 bedrooms
- 533 bedrooms
- 134 bedrooms
- 65+ bedrooms

- Cars and other vehicles available in Columbia in owner-occupied houses/condos
- 27no vehicle
- 3681 vehicle
- 8432 vehicles
- 3473 vehicles
- 844 vehicles
- 415+ vehicles

- Cars and other vehicles available in Columbia in renter-occupied apartments
- 13no vehicle
- 581 vehicle
- 632 vehicles
- 103 vehicles
- 44 vehicles
- 65+ vehicles

- Rooms in owner-occupied houses in Columbia, Connecticut
- 01 room
- 02 rooms
- 133 rooms
- 1174 rooms
- 2325 rooms
- 5116 rooms
- 4237 rooms
- 2428 rooms
- 1729+ rooms

- Rooms in renter-occupied apartments in Columbia, Connecticut
- 61 room
- 02 rooms
- 143 rooms
- 364 rooms
- 475 rooms
- 206 rooms
- 217 rooms
- 48 rooms
- 69+ rooms


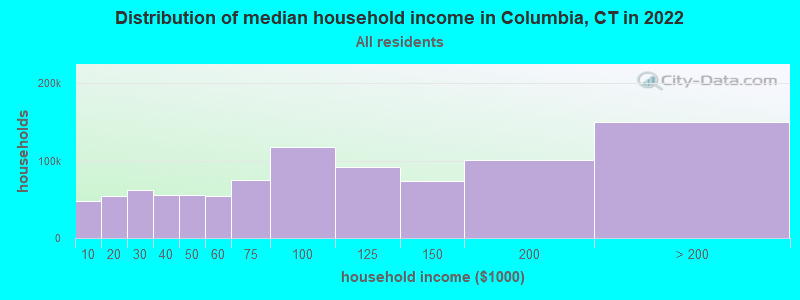
Columbia, CT household income distribution

- 5,311Less than $10,000
- 4,311$10,000 to $19,999
- 6,741$20,000 to $29,999
- 8,693$30,000 to $39,999
- 7,038$40,000 to $49,999
- 8,527$50,000 to $59,999
- 16,503$60,000 to $74,999
- 23,842$75,000 to $99,999
- 22,739$100,000 to $124,999
- 18,330$125,000 to $149,999
- 26,386$150,000 to $199,999
- 48,520$200,000 or more
Percentage of workers working in this county: 35.1%
Number of people working at home: 581 (18.8% of all workers)
Travel time to work (commute)
- Less than 5 minutes: 46
- 5 to 9 minutes: 184
- 10 to 14 minutes: 286
- 15 to 19 minutes: 231
- 20 to 24 minutes: 250
- 25 to 29 minutes: 229
- 30 to 34 minutes: 402
- 35 to 39 minutes: 152
- 40 to 44 minutes: 220
- 45 to 59 minutes: 347
- 60 to 89 minutes: 145
- 90 or more minutes: 55
Means of transportation to work:
- Drove a car alone: 2,259 (85.6%)
- Carpooled: 243 (9.2%)
- Bus or trolley bus: 12 (0.5%)
- Walked: 28 (1.1%)
- Other means: 5 (0.2%)
- Worked at home: 93 (3.5%)


- Year of entry for the foreign-born population in Columbia, Connecticut
- 411995 to March 2000
- 551990 to 1994
- 321985 to 1989
- 01980 to 1984
- 01975 to 1979
- 161970 to 1974
- 221965 to 1969
- 127Before 1965

First ancestries reported:
- Irish: 1,040 (16.0%)
- English: 822 (12.6%)
- Italian: 734 (11.3%)
- French: 677 (10.4%)
- German: 629 (9.7%)
- Polish: 432 (6.6%)
- Other: 396 (6.1%)
- French Canadian: 376 (5.8%)
- United States: 240 (3.7%)
- Swedish: 190 (2.9%)
- Russian: 159 (2.4%)
- Scotch-Irish: 147 (2.3%)
- Greek: 134 (2.1%)
- Ukrainian: 117 (1.8%)
- Scottish: 94 (1.4%)
- Lithuanian: 57 (0.9%)
- Danish: 48 (0.7%)
- Portuguese: 46 (0.7%)
- Hungarian: 38 (0.6%)
- Czech: 31 (0.5%)
- Swiss: 28 (0.4%)
- Dutch: 23 (0.4%)
- Norwegian: 21 (0.3%)
- Slovak: 16 (0.2%)
- Arab: 14 (0.2%)
Most common places of birth for foreign-born residents (%):
| Columbia: | 16.7% (49) |
| Connecticut: | 2.1% (7,612) |
| Columbia: | 11.3% (33) |
| Connecticut: | 1.5% (5,508) |
| Columbia: | 8.9% (26) |
| Connecticut: | 7.0% (26,023) |
| Columbia: | 7.8% (23) |
| Connecticut: | 4.4% (16,395) |
| Columbia: | 6.5% (19) |
| Connecticut: | 5.2% (19,083) |
| Columbia: | 5.5% (16) |
| Connecticut: | 1.4% (5,021) |
| Columbia: | 4.4% (13) |
| Connecticut: | 0.5% (1,894) |
| Columbia: | 4.4% (13) |
| Connecticut: | 2.1% (7,596) |
| Columbia: | 4.4% (13) |
| Connecticut: | 2.5% (9,358) |
| Columbia: | 4.1% (12) |
| Connecticut: | 1.0% (3,822) |
| Columbia: | 4.1% (12) |
| Connecticut: | 0.3% (1,032) |
| Columbia: | 2.7% (8) |
| Connecticut: | 1.2% (4,344) |
| Columbia: | 2.7% (8) |
| Connecticut: | 1.1% (3,919) |
| Columbia: | 2.7% (8) |
| Connecticut: | 2.3% (8,500) |
| Columbia: | 2.4% (7) |
| Connecticut: | 0.3% (1,286) |
| Columbia: | 2.4% (7) |
| Connecticut: | 1.7% (6,181) |
| Columbia: | 2.0% (6) |
| Connecticut: | 0.4% (1,374) |
| Columbia: | 1.7% (5) |
| Connecticut: | 3.6% (13,234) |
| Columbia: | 1.7% (5) |
| Connecticut: | 0.7% (2,646) |
| Columbia: | 1.7% (5) |
| Connecticut: | 0.1% (554) |
| Columbia: | 1.7% (5) |
| Connecticut: | 0.4% (1,475) |
Place of birth for U.S.-born residents:
- This state: 3,467
- Other state: 1,194
- Northeast: 870
- Midwest: 102
- South: 164
- West: 58
72% of Columbia residents lived in the same house 5 years ago.
Out of people who lived in different houses, 44% lived in this county.
Out of people who lived in different counties, 77% lived in Connecticut.
Education attainment for males 25 years and older:
- No schooling: 12
- Nursery to 4th grade: 0
- 5th and 6th grade: 6
- 7th and 8th grade: 26
- 9th grade: 0
- 10th grade: 28
- 11th grade: 13
- 12th grade, no diploma: 25
- High school graduate (or equivalency): 505
- Less than 1 year of college: 142
- Some college more than 1 year, no degree: 201
- Associate degree: 82
- Bachelor's degree: 366
- Master's degree: 136
- Professional school degree: 50
- Doctorate degree: 27

Education attainment for females 25 years and older:
- No schooling: 12
- Nursery to 4th grade: 0
- 5th and 6th grade: 0
- 7th and 8th grade: 15
- 9th grade: 0
- 10th grade: 14
- 11th grade: 7
- 12th grade, no diploma: 43
- High school graduate (or equivalency): 533
- Less than 1 year of college: 133
- Some college more than 1 year, no degree: 250
- Associate degree: 137
- Bachelor's degree: 400
- Master's degree: 198
- Professional school degree: 36
- Doctorate degree: 18


Housing units in structures:
- One, detached: 1,870
- One, attached: 48
- Two: 40
- 3 or 4: 30

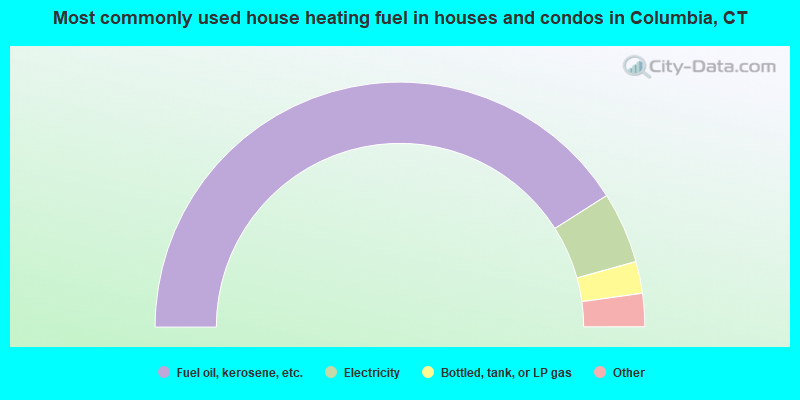
- 81.9%Fuel oil, kerosene, etc.
- 9.4%Electricity
- 4.2%Bottled, tank, or LP gas
- 4.0%Wood
- 0.5%Utility gas
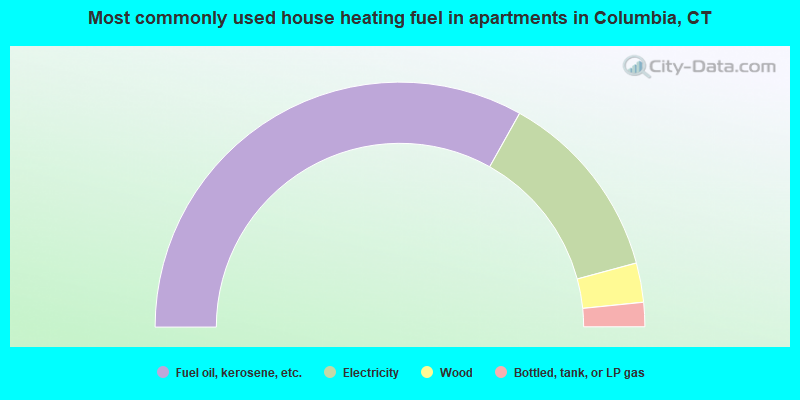
- 66.2%Fuel oil, kerosene, etc.
- 25.3%Electricity
- 5.2%Wood
- 3.2%Bottled, tank, or LP gas
Private vs. public school enrollment:
| Here: | 7.2% |
| Connecticut: | 9.9% |
| Here: | 9.4% |
| Connecticut: | 11.0% |
| Here: | 5.5% |
| Connecticut: | 33.4% |


