Colville Reservation, WA (Washington) Houses and Residents
| Colville Reservation: | $268,090 |
| Washington: | $569,500 |
Total population: 1,685 (Urban population: 0, Rural population: 1,666 (75 farm, 1,591 nonfarm))
Houses: 894 (623 occupied: 419 owner occupied, 204 renter occupied)
| % of renters here: | 33% |
| State: | 36% |
Housing density: 1 houses/condos per square mile
Median price asked for vacant for-sale houses and condos in 2022 in this county: $163,412.
Median contract rent in 2022: $215 (lower quartile is $192, upper quartile is $397)
Median rent asked for vacant for-rent units in 2022: $617
Median gross rent in Colville Reservation, WA in 2022: $416
Housing units in Colville Reservation with a mortgage: 85 (2 second mortgage, 0 home equity loan, 0 both second mortgage and home equity loan)
Houses without a mortgage: 78
Compare current foreclosures near your location:
| Photo | Address | Area | Beds / Baths | Price | Details |
|---|---|---|---|---|---|

|
#1
E 21st Ave
Columbus, OH 43211
|
1,061 sq. feet
|
1 baths 3 beds |
$179,900
|
show details |

|
#2
S High St
Columbus, OH 43207
|
1,678 sq. feet
|
2 baths 4 beds |
$27,500
|
show details |

|
#3
Delcastle Loop
Grove City, OH 43123
|
2,220 sq. feet
|
3 baths 3 beds |
show details | |

|
#4
Sandalwood Blvd
Columbus, OH 43229
|
1,161 sq. feet
|
2 baths 3 beds |
show details | |

|
#5
Big Walnut Dr
Groveport, OH 43125
|
1,028 sq. feet
|
1 baths 3 beds |
show details | |

|
#6
Western Hill Rd
Columbus, OH 43223
|
896 sq. feet
|
2 baths 4 beds |
show details | |

|
#7
Jane Ave
Columbus, OH 43219
|
1,491 sq. feet
|
2 baths 3 beds |
show details | |

|
#8
Delhi Ave
Columbus, OH 43202
|
1,344 sq. feet
|
2 baths 2 beds |
show details | |

|
#9
Fayburrow Dr
Reynoldsburg, OH 43068
|
1,528 sq. feet
|
3 baths 4 beds |
show details | |

|
#10
Edgeview Rd
Columbus, OH 43207
|
1,700 sq. feet
|
1 baths 4 beds |
show details |
| Photo | Address | Area | Beds / Baths | Price | Details |
|---|---|---|---|---|---|

|
#11
Genessee Ave
Columbus, OH 43211
|
848 sq. feet
|
1 baths 2 beds |
show details | |

|
#12
Scott St
Columbus, OH 43222
|
1,920 sq. feet
|
2 baths 5 beds |
show details | |

|
#13
Dundee Ave
Columbus, OH 43227
|
1,270 sq. feet
|
2 baths 4 beds |
show details | |

|
#14
Headley Heights Ct
Columbus, OH 43230
|
2,657 sq. feet
|
3 baths 3 beds |
show details | |

|
#15
Melrose Ave
Columbus, OH 43224
|
732 sq. feet
|
2 baths 2 beds |
show details | |

|
#16
Sleeping Meadow Dr
New Albany, OH 43054
|
3,211 sq. feet
|
3 baths 4 beds |
show details | |

|
#17
N Nelson Rd
Columbus, OH 43219
|
2,886 sq. feet
|
2 baths 4 beds |
show details | |

|
#18
Hawkins Ln
Blacklick, OH 43004
|
896 sq. feet
|
1 baths 2 beds |
show details | |

|
#19
W North Broadway St
Columbus, OH 43214
|
1,400 sq. feet
|
2 baths 3 beds |
show details | |

|
#20
London Groveport Rd
Grove City, OH 43123
|
816 sq. feet
|
1 baths 2 beds |
show details |
| Photo | Address | Area | Beds / Baths | Price | Details |
|---|---|---|---|---|---|

|
#21
Salado Creek Dr
Columbus, OH 43219
|
2,334 sq. feet
|
3 baths 3 beds |
show details | |

|
#22
Andrew Rd
Columbus, OH 43227
|
1,053 sq. feet
|
2 baths 3 beds |
show details | |

|
#23
Sunview Rd
Reynoldsburg, OH 43068
|
1,025 sq. feet
|
1 baths 3 beds |
show details | |

|
#24
Fairgrove Rd
Columbus, OH 43231
|
1,004 sq. feet
|
1 baths 3 beds |
show details | |

|
#25
Sunbury Rd
Columbus, OH 43219
|
1,170 sq. feet
|
1 baths 3 beds |
show details | |

|
#26
Bloxom St
Grove City, OH 43123
|
1,920 sq. feet
|
3 baths 4 beds |
show details | |

|
#27
Woodnell Ave
Columbus, OH 43219
|
925 sq. feet
|
1 baths 3 beds |
show details | |

|
#28
Acillom Dr
Westerville, OH 43081
|
2,040 sq. feet
|
3 baths 4 beds |
show details | |

|
#29
Hepplewhite St
Westerville, OH 43081
|
1,570 sq. feet
|
3 baths 4 beds |
show details | |

|
#30
Woodnell Ave
Columbus, OH 43219
|
925 sq. feet
|
1 baths 3 beds |
show details |
| Photo | Address | Area | Beds / Baths | Price | Details |
|---|---|---|---|---|---|

|
#31
N Stygler Rd
Columbus, OH 43230
|
1,073 sq. feet
|
1 baths 3 beds |
show details | |

|
#32
Blackoak Ave
Columbus, OH 43229
|
1,476 sq. feet
|
3 baths 3 beds |
show details | |

|
#33
Inishmore Ln
Dublin, OH 43017
|
912 sq. feet
|
1 baths 1 beds |
show details | |

|
#34
Maplerun Ln
Westerville, OH 43081
|
2,020 sq. feet
|
3 baths 4 beds |
show details | |

|
#35
Moorfield Dr
Columbus, OH 43230
|
1,170 sq. feet
|
2 baths 3 beds |
show details | |

|
#36
Quartz St
Grove City, OH 43123
|
936 sq. feet
|
1 baths 3 beds |
show details | |

|
#37
Bellevue Ave
Columbus, OH 43207
|
744 sq. feet
|
1 baths 3 beds |
show details | |

|
#38
Eldorn Dr
Columbus, OH 43207
|
1,331 sq. feet
|
1 baths 3 beds |
show details | |

|
#39
Wena Way
Westerville, OH 43081
|
1,595 sq. feet
|
3 baths 3 beds |
show details | |

|
#40
Ironwood Dr
Columbus, OH 43229
|
1,380 sq. feet
|
2 baths 3 beds |
show details |
| Photo | Address | Area | Beds / Baths | Price | Details |
|---|---|---|---|---|---|

|
#41
Blacklick Ridge Blvd
Blacklick, OH 43004
|
1,816 sq. feet
|
3 baths 4 beds |
show details | |

|
#42
Fabyan Dr
Reynoldsburg, OH 43068
|
1,764 sq. feet
|
2 baths 3 beds |
show details | |

|
#43
Trailwind St
Grove City, OH 43123
|
1,532 sq. feet
|
3 baths 3 beds |
show details | |

|
#44
Moler Rd
Columbus, OH 43207
|
922 sq. feet
|
1 baths 3 beds |
show details | |

|
#45
Gantz Rd
Grove City, OH 43123
|
1,044 sq. feet
|
1 baths 3 beds |
show details | |

|
#46
Kirkdale Dr
Blacklick, OH 43004
|
1,088 sq. feet
|
2 baths 3 beds |
show details | |

|
#47
Heritage Lakes Dr
Hilliard, OH 43026
|
3,895 sq. feet
|
5 baths 4 beds |
show details | |

|
#48
E Beechwold Blvd
Columbus, OH 43214
|
912 sq. feet
|
1 baths 2 beds |
show details | |

|
#49
Gilette Dr
Reynoldsburg, OH 43068
|
1,404 sq. feet
|
2 baths 3 beds |
show details | |

|
Check over 1 million property listings on Foreclosure.com!
|
browse all offers | |||

Household type by relationship:
Households: 7,299- In family households: 5,929 (1,533 male householders, 537 female householders)
1,571 spouses, 1,689 children (1,519 natural, 63 adopted, 107 stepchildren), 169 grandchildren, 51 brothers or sisters, 33 parents, foster children, 70 other relatives, 240 non-relatives
- In nonfamily households: 1,370 (612 male householders (499 living alone)), 508 female householders (409 living alone)), 250 nonrelatives
- In group quarters: 252 (50 institutionalized population)
1,139 married couples with children.
507 single-parent households (146 men, 361 women).
94.4% of residents of Colville Reservation speak English at home.
1.9% of residents speak Spanish at home (90% speak English very well, 10% speak English not well).
0.5% of residents speak other Indo-European language at home (100% speak English very well).
3.1% of residents speak other language at home (90% speak English very well, 6% speak English well, 4% speak English not well).
Foreign born population: 21 (1.0%)
(33.3% of them are naturalized citizens)
| Here: | 5.3 |
| State: | 6.5 |
| Here: | 4.7 |
| State: | 3.9 |

- Bedrooms in owner-occupied houses and condos in Colville Reservation, Washington
- 7no bedroom
- 251 bedroom
- 1142 bedrooms
- 2013 bedrooms
- 434 bedrooms
- 295+ bedrooms

- Bedrooms in renter-occupied apartments in Colville Reservation, Washington
- 2no bedroom
- 321 bedroom
- 632 bedrooms
- 803 bedrooms
- 224 bedrooms
- 55+ bedrooms

- Cars and other vehicles available in Colville Reservation in owner-occupied houses/condos
- 20no vehicle
- 1281 vehicle
- 1422 vehicles
- 653 vehicles
- 394 vehicles
- 255+ vehicles

- Cars and other vehicles available in Colville Reservation in renter-occupied apartments
- 26no vehicle
- 761 vehicle
- 722 vehicles
- 253 vehicles
- 54 vehicles
- 05+ vehicles

- Rooms in owner-occupied houses in Colville Reservation, Washington
- 71 room
- 102 rooms
- 333 rooms
- 574 rooms
- 1185 rooms
- 916 rooms
- 497 rooms
- 428 rooms
- 129+ rooms

- Rooms in renter-occupied apartments in Colville Reservation, Washington
- 21 room
- 102 rooms
- 323 rooms
- 414 rooms
- 615 rooms
- 316 rooms
- 147 rooms
- 88 rooms
- 59+ rooms


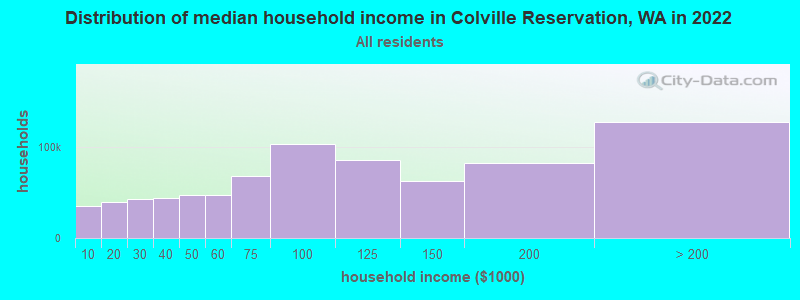
Colville Reservation, WA household income distribution

- 10,002Less than $10,000
- 14,062$10,000 to $19,999
- 15,377$20,000 to $29,999
- 14,717$30,000 to $39,999
- 17,308$40,000 to $49,999
- 15,082$50,000 to $59,999
- 21,651$60,000 to $74,999
- 33,671$75,000 to $99,999
- 28,618$100,000 to $124,999
- 20,809$125,000 to $149,999
- 27,229$150,000 to $199,999
- 32,881$200,000 or more
Percentage of workers working in this county: 73.7%
Number of people working at home: 91 (15.8% of all workers)
Travel time to work (commute)
- Less than 5 minutes: 47
- 5 to 9 minutes: 95
- 10 to 14 minutes: 58
- 15 to 19 minutes: 70
- 20 to 24 minutes: 29
- 25 to 29 minutes: 7
- 30 to 34 minutes: 26
- 35 to 39 minutes: 2
- 40 to 44 minutes: 18
- 45 to 59 minutes: 20
- 60 to 89 minutes: 44
- 90 or more minutes: 20
Means of transportation to work:
- Drove a car alone: 336 (70.4%)
- Carpooled: 62 (13.0%)
- Bus or trolley bus: 4 (0.8%)
- Walked: 32 (6.7%)
- Other means: 2 (0.4%)
- Worked at home: 41 (8.6%)


- Year of entry for the foreign-born population in Colville Reservation, Washington
- 01995 to March 2000
- 01990 to 1994
- 51985 to 1989
- 21980 to 1984
- 21975 to 1979
- 01970 to 1974
- 21965 to 1969
- 2Before 1965
Most common places of birth for foreign-born residents (%):
| Colville Reservation: | 53.8% (7) |
| Washington: | 24.1% (148,115) |
| Colville Reservation: | 30.8% (4) |
| Washington: | 7.7% (47,568) |
| Colville Reservation: | 15.4% (2) |
| Washington: | 0.2% (1,006) |
Place of birth for U.S.-born residents:
- This state: 1,382
- Other state: 271
- Northeast: 14
- Midwest: 52
- South: 31
- West: 174
60% of Colville Reservation residents lived in the same house 5 years ago.
Out of people who lived in different houses, 54% lived in this county.
Out of people who lived in different counties, 76% lived in Washington.
Education attainment for males 25 years and older:
- No schooling: 0
- Nursery to 4th grade: 3
- 5th and 6th grade: 1
- 7th and 8th grade: 31
- 9th grade: 16
- 10th grade: 33
- 11th grade: 23
- 12th grade, no diploma: 21
- High school graduate (or equivalency): 201
- Less than 1 year of college: 34
- Some college more than 1 year, no degree: 86
- Associate degree: 32
- Bachelor's degree: 20
- Master's degree: 9
- Professional school degree: 0
- Doctorate degree: 2

Education attainment for females 25 years and older:
- No schooling: 1
- Nursery to 4th grade: 0
- 5th and 6th grade: 3
- 7th and 8th grade: 8
- 9th grade: 14
- 10th grade: 18
- 11th grade: 19
- 12th grade, no diploma: 23
- High school graduate (or equivalency): 158
- Less than 1 year of college: 51
- Some college more than 1 year, no degree: 109
- Associate degree: 43
- Bachelor's degree: 46
- Master's degree: 10
- Professional school degree: 6
- Doctorate degree: 0


Housing units in structures:
- One, detached: 599
- One, attached: 11
- Two: 7
- Mobile homes: 257
- Boats, RVs, vans, etc.: 20
Median worth of mobile homes: $144,933
Housing units lacking complete kitchen facilities: 5.0%

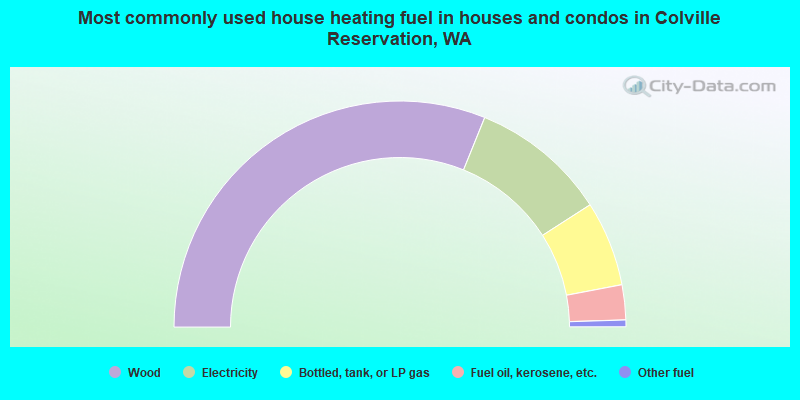
- 62.3%Wood
- 19.6%Electricity
- 12.2%Bottled, tank, or LP gas
- 5.0%Fuel oil, kerosene, etc.
- 1.0%Other fuel
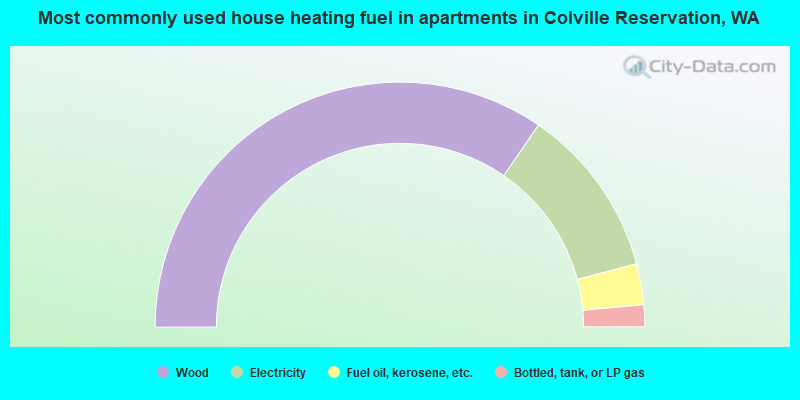
- 69.1%Wood
- 22.5%Electricity
- 5.4%Fuel oil, kerosene, etc.
- 2.9%Bottled, tank, or LP gas
Private vs. public school enrollment:
| Here: | 0.8% |
| Washington: | 9.2% |
| Here: | 1.4% |
| Washington: | 7.0% |
| Here: | 10.7% |
| Washington: | 15.7% |


