Housing density: 579 houses/condos per square mile
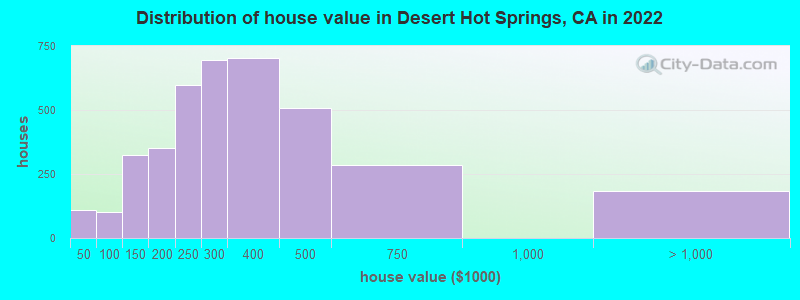
Median price asked for vacant for-sale houses and condos in 2022: $247,491.
Median contract rent in 2022: $1,047 (lower quartile is $823, upper quartile is $1,416)
Median rent asked for vacant for-rent units in 2022: $1,426
Median gross rent in Desert Hot Springs, CA in 2022: $1,277
Housing units in Desert Hot Springs with a mortgage: 3,470 (154 second mortgage, 0 home equity loan, 127 both second mortgage and home equity loan) Houses without a mortgage: 50
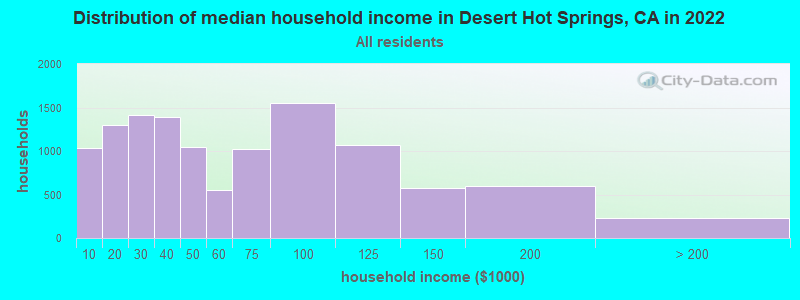
Median household income for houses/condos with a mortgage: $74,974
Median household income for apartments without a mortgage: $54,472
Median monthly housing costs: $1,244
Compare current foreclosures in Desert Hot Springs, CA:
3,247 married couples with children.
3,693 single-parent households (1,047 men, 2,646 women).
51.6% of residents of Desert Hot Springs speak English at home.
44.4% of residents speak Spanish at home (72% speak English very well, 17% speak English well, 8% speak English not well, 3% don't speak English at all).
1.4% of residents speak other Indo-European language at home (65% speak English very well, 19% speak English well, 12% speak English not well, 3% don't speak English at all).
2.0% of residents speak Asian or Pacific Island language at home (45% speak English very well, 49% speak English well, 4% speak English not well, 3% don't speak English at all).
0.1% of residents speak other language at home (73% speak English very well, 27% speak English well).
Foreign born population: 7,902 (24.0%)
(51.0% of them are naturalized citizens)
Percentage of workers working in this county: 92.6% Number of people working at home: 868 (5.8% of all workers)
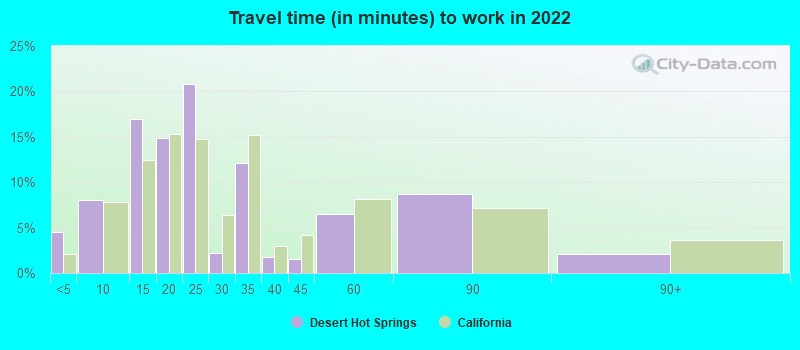
Travel time to work (commute)
Less than 5 minutes: 337
5 to 9 minutes: 254
10 to 14 minutes: 1,208
15 to 19 minutes: 1,852
20 to 24 minutes: 3,679
25 to 29 minutes: 1,132
30 to 34 minutes: 2,395
35 to 39 minutes: 771
40 to 44 minutes: 959
45 to 59 minutes: 514
60 to 89 minutes: 469
90 or more minutes: 413
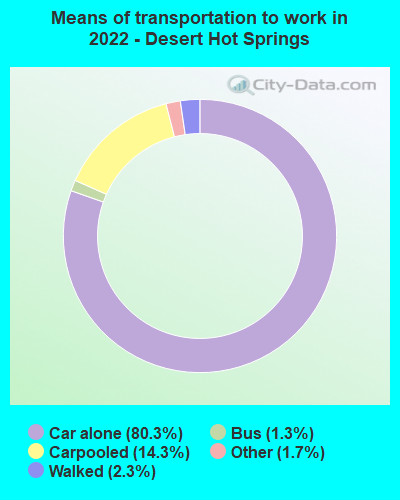
Means of transportation to work:
Drove a car alone: 4,791 (69.3%)
Carpooled: 925 (13.4%)
Bus: 72 (1.0%)
Taxi: 108 (1.6%)
Walked: 136 (2.0%)
Worked at home: 868 (12.5%)
Unemployment by race in 2022
Unemployment rate for White non-Hispanic residents
8.0%Males
3.4%Females
Unemployment rate for Black residents
5.6%Males
7.1%Females
Unemployment rate for American Indian and Alaska Native residents
27.4%Females
Unemployment rate for Asian residents
11.0%Males
6.0%Females
Unemployment rate for other race residents
8.5%Males
6.2%Females
Unemployment rate for two or more race residents
2.0%Males
5.7%Females
Unemployment rate for Hispanic or Latino residents
3.7%Males
7.3%Females
Year of entry for the foreign-born population in Desert Hot Springs, California
1,3862010 or later
1,4722000 to 2009
1,7601990 to 1999
1,0381980 to 1989
5271970 to 1979
477Before 1970
First ancestries reported:
English: 444 (2.2%)
American: 417 (2.0%)
Irish: 333 (1.6%)
German: 300 (1.5%)
French Canadian: 237 (1.2%)
Italian: 187 (0.9%)
Polish: 108 (0.5%)
Jamaican: 98 (0.5%)
Scottish: 72 (0.4%)
European: 64 (0.3%)
African: 60 (0.3%)
Hungarian: 53 (0.3%)
Romanian: 52 (0.3%)
Russian: 49 (0.2%)
Canadian: 44 (0.2%)
Swedish: 43 (0.2%)
Arab: 41 (0.2%)
Eastern European: 38 (0.2%)
Celtic: 25 (0.1%)
Norwegian: 24 (0.1%)
Czechoslovakian: 20 (0.10%)
Sierra Leonean: 19 (0.09%)
Ukrainian: 19 (0.09%)
Northern European: 17 (0.08%)
Scotch-Irish: 16 (0.08%)
Trinidadian and Tobagonian: 14 (0.07%)
British: 11 (0.05%)
Czech: 11 (0.05%)
Welsh: 11 (0.05%)
Croatian: 10 (0.05%)
French: 10 (0.05%)
Scandinavian: 7 (0.03%)
Nigerian: 7 (0.03%)
Dutch: 5 (0.02%)
Israeli: 5 (0.02%)
Luxembourger: 4 (0.02%)
Most common places of birth for foreign-born residents (%):
Mexico
Desert Hot Springs:
65.6% (5,181)
California:
37.2% (3,881,193)
Guatemala
Desert Hot Springs:
6.7% (528)
California:
2.8% (290,436)
El Salvador
Desert Hot Springs:
6.6% (525)
California:
4.2% (440,287)
Philippines
Desert Hot Springs:
1.9% (154)
California:
7.8% (818,297)
Thailand
Desert Hot Springs:
1.8% (139)
California:
0.6% (65,335)
Vietnam
Desert Hot Springs:
1.5% (119)
California:
4.9% (512,335)
Place of birth for U.S.-born residents:
This state: 20,411
Other state: 4,467
Northeast: 1,002
Midwest: 1,071
South: 1,448
West: 939
92.4% of Desert Hot Springs residents lived in the same house 1 years ago. Out of people who lived in different houses, 42.3% lived in this county. Out of people who lived in different counties, 47.5% lived in California.
Desert Hot Springs:
92.4%
State average:
88.9%
Education attainment for males 25 years and older:
No schooling: 310
Nursery to 4th grade: 228
5th and 6th grade: 197
7th and 8th grade: 108
9th grade: 92
10th grade: 156
11th grade: 164
12th grade, no diploma: 595
High school graduate (or equivalency): 3,412
Less than 1 year of college: 660
Some college more than 1 year, no degree: 1,575
Associate degree: 736
Bachelor's degree: 1,126
Master's degree: 249
Professional school degree: 312
Doctorate degree: 200
Education attainment for females 25 years and older:
No schooling: 271
Nursery to 4th grade: 294
5th and 6th grade: 213
7th and 8th grade: 229
9th grade: 50
10th grade: 146
11th grade: 464
12th grade, no diploma: 537
High school graduate (or equivalency): 3,365
Less than 1 year of college: 824
Some college more than 1 year, no degree: 1,900
Associate degree: 942
Bachelor's degree: 789
Master's degree: 381
Professional school degree: 123
Doctorate degree: 0
Housing units in structures:
One, detached: 8,596
One, attached: 352
Two: 755
3 or 4: 857
5 to 9: 976
10 to 19: 519
20 to 49: 119
50 or more: 226
Mobile homes: 1,068
Median worth of mobile homes: $208,061
Housing units lacking complete plumbing facilities in 2022: 0.1%
Housing units lacking complete kitchen facilities in 2022: 1.3%