Housing density: 750 houses/condos per square mile
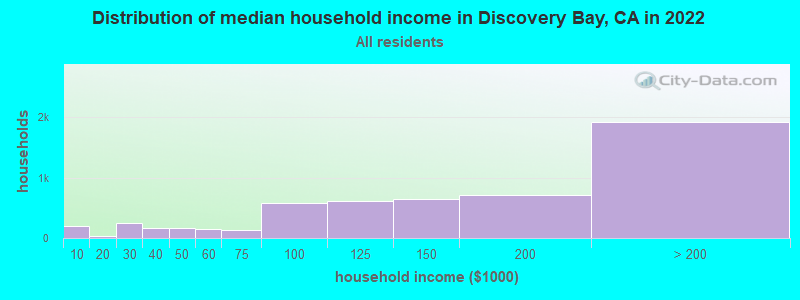
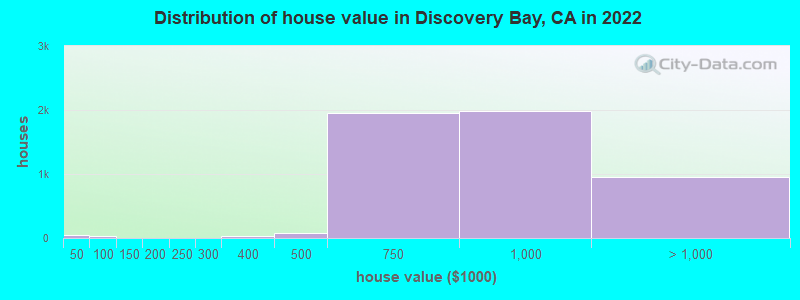
Median price asked for vacant for-sale houses and condos in 2022: $274,458.
Median contract rent in 2022: over $2,000 (lower quartile is over $2,000, upper quartile is over $2,000)
Median rent asked for vacant for-rent units in 2022: $1,805
Median gross rent in Discovery Bay, CA in 2022: over $2,000
Housing units in Discovery Bay with a mortgage: 4,015 (524 second mortgage, 0 home equity loan, 513 both second mortgage and home equity loan) Houses without a mortgage: 36
Median household income for houses/condos with a mortgage: $161,221
Median household income for apartments without a mortgage: $118,330
Median monthly housing costs: $3,041
Compare current foreclosures in Discovery Bay, CA:
Size of family households: 2,033 2-persons, 867 3-persons, 1,025 4-persons, 323 5-persons, 78 6-persons, 91 7-or-more-persons.
Size of nonfamily households: 811 1-person, 300 2-persons.
2,149 married couples with children.
689 single-parent households (465 men, 224 women).
84.1% of residents of Discovery Bay speak English at home.
6.9% of residents speak Spanish at home (84% speak English very well, 13% speak English well, 3% speak English not well).
3.8% of residents speak other Indo-European language at home (93% speak English very well, 7% speak English well).
3.0% of residents speak Asian or Pacific Island language at home (78% speak English very well, 20% speak English well, 2% speak English not well).
0.4% of residents speak other language at home (100% speak English very well).
Foreign born population: 1,507 (9.9%)
(74.6% of them are naturalized citizens)
Percentage of workers working in this county: 68.2% Number of people working at home: 1,339 (18.3% of all workers)
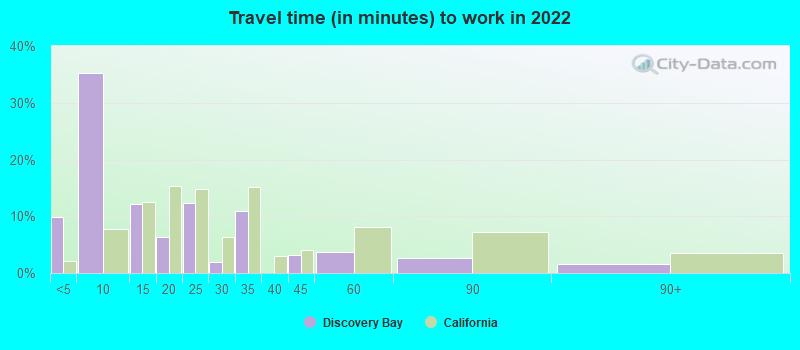
Travel time to work (commute)
Less than 5 minutes: 164
5 to 9 minutes: 437
10 to 14 minutes: 647
15 to 19 minutes: 519
20 to 24 minutes: 406
25 to 29 minutes: 109
30 to 34 minutes: 523
35 to 39 minutes: 116
40 to 44 minutes: 409
45 to 59 minutes: 836
60 to 89 minutes: 1,158
90 or more minutes: 464
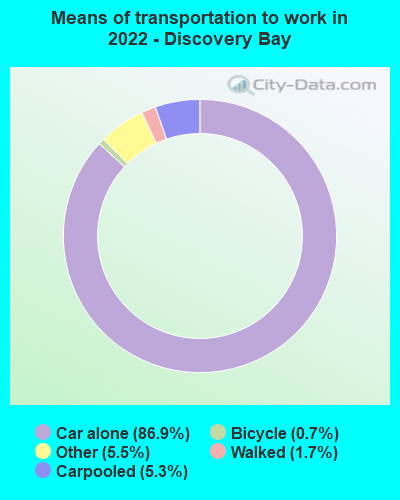
Means of transportation to work:
Drove a car alone: 1,062 (43.3%)
Carpooled: 71 (2.9%)
Taxi: 72 (2.9%)
Bicycle: 6 (0.2%)
Walked: 29 (1.2%)
Worked at home: 1,339 (54.6%)
Unemployment by race in 2022
Unemployment rate for White non-Hispanic residents
5.9%Males
2.5%Females
Unemployment rate for Black residents
3.6%Males
Unemployment rate for American Indian and Alaska Native residents
32.9%Males
Unemployment rate for Asian residents
2.1%Females
Unemployment rate for other race residents
17.0%Females
Unemployment rate for two or more race residents
5.4%Males
12.7%Females
Unemployment rate for Hispanic or Latino residents
5.4%Males
4.6%Females
Year of entry for the foreign-born population in Discovery Bay, California
1882010 or later
2442000 to 2009
3751990 to 1999
1511980 to 1989
1101970 to 1979
163Before 1970
First ancestries reported:
Italian: 829 (12.7%)
German: 603 (9.2%)
English: 394 (6.0%)
Irish: 350 (5.3%)
Portuguese: 330 (5.0%)
American: 230 (3.5%)
Scottish: 205 (3.1%)
European: 176 (2.7%)
Polish: 154 (2.4%)
French: 96 (1.5%)
Armenian: 73 (1.1%)
African: 48 (0.7%)
Ukrainian: 47 (0.7%)
Scotch-Irish: 36 (0.5%)
Russian: 34 (0.5%)
Swiss: 34 (0.5%)
Norwegian: 26 (0.4%)
British: 22 (0.3%)
Cypriot: 22 (0.3%)
Swedish: 19 (0.3%)
Danish: 18 (0.3%)
Iranian: 15 (0.2%)
Greek: 14 (0.2%)
Finnish: 11 (0.2%)
Maltese: 11 (0.2%)
Celtic: 10 (0.2%)
French Canadian: 8 (0.1%)
Scandinavian: 6 (0.09%)
Canadian: 5 (0.08%)
Dutch: 4 (0.06%)
Eastern European: 4 (0.06%)
Northern European: 4 (0.06%)
Most common places of birth for foreign-born residents (%):
Philippines
Discovery Bay:
24.5% (349)
California:
7.8% (818,297)
Mexico
Discovery Bay:
15.2% (216)
California:
37.2% (3,881,193)
Costa Rica
Discovery Bay:
6.0% (86)
California:
0.1% (12,623)
Haiti
Discovery Bay:
6.0% (85)
California:
0.1% (5,330)
India
Discovery Bay:
4.2% (60)
California:
5.2% (539,184)
Germany
Discovery Bay:
3.9% (56)
California:
0.7% (73,304)
England
Discovery Bay:
3.2% (46)
California:
0.6% (57,953)
China, excluding Hong Kong and Taiwan
Discovery Bay:
3.2% (46)
California:
6.6% (684,672)
Pakistan
Discovery Bay:
3.2% (45)
California:
0.5% (49,399)
Canada
Discovery Bay:
3.0% (43)
California:
1.2% (127,477)
Hong Kong
Discovery Bay:
2.9% (42)
California:
1.0% (105,215)
Ukraine
Discovery Bay:
2.7% (39)
California:
0.6% (60,761)
Poland
Discovery Bay:
2.7% (38)
California:
0.2% (20,997)
Russia
Discovery Bay:
2.4% (34)
California:
0.7% (71,932)
Morocco
Discovery Bay:
2.4% (34)
California:
0.1% (6,612)
Vietnam
Discovery Bay:
2.3% (33)
California:
4.9% (512,335)
Korea
Discovery Bay:
2.0% (29)
California:
3.0% (315,248)
Europe, n.e.c.
Discovery Bay:
1.6% (23)
California:
0.0% (1,713)
Place of birth for U.S.-born residents:
This state: 10,581
Other state: 2,900
Northeast: 697
Midwest: 717
South: 993
West: 488
89.5% of Discovery Bay residents lived in the same house 1 years ago. Out of people who lived in different houses, 28.4% lived in this county. Out of people who lived in different counties, 81.4% lived in California.
Discovery Bay:
89.5%
State average:
88.9%
Education attainment for males 25 years and older:
No schooling: 17
Nursery to 4th grade: 16
5th and 6th grade: 0
7th and 8th grade: 4
9th grade: 12
10th grade: 35
11th grade: 31
12th grade, no diploma: 110
High school graduate (or equivalency): 1,056
Less than 1 year of college: 563
Some college more than 1 year, no degree: 778
Associate degree: 912
Bachelor's degree: 1,163
Master's degree: 292
Professional school degree: 100
Doctorate degree: 69
Education attainment for females 25 years and older:
No schooling: 0
Nursery to 4th grade: 6
5th and 6th grade: 6
7th and 8th grade: 0
9th grade: 6
10th grade: 96
11th grade: 0
12th grade, no diploma: 183
High school graduate (or equivalency): 1,084
Less than 1 year of college: 467
Some college more than 1 year, no degree: 1,184
Associate degree: 708
Bachelor's degree: 1,186
Master's degree: 451
Professional school degree: 60
Doctorate degree: 73
Housing units in structures:
One, detached: 5,518
One, attached: 457
Two: 18
20 to 49: 63
Housing units lacking complete plumbing facilities in 2022: 0.3%
Housing units lacking complete kitchen facilities in 2022: 0.9%