Jump to a detailed profile or search site with Google Custom Search

District 3, Leonardtown, MD (Maryland) Houses and Residents

Estimated median house or condo value in 2022: $443,138 (it was $166,500 in 2000)
District 3, Leonardtown:

$443,138
Maryland:

$398,100
Lower value quartile - upper value quartile: $296,887 - $663,337

Total population: 12,515 (Urban population: 143 (all inside urban clusters), Rural population: 10,817 (489 farm, 10,328 nonfarm))

Houses: 4,055 (3,735 occupied: 2,830 owner occupied, 905 renter occupied)

% of renters here:

24%
State:

32%

Housing density: 63 houses/condos per square mile

Median price asked for vacant for-sale houses and condos in 2022 in this county: $475,864.

Median contract rent in 2022: $1,108 (lower quartile is $923, upper quartile is $1,494)


Median rent asked for vacant for-rent units in 2022: $1,264


Median gross rent in District 3, Leonardtown, MD in 2022: $1,334

Housing units in District 3, Leonardtown with a mortgage: 1,823 (239 second mortgage, 276 home equity loan, 6 both second mortgage and home equity loan)
Houses without a mortgage: 563

Compare current foreclosures near District 3, Leonardtown, MD:

Check out more offers near District 3, Leonardtown, MD.
Powered by Foreclosure.com


District 3, Leonardtown, Maryland Age and Sex of Residents

Household type by relationship:

Households: 102,225
  • In family households: 88,684 (19,558 male householders, 7,526 female householders)
    20,870 spouses, 32,691 children (30,270 natural, 619 adopted, 1,802 stepchildren), 2,130 grandchildren, 753 brothers or sisters, 822 parents, foster children, 1,063 other relatives, 2,549 non-relatives
  • In nonfamily households: 13,541 (5,680 male householders (4,251 living alone)), 4,840 female householders (3,932 living alone)), 3,021 nonrelatives
  • In group quarters: 2,926 (923 institutionalized population)

17,120 married couples with children.
4,843 single-parent households (1,310 men, 3,533 women).

94.2% of residents of District 3, Leonardtown speak English at home.
2.9% of residents speak Spanish at home (79% speak English very well, 3% speak English well, 18% speak English not well).
2.5% of residents speak other Indo-European language at home (63% speak English very well, 31% speak English well, 5% speak English not well, 1% don't speak English at all).
0.2% of residents speak Asian or Pacific Island language at home (89% speak English very well, 11% speak English well).
0.2% of residents speak other language at home (100% speak English very well).

Foreign born population: 408 (2.8%)
(52.9% of them are naturalized citizens)

Median number of rooms in houses and condos:
Here:

7.2
State:

7.3

Median number of rooms in apartments
Here:

4.8
State:

4.2

Owner-occupied Renter-occupied
Bedrooms in owner-occupied houses and condos in District 3, Leonardtown, Maryland
  • Bedrooms in owner-occupied houses and condos in District 3, Leonardtown, Maryland
  • 0no bedroom
  • 571 bedroom
  • 3362 bedrooms
  • 1,4663 bedrooms
  • 7444 bedrooms
  • 2275+ bedrooms
Bedrooms in renter-occupied apartments in District 3, Leonardtown, Maryland
  • Bedrooms in renter-occupied apartments in District 3, Leonardtown, Maryland
  • 17no bedroom
  • 1571 bedroom
  • 3132 bedrooms
  • 3603 bedrooms
  • 414 bedrooms
  • 175+ bedrooms
Owner-occupied Renter-occupied
Cars and other vehicles available in District 3, Leonardtown in owner-occupied houses/condos
  • Cars and other vehicles available in District 3, Leonardtown in owner-occupied houses/condos
  • 98no vehicle
  • 5781 vehicle
  • 1,2552 vehicles
  • 6293 vehicles
  • 2044 vehicles
  • 665+ vehicles
Cars and other vehicles available in District 3, Leonardtown in renter-occupied apartments
  • Cars and other vehicles available in District 3, Leonardtown in renter-occupied apartments
  • 142no vehicle
  • 4051 vehicle
  • 2222 vehicles
  • 1113 vehicles
  • 194 vehicles
  • 65+ vehicles
Owner-occupied Renter-occupied
Rooms in owner-occupied houses in District 3, Leonardtown, Maryland
  • Rooms in owner-occupied houses in District 3, Leonardtown, Maryland
  • 01 room
  • 252 rooms
  • 253 rooms
  • 1464 rooms
  • 5095 rooms
  • 5126 rooms
  • 6167 rooms
  • 4768 rooms
  • 5219+ rooms
Rooms in renter-occupied apartments in District 3, Leonardtown, Maryland
  • Rooms in renter-occupied apartments in District 3, Leonardtown, Maryland
  • 91 room
  • 462 rooms
  • 1233 rooms
  • 2274 rooms
  • 2215 rooms
  • 2006 rooms
  • 357 rooms
  • 218 rooms
  • 239+ rooms
Year house built
Breakdown of mean house values by ages of householders
Owners and renters by unit type in District 3, Leonardtown, MD
  • District 3, Leonardtown, MD household income distribution

  • Distribution of median household income in District 3, Leonardtown, MD in 2022
  • 2,708Less than $10,000
  • 1,926$10,000 to $19,999
  • 1,670$20,000 to $29,999
  • 2,090$30,000 to $39,999
  • 1,439$40,000 to $49,999
  • 1,208$50,000 to $59,999
  • 3,507$60,000 to $74,999
  • 5,376$75,000 to $99,999
  • 5,439$100,000 to $124,999
  • 3,998$125,000 to $149,999
  • 6,369$150,000 to $199,999
  • 10,307$200,000 or more

Percentage of workers working in this county: 92.4%
Number of people working at home: 1,124 (17.7% of all workers)

Travel time to work (commute)

  • Less than 5 minutes: 85
  • 5 to 9 minutes: 400
  • 10 to 14 minutes: 711
  • 15 to 19 minutes: 758
  • 20 to 24 minutes: 744
  • 25 to 29 minutes: 420
  • 30 to 34 minutes: 724
  • 35 to 39 minutes: 129
  • 40 to 44 minutes: 151
  • 45 to 59 minutes: 280
  • 60 to 89 minutes: 238
  • 90 or more minutes: 314

Means of transportation to work:

  • Drove a car alone: 4,124 (80.2%)
  • Carpooled: 637 (12.4%)
  • Bus or trolley bus: 76 (1.5%)
  • Motorcycle: 10 (0.2%)
  • Walked: 70 (1.4%)
  • Other means: 37 (0.7%)
  • Worked at home: 190 (3.7%)
Class of Workers in 2000
Year of entry for the foreign-born population in District 3, Leonardtown, Maryland
  • Year of entry for the foreign-born population in District 3, Leonardtown, Maryland
  • 781995 to March 2000
  • 81990 to 1994
  • 201985 to 1989
  • 281980 to 1984
  • 241975 to 1979
  • 301970 to 1974
  • 51965 to 1969
  • 71Before 1965

Most common places of birth for foreign-born residents (%):

India
District 3, Leonardtown:

31.8% (84)
Maryland:

6.2% (32,276)

Canada
District 3, Leonardtown:

12.5% (33)
Maryland:

1.7% (9,019)

United Kingdom
District 3, Leonardtown:

9.1% (24)
Maryland:

2.7% (14,206)

El Salvador
District 3, Leonardtown:

6.8% (18)
Maryland:

8.1% (41,818)

Philippines
District 3, Leonardtown:

6.1% (16)
Maryland:

4.1% (21,007)

Spain
District 3, Leonardtown:

4.2% (11)
Maryland:

0.4% (1,949)

Romania
District 3, Leonardtown:

4.2% (11)
Maryland:

0.3% (1,547)

Japan
District 3, Leonardtown:

3.8% (10)
Maryland:

1.0% (5,354)

Mexico
District 3, Leonardtown:

3.4% (9)
Maryland:

3.7% (19,287)

Other Northern Africa
District 3, Leonardtown:

2.7% (7)
Maryland:

0.5% (2,526)

Other Caribbean
District 3, Leonardtown:

2.7% (7)
Maryland:

0.8% (4,105)

Peru
District 3, Leonardtown:

2.7% (7)
Maryland:

1.6% (8,407)

Trinidad and Tobago
District 3, Leonardtown:

2.3% (6)
Maryland:

2.1% (11,050)

Nigeria
District 3, Leonardtown:

1.9% (5)
Maryland:

2.9% (15,071)

Russia
District 3, Leonardtown:

1.5% (4)
Maryland:

1.7% (8,723)

Egypt
District 3, Leonardtown:

1.5% (4)
Maryland:

0.5% (2,477)

Place of birth for U.S.-born residents:

  • This state: 6,763
  • Other state: 3,786
  • Northeast: 1,182
  • Midwest: 346
  • South: 1,895
  • West: 363

57% of District 3, Leonardtown residents lived in the same house 5 years ago.
   Out of people who lived in different houses, 58% lived in this county.
   Out of people who lived in different counties, 42% lived in Maryland.

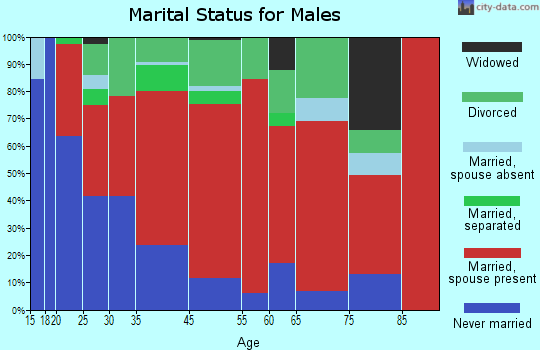
Education attainment for males 25 years and older:

  • No schooling: 9
  • Nursery to 4th grade: 18
  • 5th and 6th grade: 50
  • 7th and 8th grade: 158
  • 9th grade: 130
  • 10th grade: 126
  • 11th grade: 74
  • 12th grade, no diploma: 87
  • High school graduate (or equivalency): 1,085
  • Less than 1 year of college: 160
  • Some college more than 1 year, no degree: 398
  • Associate degree: 100
  • Bachelor's degree: 608
  • Master's degree: 370
  • Professional school degree: 57
  • Doctorate degree: 7
Educational Attainment for Males

Education attainment for females 25 years and older:

  • No schooling: 7
  • Nursery to 4th grade: 2
  • 5th and 6th grade: 24
  • 7th and 8th grade: 215
  • 9th grade: 73
  • 10th grade: 113
  • 11th grade: 114
  • 12th grade, no diploma: 100
  • High school graduate (or equivalency): 1,307
  • Less than 1 year of college: 329
  • Some college more than 1 year, no degree: 492
  • Associate degree: 275
  • Bachelor's degree: 480
  • Master's degree: 237
  • Professional school degree: 26
  • Doctorate degree: 2
Educational Attainment for Females
District 3, Leonardtown marital status for males
District 3, Leonardtown marital status for females

Housing units in structures:

  • One, detached: 3,269
  • One, attached: 93
  • Two: 25
  • 3 or 4: 75
  • 5 to 9: 132
  • 10 to 19: 36
  • 20 to 49: 56
  • 50 or more: 10
  • Mobile homes: 359

Median worth of mobile homes: $125,057

Housing units lacking complete plumbing facilities: 0.9%

Housing units lacking complete kitchen facilities: 0.5%
Year householders moved into residence in District 3, Leonardtown
Houses and condos Apartments
Most commonly used house heating fuel in houses and condos in District 3, Leonardtown, MD
  • 42.4%Fuel oil, kerosene, etc.
  • 41.5%Electricity
  • 10.8%Bottled, tank, or LP gas
  • 3.8%Wood
  • 0.6%Coal or coke
  • 0.5%No fuel used
  • 0.4%Other fuel
Most commonly used house heating fuel in apartments in District 3, Leonardtown, MD
  • 41.7%Electricity
  • 38.7%Fuel oil, kerosene, etc.
  • 14.1%Bottled, tank, or LP gas
  • 2.1%Utility gas
  • 1.8%Wood
  • 1.0%No fuel used
  • 0.7%Other fuel

Private vs. public school enrollment:

Students in private schools in grades 1 to 8 (elementary and middle school): 251
Here:

17.6%
Maryland:

14.8%

Students in private schools in grades 9 to 12 (high school): 155
Here:

20.5%
Maryland:

13.3%

Students in private undergraduate colleges: 59
Here:

13.4%
Maryland:

21.7%
School Enrollment by Level of School for Male Students
School Enrollment by Level of School for Female Students
Age and Sex of Sensory-Disabled Noninstitutionalized Residents
Age and Sex of Physically-Disabled Noninstitutionalized Residents
Age and Sex of Mentally-Disabled Noninstitutionalized Residents
Age and Sex of Self-Care Disabled Noninstitutionalized Residents
Age and Sex of Go-Outside-Home Disabled Noninstitutionalized Residents
Age and Sex of Noninstitutionalized Residents with Employment Disability