Eagle Valley, OR (Oregon) Houses and Residents
| Eagle Valley: | $299,854 |
| Oregon: | $475,600 |
Total population: 926 (Urban population: 0, Rural population: 960 (314 farm, 646 nonfarm))
Houses: 668 (439 occupied: 338 owner occupied, 101 renter occupied)
| % of renters here: | 23% |
| State: | 37% |
Housing density: 1 houses/condos per square mile
Median price asked for vacant for-sale houses and condos in 2022 in this county: $194,429.
Median contract rent in 2022: $466 (lower quartile is $347, upper quartile is $655)
Median rent asked for vacant for-rent units in 2022: $488
Median gross rent in Eagle Valley, OR in 2022: $667
Housing units in Eagle Valley with a mortgage: 49 (0 second mortgage, 0 home equity loan, 0 both second mortgage and home equity loan)
Houses without a mortgage: 53


Household type by relationship:
Households: 15,761- In family households: 12,684 (3,337 male householders, 1,093 female householders)
3,572 spouses, 3,755 children (3,330 natural, 159 adopted, 266 stepchildren), 238 grandchildren, 73 brothers or sisters, 70 parents, foster children, 95 other relatives, 390 non-relatives
- In nonfamily households: 3,077 (1,269 male householders (1,039 living alone)), 1,341 female householders (1,160 living alone)), 467 nonrelatives
- In group quarters: 373 (313 institutionalized population)
2,783 married couples with children.
940 single-parent households (233 men, 707 women).
97.5% of residents of Eagle Valley speak English at home.
1.4% of residents speak Spanish at home (85% speak English very well, 15% speak English well).
0.9% of residents speak other Indo-European language at home (100% speak English very well).
0.2% of residents speak Asian or Pacific Island language at home (100% don't speak English at all).
Foreign born population: 15 (1.4%)
(86.7% of them are naturalized citizens)
| Here: | 5.2 |
| State: | 6.2 |
| Here: | 4.8 |
| State: | 4.0 |

- Bedrooms in owner-occupied houses and condos in Eagle Valley, Oregon
- 8no bedroom
- 481 bedroom
- 1022 bedrooms
- 1203 bedrooms
- 474 bedrooms
- 135+ bedrooms

- Bedrooms in renter-occupied apartments in Eagle Valley, Oregon
- 5no bedroom
- 211 bedroom
- 462 bedrooms
- 223 bedrooms
- 44 bedrooms
- 35+ bedrooms

- Cars and other vehicles available in Eagle Valley in owner-occupied houses/condos
- 5no vehicle
- 751 vehicle
- 1322 vehicles
- 863 vehicles
- 244 vehicles
- 165+ vehicles

- Cars and other vehicles available in Eagle Valley in renter-occupied apartments
- 12no vehicle
- 461 vehicle
- 312 vehicles
- 93 vehicles
- 34 vehicles
- 05+ vehicles

- Rooms in owner-occupied houses in Eagle Valley, Oregon
- 81 room
- 112 rooms
- 253 rooms
- 574 rooms
- 825 rooms
- 806 rooms
- 467 rooms
- 248 rooms
- 59+ rooms

- Rooms in renter-occupied apartments in Eagle Valley, Oregon
- 51 room
- 42 rooms
- 133 rooms
- 404 rooms
- 195 rooms
- 126 rooms
- 27 rooms
- 38 rooms
- 39+ rooms


Eagle Valley, OR household income distribution

- 8,813Less than $10,000
- 11,252$10,000 to $19,999
- 13,638$20,000 to $29,999
- 12,805$30,000 to $39,999
- 14,335$40,000 to $49,999
- 12,162$50,000 to $59,999
- 16,152$60,000 to $74,999
- 25,383$75,000 to $99,999
- 18,154$100,000 to $124,999
- 13,248$125,000 to $149,999
- 15,325$150,000 to $199,999
- 18,163$200,000 or more

Percentage of workers working in this county: 92.6%
Number of people working at home: 67 (16.4% of all workers)
Travel time to work (commute)
- Less than 5 minutes: 34
- 5 to 9 minutes: 51
- 10 to 14 minutes: 49
- 15 to 19 minutes: 9
- 20 to 24 minutes: 27
- 25 to 29 minutes: 14
- 30 to 34 minutes: 9
- 35 to 39 minutes: 0
- 40 to 44 minutes: 9
- 45 to 59 minutes: 35
- 60 to 89 minutes: 11
- 90 or more minutes: 21
Means of transportation to work:
- Drove a car alone: 165 (42.6%)
- Carpooled: 41 (10.6%)
- Motorcycle: 7 (1.8%)
- Walked: 56 (14.5%)
- Worked at home: 118 (30.5%)


- Year of entry for the foreign-born population in Eagle Valley, Oregon
- 01995 to March 2000
- 01990 to 1994
- 21985 to 1989
- 01980 to 1984
- 01975 to 1979
- 01970 to 1974
- 21965 to 1969
- 6Before 1965
Most common places of birth for foreign-born residents (%):
| Eagle Valley: | 20.0% (2) |
| Oregon: | 0.6% (1,826) |
| Eagle Valley: | 20.0% (2) |
| Oregon: | 3.0% (8,568) |
| Eagle Valley: | 20.0% (2) |
| Oregon: | 0.4% (1,034) |
| Eagle Valley: | 20.0% (2) |
| Oregon: | 0.2% (633) |
| Eagle Valley: | 20.0% (2) |
| Oregon: | 3.6% (10,488) |
Place of birth for U.S.-born residents:
- This state: 540
- Other state: 403
- Northeast: 18
- Midwest: 103
- South: 38
- West: 244
60% of Eagle Valley residents lived in the same house 5 years ago.
Out of people who lived in different houses, 46% lived in this county.
Out of people who lived in different counties, 78% lived in Oregon.
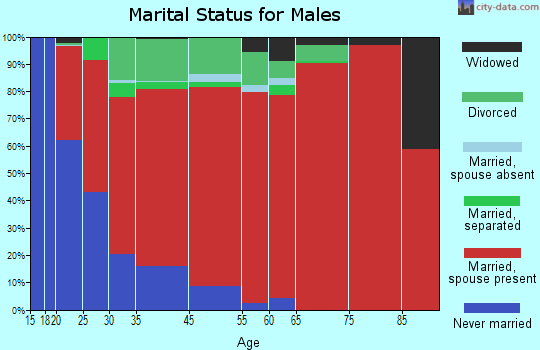
Education attainment for males 25 years and older:
- No schooling: 0
- Nursery to 4th grade: 2
- 5th and 6th grade: 6
- 7th and 8th grade: 28
- 9th grade: 9
- 10th grade: 9
- 11th grade: 14
- 12th grade, no diploma: 6
- High school graduate (or equivalency): 123
- Less than 1 year of college: 34
- Some college more than 1 year, no degree: 83
- Associate degree: 25
- Bachelor's degree: 27
- Master's degree: 14
- Professional school degree: 2
- Doctorate degree: 2

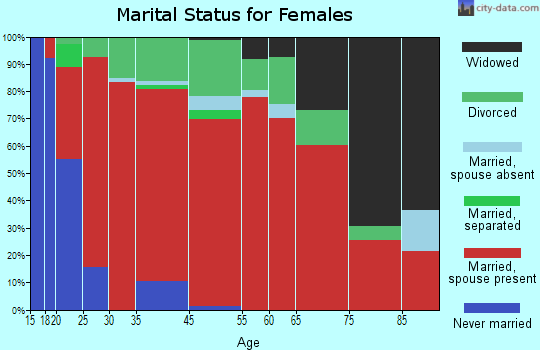
Education attainment for females 25 years and older:
- No schooling: 0
- Nursery to 4th grade: 2
- 5th and 6th grade: 6
- 7th and 8th grade: 9
- 9th grade: 17
- 10th grade: 16
- 11th grade: 8
- 12th grade, no diploma: 2
- High school graduate (or equivalency): 137
- Less than 1 year of college: 46
- Some college more than 1 year, no degree: 79
- Associate degree: 13
- Bachelor's degree: 39
- Master's degree: 3
- Professional school degree: 8
- Doctorate degree: 0

Housing units in structures:
- One, detached: 470
- Two: 8
- 3 or 4: 12
- 10 to 19: 2
- Mobile homes: 141
- Boats, RVs, vans, etc.: 35
Median worth of mobile homes: $196,343
Housing units lacking complete kitchen facilities: 8.8%

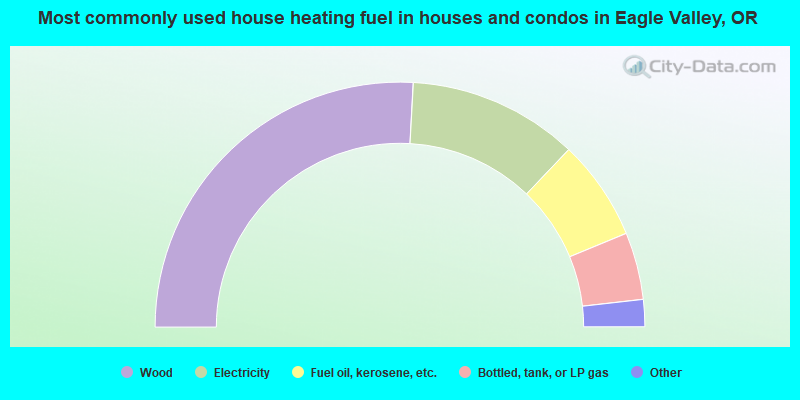
- 51.8%Wood
- 22.5%Electricity
- 13.3%Fuel oil, kerosene, etc.
- 8.9%Bottled, tank, or LP gas
- 2.1%Other fuel
- 0.9%Utility gas
- 0.6%Solar energy
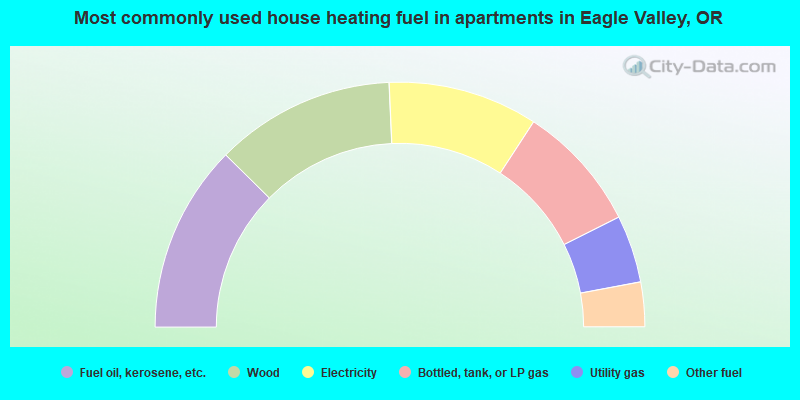
- 24.8%Fuel oil, kerosene, etc.
- 23.8%Wood
- 19.8%Electricity
- 16.8%Bottled, tank, or LP gas
- 8.9%Utility gas
- 5.9%Other fuel
Private vs. public school enrollment:
| Here: | 12.6% |
| Oregon: | 9.7% |
| Here: | 2.7% |
| Oregon: | 7.6% |
| Here: | 0.0% |
| Oregon: | 16.1% |


