Easley, SC (South Carolina) Houses and Residents
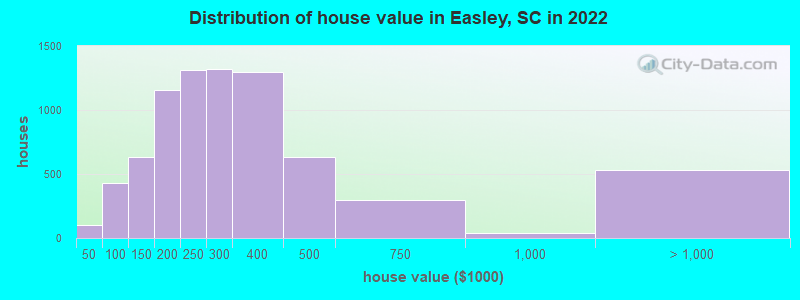
Estimated median house or condo value in 2022: $267,089 (it was $95,300 in 2000 )
Easley:
$267,089South Carolina:
$254,600
Lower value quartile - upper value quartile: $173,373 - $382,081Mean price in 2022: Detached houses: $383,658 Here:
$383,658State:
$368,255
Townhouses or other attached units: $214,524 Here:
$214,524State:
$292,023
Mobile homes: $185,638 Here:
$185,638State:
$102,531
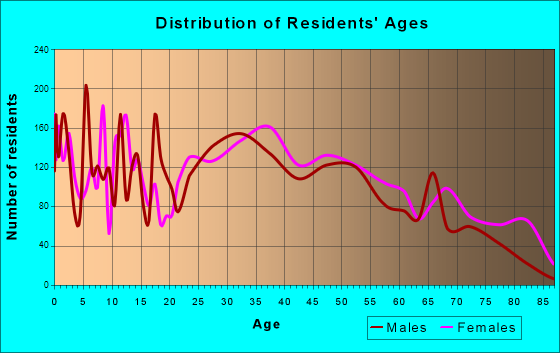
Total population: 20,549 (Urban population: 17,951, Rural population: 13 (all nonfarm) )
Houses: 11,430 (10,569 occupied: 7,472 owner occupied, 3,363 renter occupied )
% of renters here:
31%State:
28%
Housing density: 1,074 houses/condos per square mile
Median price asked for vacant for-sale houses and condos in 2022: $194,312.
Median contract rent in 2022: $662 (lower quartile is $463, upper quartile is $827)
Median rent asked for vacant for-rent units in 2022: $790
Median gross rent in Easley, SC in 2022: $830
Housing units in Easley with a mortgage: 4,570 (257 second mortgage, 0 home equity loan, 215 both second mortgage and home equity loan )Houses without a mortgage: 260
Median household income for houses/condos with a mortgage: $94,723
Median household income for apartments without a mortgage: $51,701
Median monthly housing costs: $907
Data:
Median house or condo value ($)
Median house or condo value ($ change since 2000)
Median house or condo value ($) - White
Median house or condo value ($) - Black or African American
Median house or condo value ($) - Asian
Median house or condo value ($) - Hispanic or Latino
Median house or condo value ($) - American Indian and Alaska Native
Median house or condo value ($) - Multirace
Median house or condo value ($) - Other Race
Median price asked for mobile homes ($)
Household density (households per square mile)
Mean house or condo value by units in structure - 1, detached ($)
Mean house or condo value by units in structure - 1, attached ($)
Mean house or condo value by units in structure - 2 ($)
Mean house or condo value by units in structure by units in structure - 3 or 4 ($)
Mean house or condo value by units in structure - 5 or more ($)
Mean house or condo value by units in structure - Boat, RV, van, etc. ($)
Mean house or condo value by units in structure - Mobile home ($)
Median contract rent ($)
Median contract rent - Lower quartile ($)
Median contract rent - Upper quartile ($)
Median gross rent ($)
Urban houses (%)
Rural houses (%)
Houses occupied (%)
Houses occupied (% change since 2000)
Houses owner occupied (%)
Houses owner occupied (% change since 2000)
Houses renter occupied (%)
Houses renter occupied (% change since 2000)
Vacant housing units - For rent (%)
Vacant housing units - For rent (% change since 2000)
Vacant housing units - For sale only (%)
Vacant housing units - For sale only (% change since 2000)
Vacant housing units - Rented or sold, not occupied (%)
Vacant housing units - Rented or sold, not occupied (% change since 2000)
Vacant housing units - For seasonal, recreational, or occasional use (%)
Vacant housing units - For seasonal, recreational, or occasional use (% change since 2000)
Vacant housing units - For migrant workers (%)
Vacant housing units - For migrant workers (% change since 2000)
Vacant housing units - Other vacant (%)
Vacant housing units - Other vacant (% change since 2000)
Median monthly housing costs ($)
Median household income for houses/condos with a mortgage ($)
Median household income for houses/condos without a mortgage ($)
Median household income ($)
Median household income ($) - White
Median household income ($) - Black or African American
Median household income ($) - Asian
Median household income ($) - Hispanic or Latino
Median household income ($) - American Indian and Alaska Native
Median household income ($) - Multirace
Median household income ($) - Other Race
Mortgage status - with mortgage (%)
Mortgage status - with second mortgage (%)
Mortgage status - with home equity loan (%)
Mortgage status - with both second mortgage and home equity loan (%)
Mortgage status - without a mortgage (%)
Median year house/condo built
Median year apartment built
Household type by relationship - Male householder living alone (%)
Household type by relationship - Male householder not living alone (%)
Household type by relationship - Female householder living alone (%)
Household type by relationship - Female householder not living alone (%)
Household type by relationship - Opposite-Sex spouse (%)
Household type by relationship - Same-Sex spouse (%)
Household type by relationship - Opposite-Sex unmarried partner (%)
Household type by relationship - Same-Sex unmarried partner (%)
Household type by relationship - In group quarters (%)
Size of family households - 2-person household (%)
Size of family households - 3-person household (%)
Size of family households - 4-person household (%)
Size of family households - 5-person household (%)
Size of family households - 6-person household (%)
Size of family households - 7-or-more-person household (%)
Size of nonfamily households - 1-person household (%)
Size of nonfamily households - 2-person household (%)
Size of nonfamily households - 3-person household (%)
Size of nonfamily households - 4-person household (%)
Size of nonfamily households - 5-person household (%)
Size of nonfamily households - 6-person household (%)
Size of nonfamily households - 7-or-moreperson household (%)
Year house built - Built 2010 or later (%)
Year house built - Built 2000 to 2009 (%)
Year house built - Built 1990 to 1999 (%)
Year house built - Built 1980 to 1989 (%)
Year house built - Built 1970 to 1979 (%)
Year house built - Built 1960 to 1969 (%)
Year house built - Built 1950 to 1959 (%)
Year house built - Built 1940 to 1949 (%)
Year house built - Built 1939 or earlier (%)
Median number of rooms in houses and condos
Median number of rooms in apartments
Median number of bedrooms in owner occupied houses
Mean number of bedrooms in owner occupied houses
Median number of bedrooms in renter occupied houses
Mean number of bedrooms in renter occupied houses
Median number of vehichles in owner occupied houses
Mean number of vehichles in owner occupied houses
Median number of vehichles in renter occupied houses
Mean number of vehichles in renter occupied houses
Rooms in owner-occupied houses - 1 room (%)
Rooms in owner-occupied houses - 2 rooms (%)
Rooms in owner-occupied houses - 3 rooms (%)
Rooms in owner-occupied houses - 4 rooms (%)
Rooms in owner-occupied houses - 5 rooms (%)
Rooms in owner-occupied houses - 6 rooms (%)
Rooms in owner-occupied houses - 7 rooms (%)
Rooms in owner-occupied houses - 8 rooms (%)
Rooms in owner-occupied houses - 9+ rooms (%)
Rooms in renter-occupied houses - 1 room (%)
Rooms in renter-occupied houses - 2 rooms (%)
Rooms in renter-occupied houses - 3 rooms (%)
Rooms in renter-occupied houses - 4 rooms (%)
Rooms in renter-occupied houses - 5 rooms (%)
Rooms in renter-occupied houses - 6 rooms (%)
Rooms in renter-occupied houses - 7 rooms (%)
Rooms in renter-occupied houses - 8 rooms (%)
Rooms in renter-occupied houses - 9+ rooms (%)
Bedrooms in owner-occupied houses - no bedrooms (%)
Bedrooms in owner-occupied houses - 1 bedroom (%)
Bedrooms in owner-occupied houses - 2 bedrooms (%)
Bedrooms in owner-occupied houses - 3 bedrooms (%)
Bedrooms in owner-occupied houses - 4 bedrooms (%)
Bedrooms in owner-occupied houses - 5+ bedrooms (%)
Bedrooms in renter-occupied houses - no bedrooms (%)
Bedrooms in renter-occupied houses - 1 bedroom (%)
Bedrooms in renter-occupied houses - 2 bedrooms (%)
Bedrooms in renter-occupied houses - 3 bedrooms (%)
Bedrooms in renter-occupied houses - 4 bedrooms (%)
Bedrooms in renter-occupied houses - 5+ bedrooms (%)
Vehicles available in owner-occupied houses - no vehicle available (%)
Vehicles available in owner-occupied houses - 1 vehicle available(%)
Vehicles available in owner-occupied houses - 2 Vehicles available (%)
Vehicles available in owner-occupied houses - 3 Vehicles available (%)
Vehicles available in owner-occupied houses - 4 Vehicles available (%)
Vehicles available in owner-occupied houses - 5+ Vehicles available (%)
Vehicles available in renter-occupied houses - no vehicle available (%)
Vehicles available in renter-occupied houses - 1 vehicle available (%)
Vehicles available in renter-occupied houses - 2 Vehicles available (%)
Vehicles available in renter-occupied houses - 3 Vehicles available (%)
Vehicles available in renter-occupied houses - 4 Vehicles available (%)
Vehicles available in renter-occupied houses - 5+ Vehicles available (%)
Housing units in structures - 1, detached (%)
Housing units in structures - 1, attached (%)
Housing units in structures - 2 (%)
Housing units in structures - 3 or 4 (%)
Housing units in structures - 5 to 9 (%)
Housing units in structures - 10 to 19 (%)
Housing units in structures - 20 to 49 (%)
Housing units in structures - 50 or more (%)
Housing units in structures - Mobile home (%)
Housing units in structures - Boat, RV, van, etc. (%)
Housing units in structures - Owners - 1, detached (%)
Housing units in structures - Owners - 1, attached (%)
Housing units in structures - Owners - 2 (%)
Housing units in structures - Owners - 3 or 4 (%)
Housing units in structures - Owners - 5 to 9 (%)
Housing units in structures - Owners - 10 to 19 (%)
Housing units in structures - Owners - 20 to 49 (%)
Housing units in structures - Owners - 50 or more (%)
Housing units in structures - Owners - Mobile home (%)
Housing units in structures - Owners - Boat, RV, van, etc. (%)
Housing units in structures - Renters - 1, detached (%)
Housing units in structures - Renters - 1, attached (%)
Housing units in structures - Renters - 2 (%)
Housing units in structures - Renters - 3 or 4 (%)
Housing units in structures - Renters - 5 to 9 (%)
Housing units in structures - Renters - 10 to 19 (%)
Housing units in structures - Renters - 20 to 49 (%)
Housing units in structures - Renters - 50 or more (%)
Housing units in structures - Renters - Mobile home (%)
Housing units in structures - Renters - Boat, RV, van, etc. (%)
House/condo owner moved in on average (years ago)
Renter moved in on average (years ago)
Year householder moved into unit - Moved in 1999 to March 2000 (%)
Year householder moved into unit - Moved in 1999 to March 2000 (%) - White
Year householder moved into unit - Moved in 1999 to March 2000 (%) - Black or African American
Year householder moved into unit - Moved in 1999 to March 2000 (%) - Asian
Year householder moved into unit - Moved in 1999 to March 2000 (%) - Hispanic or Latino
Year householder moved into unit - Moved in 1999 to March 2000 (%) - American Indian and Alaska Native
Year householder moved into unit - Moved in 1999 to March 2000 (%) - Multirace
Year householder moved into unit - Moved in 1999 to March 2000 (%) - Other Race
Year householder moved into unit - Moved in 1995 to 1998 (%)
Year householder moved into unit - Moved in 1995 to 1998 (%) - White
Year householder moved into unit - Moved in 1995 to 1998 (%) - Black or African American
Year householder moved into unit - Moved in 1995 to 1998 (%) - Asian
Year householder moved into unit - Moved in 1995 to 1998 (%) - Hispanic or Latino
Year householder moved into unit - Moved in 1995 to 1998 (%) - American Indian and Alaska Native
Year householder moved into unit - Moved in 1995 to 1998 (%) - Multirace
Year householder moved into unit - Moved in 1995 to 1998 (%) - Other Race
Year householder moved into unit - Moved in 1990 to 1994 (%)
Year householder moved into unit - Moved in 1990 to 1994 (%) - White
Year householder moved into unit - Moved in 1990 to 1994 (%) - Black or African American
Year householder moved into unit - Moved in 1990 to 1994 (%) - Asian
Year householder moved into unit - Moved in 1990 to 1994 (%) - Hispanic or Latino
Year householder moved into unit - Moved in 1990 to 1994 (%) - American Indian and Alaska Native
Year householder moved into unit - Moved in 1990 to 1994 (%) - Multirace
Year householder moved into unit - Moved in 1990 to 1994 (%) - Other Race
Year householder moved into unit - Moved in 1980 to 1989 (%)
Year householder moved into unit - Moved in 1980 to 1989 (%) - White
Year householder moved into unit - Moved in 1980 to 1989 (%) - Black or African American
Year householder moved into unit - Moved in 1980 to 1989 (%) - Asian
Year householder moved into unit - Moved in 1980 to 1989 (%) - Hispanic or Latino
Year householder moved into unit - Moved in 1980 to 1989 (%) - American Indian and Alaska Native
Year householder moved into unit - Moved in 1980 to 1989 (%) - Multirace
Year householder moved into unit - Moved in 1980 to 1989 (%) - Other Race
Year householder moved into unit - Moved in 1970 to 1979 (%)
Year householder moved into unit - Moved in 1970 to 1979 (%) - White
Year householder moved into unit - Moved in 1970 to 1979 (%) - Black or African American
Year householder moved into unit - Moved in 1970 to 1979 (%) - Asian
Year householder moved into unit - Moved in 1970 to 1979 (%) - Hispanic or Latino
Year householder moved into unit - Moved in 1970 to 1979 (%) - American Indian and Alaska Native
Year householder moved into unit - Moved in 1970 to 1979 (%) - Multirace
Year householder moved into unit - Moved in 1970 to 1979 (%) - Other Race
Year householder moved into unit - Moved in 1969 or earlier (%)
Year householder moved into unit - Moved in 1969 or earlier (%) - White
Year householder moved into unit - Moved in 1969 or earlier (%) - Black or African American
Year householder moved into unit - Moved in 1969 or earlier (%) - Asian
Year householder moved into unit - Moved in 1969 or earlier (%) - Hispanic or Latino
Year householder moved into unit - Moved in 1969 or earlier (%) - American Indian and Alaska Native
Year householder moved into unit - Moved in 1969 or earlier (%) - Multirace
Year householder moved into unit - Moved in 1969 or earlier (%) - Other Race
Housing units lacking complete plumbing facilities (%)
Housing units lacking complete kitchen facilities (%)
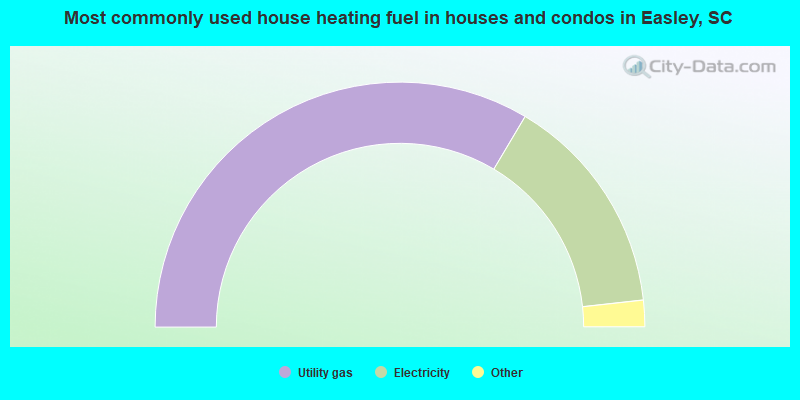
House heating fuel used in houses and condos - Utility gas (%)
House heating fuel used in houses and condos - Bottled, tank, or LP gas (%)
House heating fuel used in houses and condos - Electricity (%)
House heating fuel used in houses and condos - Fuel oil, kerosene, etc. (%)
House heating fuel used in houses and condos - Coal or coke (%)
House heating fuel used in houses and condos - Wood (%)
House heating fuel used in houses and condos - Solar energy (%)
House heating fuel used in houses and condos - Other fuel (%)
House heating fuel used in houses and condos - No fuel used (%)
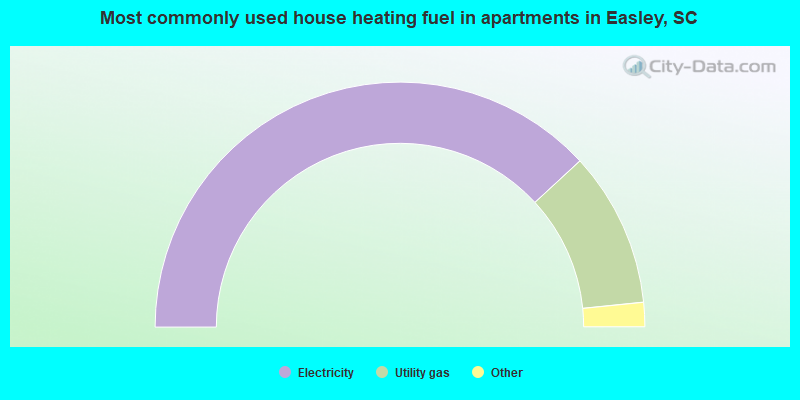
House heating fuel used in apartments - Utility gas (%)
House heating fuel used in apartments - Bottled, tank, or LP gas (%)
House heating fuel used in apartments - Electricity (%)
House heating fuel used in apartments - Fuel oil, kerosene, etc. (%)
House heating fuel used in apartments - Coal or coke (%)
House heating fuel used in apartments - Wood (%)
House heating fuel used in apartments - Solar energy (%)
House heating fuel used in apartments - Other fuel (%)
House heating fuel used in apartments - No fuel used (%)
Latest news about housing in Easley, SC collected exclusively by city-data.com from local newspapers, TV, and radio stations
Median year house/condo built: 1981Median year apartment built: 1987Household type by relationship:
Households: 23,550
Male householders: 4,785 (1,105 living alone ), Female householders: 5,650 (2,341 living alone )5,026 spouses (4,939 opposite-sex spouses ), 618 unmarried partners , (581 opposite-sex unmarried partners ), 5,617 children (5,057 natural , 235 adopted , 324 stepchildren ), 379 grandchildren , 194 brothers or sisters , 115 parents , 25 foster children , 326 other relatives , 537 non-relatives In group quarters: 272
Size of family households: 3,225 2-persons , 1,794 3-persons , 980 4-persons , 353 5-persons , 133 6-persons , 10 7-or-more-persons .
Size of nonfamily households: 3,564 1-person , 683 2-persons , 8 3-persons , 65 4-persons , 4 5-persons .
2,659 married couples with children. single-parent households (300 men , 869 women ).
94.4% of residents of Easley speak English at home. of residents speak Spanish at home (62% speak English very well , 13% speak English well , 25% speak English not well ).of residents speak other Indo-European language at home (71% speak English very well , 26% speak English well , 2% speak English not well ).of residents speak Asian or Pacific Island language at home (27% speak English very well , 47% speak English well , 27% speak English not well ).
Foreign born population: 1,131 (4.8%)of them are naturalized citizens )
Median number of rooms in houses and condos:
Median number of rooms in apartments
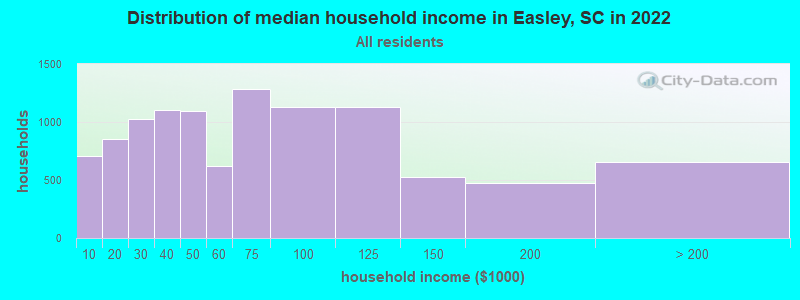
Easley, SC household income distribution 708 Less than $10,000856 $10,000 to $19,9991,025 $20,000 to $29,9991,103 $30,000 to $39,9991,096 $40,000 to $49,999624 $50,000 to $59,9991,288 $60,000 to $74,9991,126 $75,000 to $99,9991,133 $100,000 to $124,999522 $125,000 to $149,999473 $150,000 to $199,999652 $200,000 or more
Home value of owner - occupied houses in 2022 in Easley, SC 18 Less than $10,0005 $10,000 to $14,99918 $15,000 to $19,99932 $20,000 to $24,99917 $25,000 to $29,9995 $30,000 to $34,9996 $40,000 to $49,999111 $50,000 to $59,99930 $60,000 to $69,99978 $70,000 to $79,999104 $80,000 to $89,999100 $90,000 to $99,999391 $100,000 to $124,999237 $125,000 to $149,999714 $150,000 to $174,999439 $175,000 to $199,9991,313 $200,000 to $249,9991,320 $250,000 to $299,9991,293 $300,000 to $399,999635 $400,000 to $499,999293 $500,000 to $749,99937 $750,000 to $999,99912 $1,000,000 to $1,499,999504 $1,500,000 to $1,999,99912 $2,000,000 or moreRent paid by renters in 2022 in Easley, SC 111 $100 to $14920 $150 to $199100 $200 to $24939 $250 to $299488 $350 to $399428 $400 to $449124 $450 to $49963 $500 to $54966 $550 to $599516 $600 to $649250 $650 to $699257 $700 to $749257 $750 to $799284 $800 to $899409 $900 to $999160 $1,000 to $1,249147 $1,250 to $1,49985 $1,500 to $1,99910 $2,000 to $2,4996 $3,000 to $3,49966 $3,500 or more43 No cash rent
Percentage of workers working in this county: 41.6%Number of people working at home: 1,377 (12.0% of all workers )
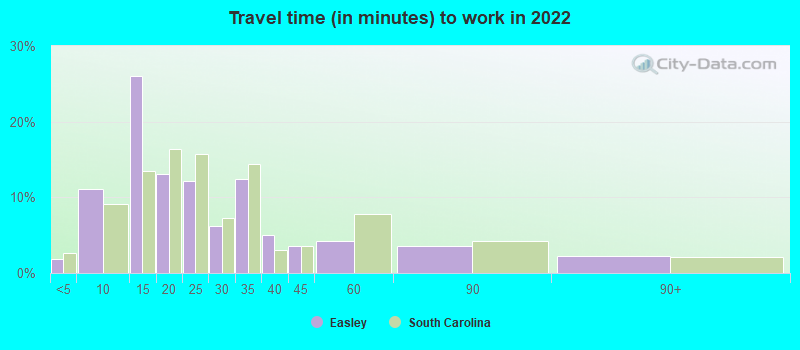
Travel time to work (commute)
Less than 5 minutes: 2485 to 9 minutes: 86610 to 14 minutes: 1,52715 to 19 minutes: 1,01320 to 24 minutes: 98025 to 29 minutes: 1,09030 to 34 minutes: 1,85635 to 39 minutes: 37840 to 44 minutes: 31445 to 59 minutes: 1,15760 to 89 minutes: 35990 or more minutes: 218
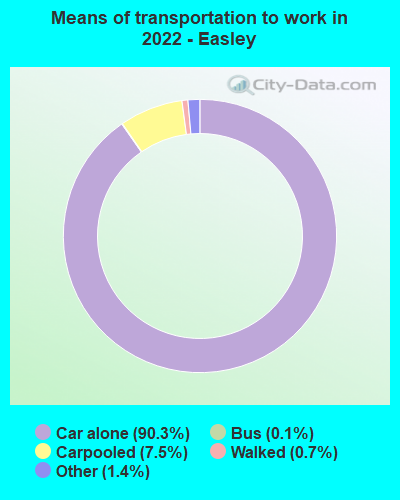
Means of transportation to work:
Drove a car alone: 9,367 (85.7%)Carpooled: 534 (4.9%)Bus : 11 (0.1%)Taxi: 250 (2.3%)Walked: 74 (0.7%)Worked at home: 812 (7.4%)
Unemployment by race in 2022
Unemployment rate for White non-Hispanic residents 2.6% Males5.9% FemalesUnemployment rate for Black residents 8.1% MalesUnemployment rate for two or more race residents 5.4% FemalesUnemployment rate for Hispanic or Latino residents 3.2% Males
Year of entry for the foreign-born population in Easley, South Carolina
225 2010 or later 429 2000 to 2009 98 1990 to 1999 36 1980 to 1989 69 1970 to 1979 69 Before 1970
First ancestries reported:
American: 2,368 (19.9%)
English: 2,110 (17.7%)
Irish: 857 (7.2%)
German: 670 (5.6%)
Scotch-Irish: 340 (2.9%)
Polish: 298 (2.5%)
Italian: 263 (2.2%)
Scottish: 250 (2.1%)
European: 196 (1.6%)
Norwegian: 157 (1.3%)
Greek: 79 (0.7%)
Russian: 42 (0.4%)
South African: 35 (0.3%)
British: 30 (0.3%)
Canadian: 29 (0.2%)
French: 25 (0.2%)
Swedish: 23 (0.2%)
Dutch: 17 (0.1%)
African: 14 (0.1%)
West Indian: 11 (0.09%)
Danish: 10 (0.08%)
Lebanese: 8 (0.07%)
Syrian: 8 (0.07%)
Austrian: 8 (0.07%)
French Canadian: 8 (0.07%)
Northern European: 7 (0.06%) Most common places of birth for foreign-born residents (%): Mexico Easley:
24.0% (241)South Carolina:
22.5% (60,774)
Guatemala Easley:
12.8% (129)South Carolina:
3.4% (9,058)
Greece Easley:
7.6% (76)South Carolina:
0.5% (1,296)
Germany Easley:
7.0% (70)South Carolina:
3.7% (9,982)
South Africa Easley:
5.7% (57)South Carolina:
0.4% (1,091)
Colombia Easley:
5.5% (55)South Carolina:
4.3% (11,533)
Canada Easley:
4.5% (45)South Carolina:
3.0% (8,193)
India Easley:
3.9% (39)South Carolina:
6.8% (18,307)
England Easley:
3.7% (37)South Carolina:
1.9% (5,117)
Honduras Easley:
3.6% (36)South Carolina:
4.8% (12,834)
Argentina Easley:
3.4% (34)South Carolina:
0.5% (1,414)
Poland Easley:
2.7% (27)South Carolina:
0.6% (1,691)
Micronesia Easley:
1.8% (18)South Carolina:
0.2% (505)
Bulgaria Easley:
1.7% (17)South Carolina:
0.2% (566)
Venezuela Easley:
1.7% (17)South Carolina:
1.4% (3,822)
Place of birth for U.S.-born residents:
This state: 14,241Other state: 8,164Northeast: 998Midwest: 2,433South: 4,017West: 860 85.6% of Easley residents lived in the same house 1 years ago.
Out of people who lived in different houses, 40.5% lived in this county.
Out of people who lived in different counties, 88.7% lived in South Carolina.
Easley:
85.6%State average:
86.5%
Education attainment for males 25 years and older:
No schooling: 110Nursery to 4th grade: 1155th and 6th grade: 07th and 8th grade: 1049th grade: 7510th grade: 13611th grade: 13612th grade, no diploma: 262High school graduate (or equivalency): 1,984Less than 1 year of college: 594Some college more than 1 year, no degree: 1,061Associate degree: 790Bachelor's degree: 1,275Master's degree: 771Professional school degree: 92Doctorate degree: 296
Education attainment for females 25 years and older:
No schooling: 83Nursery to 4th grade: 165th and 6th grade: 707th and 8th grade: 539th grade: 18310th grade: 33011th grade: 56312th grade, no diploma: 162High school graduate (or equivalency): 2,575Less than 1 year of college: 448Some college more than 1 year, no degree: 929Associate degree: 1,030Bachelor's degree: 1,612Master's degree: 749Professional school degree: 243Doctorate degree: 251
Housing units in structures:
One, detached: 8,414One, attached: 284Two: 2173 or 4: 3285 to 9: 95310 to 19: 23020 to 49: 18050 or more: 237Mobile homes: 571Boats, RVs, vans, etc.: 11Median worth of mobile homes: $134,068
Housing units lacking complete plumbing facilities in 2022: 1.7%Housing units lacking complete kitchen facilities in 2022: 4.1%House/condo owner moved in on average 9 years ago
Renter moved in on average 1 years ago
Private vs. public school enrollment:
Students in private schools in grades 1 to 8 (elementary and middle school): 241 Here:
13.2%South Carolina:
14.4%
Students in private schools in grades 9 to 12 (high school): 182 Here:
19.3%South Carolina:
11.1%
Students in private undergraduate colleges: 102 Here:
14.8%South Carolina:
21.9%