East Bridgewater, MA (Massachusetts) Houses and Residents
| East Bridgewater: | $536,272 |
| Massachusetts: | $534,700 |
Total population: 13,794 (Urban population: 12,536, Rural population: 438 (all nonfarm))
Houses: 4,427 (4,344 occupied: 3,564 owner occupied, 780 renter occupied)
| % of renters here: | 18% |
| State: | 38% |
Housing density: 257 houses/condos per square mile
Median price asked for vacant for-sale houses and condos in 2022 in this county: $446,078.
Median contract rent in 2022: $1,250 (lower quartile is $662, upper quartile is $1,802)
Median rent asked for vacant for-rent units in 2022: $1,725
Median gross rent in East Bridgewater, MA in 2022: $1,451
Housing units in East Bridgewater with a mortgage: 2,556 (231 second mortgage, 338 home equity loan, 9 both second mortgage and home equity loan)
Houses without a mortgage: 608
Compare current foreclosures near East Bridgewater, MA:
| Photo | Address | Area | Beds / Baths | Price | Details |
|---|---|---|---|---|---|

|
#1
Pond St
East Bridgewater, MA 02333
|
864 sq. feet
|
1 baths 2 beds |
show details | |

|
#2
Hubbard Rd
East Bridgewater, MA 02333
|
1,344 sq. feet
|
2 baths 4 beds |
show details | |

|
#3
Lillian St
East Bridgewater, MA 02333
|
864 sq. feet
|
1 baths 2 beds |
show details | |

|
#4
Walnut St
East Bridgewater, MA 02333
|
989 sq. feet
|
1 baths 3 beds |
show details | |

|
#5
Sherwood Cir
East Bridgewater, MA 02333
|
1,638 sq. feet
|
1 baths 3 beds |
show details | |

|
#6
N Water St
East Bridgewater, MA 02333
|
1,561 sq. feet
|
1 baths 3 beds |
show details | |

|
#7
Pond St
East Bridgewater, MA 02333
|
864 sq. feet
|
1 baths 2 beds |
show details | |

|
#8
Washington St
East Bridgewater, MA 02333
|
989 sq. feet
|
1 baths 3 beds |
show details | |

|
#9
Plymouth St
East Bridgewater, MA 02333
|
1,024 sq. feet
|
1 baths 2 beds |
show details | |

|
#10
Union St
East Bridgewater, MA 02333
|
1,344 sq. feet
|
2 baths - beds |
show details |
| Photo | Address | Area | Beds / Baths | Price | Details |
|---|---|---|---|---|---|

|
#11
Harvard St
East Bridgewater, MA 02333
|
1,743 sq. feet
|
1 baths - beds |
show details | |

|
#12
W Union St
East Bridgewater, MA 02333
|
1,872 sq. feet
|
2 baths - beds |
show details | |

|
#13
Wildwood Ave
East Bridgewater, MA 02333
|
891 sq. feet
|
2 baths - beds |
show details | |

|
#14
Spring St # 1
East Bridgewater, MA 02333
|
3,206 sq. feet
|
5 baths - beds |
show details | |

|
#15
Summer St
East Bridgewater, MA 02333
|
884 sq. feet
|
1 baths - beds |
show details | |

|
#16
Crabapple Way
East Bridgewater, MA 02333
|
2,496 sq. feet
|
2 baths - beds |
show details | |

|
#17
Marlin Rd
East Bridgewater, MA 02333
|
2,242 sq. feet
|
2 baths - beds |
show details | |

|
#18
Lynn Lee Ter
East Bridgewater, MA 02333
|
- sq. feet
|
- baths - beds |
show details | |

|
#19
N Bedford St
East Bridgewater, MA 02333
|
9,840 sq. feet
|
- baths - beds |
show details | |

|
#20
Whitman St
East Bridgewater, MA 02333
|
- sq. feet
|
- baths - beds |
show details |
| Photo | Address | Area | Beds / Baths | Price | Details |
|---|---|---|---|---|---|

|
#21
County St
East Taunton, MA 02718
|
1,157 sq. feet
|
1 baths 1 beds |
$219,900
|
show details |

|
#22
Heritage Ln
Duxbury, MA 02332
|
5,508 sq. feet
|
2 baths 5 beds |
$815,000
|
show details |

|
#23
Tall Oaks Dr Unit 508
South Weymouth, MA 02190
|
1,300 sq. feet
|
2 baths 2 beds |
$300,000
|
show details |

|
#24
Johnson Rd
North Weymouth, MA 02191
|
748 sq. feet
|
1 baths 2 beds |
$365,000
|
show details |

|
#25
Somerset Ave
Taunton, MA 02780
|
3,196 sq. feet
|
3 baths 4 beds |
$754,900
|
show details |

|
#26
Ballou St
Quincy, MA 02169
|
1,758 sq. feet
|
1 baths 3 beds |
show details | |

|
#27
Gay St
Quincy, MA 02169
|
1,330 sq. feet
|
1 baths 4 beds |
show details | |

|
#28
S Elm St
West Bridgewater, MA 02379
|
2,546 sq. feet
|
2 baths 4 beds |
show details | |

|
#29
Sunnybank Ave
Rockland, MA 02370
|
963 sq. feet
|
1 baths 2 beds |
show details | |

|
#30
Winter St
Hanson, MA 02341
|
1,844 sq. feet
|
3 baths 3 beds |
show details |
| Photo | Address | Area | Beds / Baths | Price | Details |
|---|---|---|---|---|---|

|
#31
Maxwell St
Taunton, MA 02780
|
1,537 sq. feet
|
2 baths 5 beds |
show details | |

|
#32
Plymouth St
Middleboro, MA 02346
|
1,624 sq. feet
|
1 baths 4 beds |
show details | |

|
#33
Commercial St
East Weymouth, MA 02189
|
2,100 sq. feet
|
3 baths 7 beds |
show details | |

|
#34
Summer St
Weymouth, MA 02188
|
1,413 sq. feet
|
2 baths 3 beds |
show details | |

|
#35
Ivy Ln
Lakeville, MA 02347
|
496 sq. feet
|
1 baths 1 beds |
show details | |

|
#36
Fountain Ln Apt 12
South Weymouth, MA 02190
|
746 sq. feet
|
1 baths 1 beds |
show details | |

|
#37
Rockwell Ave
Brockton, MA 02302
|
1,774 sq. feet
|
1 baths 3 beds |
show details | |

|
#38
Barker St
Pembroke, MA 02359
|
3,342 sq. feet
|
3 baths 4 beds |
show details | |

|
#39
Great Cedar Dr # 4
Hanson, MA 02341
|
- sq. feet
|
1 baths 2 beds |
show details | |

|
#40
N Main St
Middleboro, MA 02346
|
1,898 sq. feet
|
2 baths 4 beds |
show details |
| Photo | Address | Area | Beds / Baths | Price | Details |
|---|---|---|---|---|---|

|
#41
Cappys Way
Brockton, MA 02302
|
2,128 sq. feet
|
2 baths 4 beds |
show details | |

|
#42
Wilmarth Rd
Randolph, MA 02368
|
1,236 sq. feet
|
1 baths 2 beds |
show details | |

|
#43
Mill St
Mansfield, MA 02048
|
2,446 sq. feet
|
2 baths 3 beds |
show details | |

|
#44
Crane St
Norton, MA 02766
|
2,488 sq. feet
|
3 baths 4 beds |
show details | |

|
#45
Emily Jeffers Rd
Randolph, MA 02368
|
1,280 sq. feet
|
1 baths 3 beds |
show details | |

|
#46
Fremont St
North Attleboro, MA 02760
|
1,350 sq. feet
|
1 baths 2 beds |
show details | |

|
#47
Purchase St
Carver, MA 02330
|
960 sq. feet
|
1 baths 3 beds |
show details | |

|
#48
Sumner St
Taunton, MA 02780
|
1,392 sq. feet
|
2 baths 3 beds |
show details | |

|
#49
Helen Dr
Canton, MA 02021
|
3,183 sq. feet
|
3 baths 4 beds |
show details | |

|
Check over 1 million property listings on Foreclosure.com!
|
browse all offers | |||


Household type by relationship:
Households: 483,098- In family households: 417,329 (86,307 male householders, 41,618 female householders)
97,089 spouses, 154,870 children (146,729 natural, 3,391 adopted, 4,750 stepchildren), 8,780 grandchildren, 4,455 brothers or sisters, 5,200 parents, foster children, 5,123 other relatives, 10,196 non-relatives
- In nonfamily households: 65,769 (22,929 male householders (17,306 living alone)), 30,272 female householders (25,724 living alone)), 12,568 nonrelatives
- In group quarters: 11,821 (7,645 institutionalized population)
92,167 married couples with children.
24,193 single-parent households (4,628 men, 19,565 women).
94.7% of residents of East Bridgewater speak English at home.
0.6% of residents speak Spanish at home (62% speak English very well, 31% speak English well, 7% speak English not well).
4.4% of residents speak other Indo-European language at home (78% speak English very well, 16% speak English well, 6% speak English not well).
0.2% of residents speak other language at home (74% speak English very well, 26% speak English well).
Foreign born population: 982 (6.7%)
(75.5% of them are naturalized citizens)
| Here: | 6.8 |
| State: | 6.5 |
| Here: | 4.0 |
| State: | 4.0 |

- Bedrooms in owner-occupied houses and condos in East Bridgewater, Massachusetts
- 0no bedroom
- 731 bedroom
- 6802 bedrooms
- 1,8043 bedrooms
- 8214 bedrooms
- 1865+ bedrooms

- Bedrooms in renter-occupied apartments in East Bridgewater, Massachusetts
- 21no bedroom
- 3501 bedroom
- 2452 bedrooms
- 1073 bedrooms
- 444 bedrooms
- 135+ bedrooms

- Cars and other vehicles available in East Bridgewater in owner-occupied houses/condos
- 60no vehicle
- 6241 vehicle
- 1,9202 vehicles
- 5753 vehicles
- 3354 vehicles
- 505+ vehicles

- Cars and other vehicles available in East Bridgewater in renter-occupied apartments
- 122no vehicle
- 4431 vehicle
- 1542 vehicles
- 433 vehicles
- 144 vehicles
- 45+ vehicles

- Rooms in owner-occupied houses in East Bridgewater, Massachusetts
- 01 room
- 92 rooms
- 373 rooms
- 1974 rooms
- 6765 rooms
- 7996 rooms
- 8377 rooms
- 5468 rooms
- 4639+ rooms

- Rooms in renter-occupied apartments in East Bridgewater, Massachusetts
- 91 room
- 922 rooms
- 1993 rooms
- 2004 rooms
- 1545 rooms
- 816 rooms
- 197 rooms
- 138 rooms
- 139+ rooms


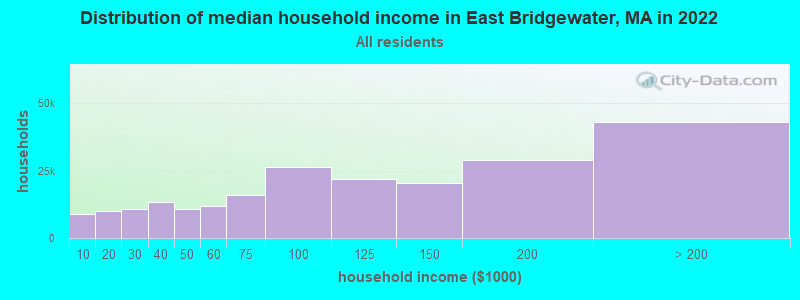
East Bridgewater, MA household income distribution

- 8,961Less than $10,000
- 10,073$10,000 to $19,999
- 10,871$20,000 to $29,999
- 13,358$30,000 to $39,999
- 10,599$40,000 to $49,999
- 12,008$50,000 to $59,999
- 15,843$60,000 to $74,999
- 26,367$75,000 to $99,999
- 22,023$100,000 to $124,999
- 20,433$125,000 to $149,999
- 29,044$150,000 to $199,999
- 42,965$200,000 or more
Percentage of workers working in this county: 65.6%
Number of people working at home: 1,308 (17.0% of all workers)
Travel time to work (commute)
- Less than 5 minutes: 182
- 5 to 9 minutes: 653
- 10 to 14 minutes: 907
- 15 to 19 minutes: 586
- 20 to 24 minutes: 822
- 25 to 29 minutes: 517
- 30 to 34 minutes: 848
- 35 to 39 minutes: 151
- 40 to 44 minutes: 228
- 45 to 59 minutes: 759
- 60 to 89 minutes: 627
- 90 or more minutes: 194
Means of transportation to work:
- Drove a car alone: 5,570 (84.3%)
- Carpooled: 620 (9.4%)
- Bus or trolley bus: 15 (0.2%)
- Subway or elevated: 13 (0.2%)
- Railroad: 178 (2.7%)
- Bicycle: 8 (0.1%)
- Walked: 40 (0.6%)
- Other means: 30 (0.5%)
- Worked at home: 137 (2.1%)


- Year of entry for the foreign-born population in East Bridgewater, Massachusetts
- 781995 to March 2000
- 331990 to 1994
- 211985 to 1989
- 271980 to 1984
- 791975 to 1979
- 331970 to 1974
- 851965 to 1969
- 133Before 1965

First ancestries reported:
- Irish: 4,210 (26.5%)
- Italian: 2,214 (14.0%)
- English: 2,011 (12.7%)
- Other: 1,031 (6.5%)
- French: 833 (5.3%)
- German: 818 (5.2%)
- United States: 793 (5.0%)
- French Canadian: 542 (3.4%)
- Swedish: 470 (3.0%)
- Scottish: 461 (2.9%)
- Portuguese: 437 (2.8%)
- Polish: 435 (2.7%)
- Scotch-Irish: 367 (2.3%)
- Subsaharan African: 255 (1.6%)
- Russian: 216 (1.4%)
- Lithuanian: 168 (1.1%)
- Norwegian: 161 (1.0%)
- Arab: 158 (1.0%)
- West Indian: 72 (0.5%)
- Dutch: 70 (0.4%)
- Greek: 66 (0.4%)
- Slovak: 23 (0.1%)
- Swiss: 14 (0.09%)
- Ukrainian: 14 (0.09%)
- Czech: 9 (0.06%)
- Welsh: 7 (0.04%)
- Danish: 6 (0.04%)
Most common places of birth for foreign-born residents (%):
| East Bridgewater: | 16.4% (80) |
| Massachusetts: | 2.6% (20,299) |
| East Bridgewater: | 11.7% (57) |
| Massachusetts: | 8.6% (66,627) |
| East Bridgewater: | 11.0% (54) |
| Massachusetts: | 2.3% (17,449) |
| East Bridgewater: | 11.0% (54) |
| Massachusetts: | 5.2% (40,247) |
| East Bridgewater: | 5.3% (26) |
| Massachusetts: | 3.7% (28,319) |
| East Bridgewater: | 5.1% (25) |
| Massachusetts: | 0.7% (5,693) |
| East Bridgewater: | 4.7% (23) |
| Massachusetts: | 0.4% (2,985) |
| East Bridgewater: | 4.3% (21) |
| Massachusetts: | 1.9% (14,883) |
| East Bridgewater: | 4.1% (20) |
| Massachusetts: | 2.3% (17,987) |
| East Bridgewater: | 3.5% (17) |
| Massachusetts: | 3.3% (25,403) |
| East Bridgewater: | 2.9% (14) |
| Massachusetts: | 1.7% (12,808) |
| East Bridgewater: | 2.9% (14) |
| Massachusetts: | 1.0% (7,867) |
| East Bridgewater: | 2.7% (13) |
| Massachusetts: | 4.4% (33,862) |
| East Bridgewater: | 2.2% (11) |
| Massachusetts: | 3.6% (28,086) |
| East Bridgewater: | 2.2% (11) |
| Massachusetts: | 0.0% (76) |
| East Bridgewater: | 1.8% (9) |
| Massachusetts: | 0.2% (1,710) |
| East Bridgewater: | 1.6% (8) |
| Massachusetts: | 0.8% (5,895) |
Place of birth for U.S.-born residents:
- This state: 11,103
- Other state: 1,348
- Northeast: 761
- Midwest: 180
- South: 238
- West: 169
68% of East Bridgewater residents lived in the same house 5 years ago.
Out of people who lived in different houses, 66% lived in this county.
Out of people who lived in different counties, 82% lived in Massachusetts.
Education attainment for males 25 years and older:
- No schooling: 29
- Nursery to 4th grade: 4
- 5th and 6th grade: 16
- 7th and 8th grade: 47
- 9th grade: 79
- 10th grade: 80
- 11th grade: 120
- 12th grade, no diploma: 123
- High school graduate (or equivalency): 1,516
- Less than 1 year of college: 278
- Some college more than 1 year, no degree: 542
- Associate degree: 285
- Bachelor's degree: 674
- Master's degree: 203
- Professional school degree: 29
- Doctorate degree: 10

Education attainment for females 25 years and older:
- No schooling: 5
- Nursery to 4th grade: 0
- 5th and 6th grade: 13
- 7th and 8th grade: 76
- 9th grade: 55
- 10th grade: 94
- 11th grade: 71
- 12th grade, no diploma: 151
- High school graduate (or equivalency): 1,627
- Less than 1 year of college: 386
- Some college more than 1 year, no degree: 536
- Associate degree: 440
- Bachelor's degree: 700
- Master's degree: 190
- Professional school degree: 59
- Doctorate degree: 13

Housing units in structures:
- One, detached: 3,378
- One, attached: 170
- Two: 282
- 3 or 4: 222
- 5 to 9: 290
- 10 to 19: 15
- 20 to 49: 38
- 50 or more: 7
- Mobile homes: 25
Median worth of mobile homes: $110,615

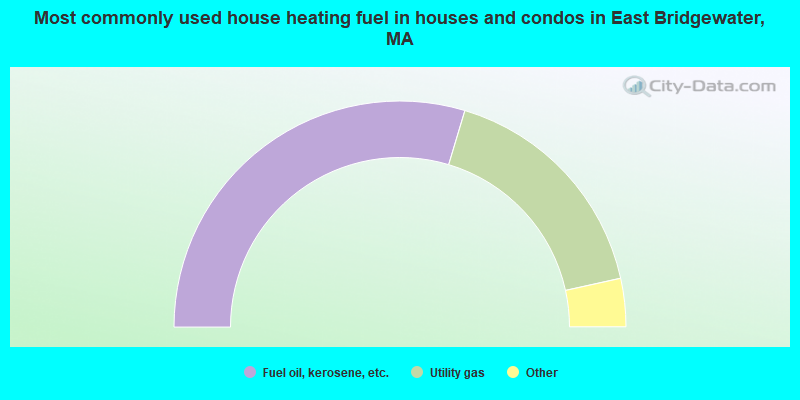
- 59.3%Fuel oil, kerosene, etc.
- 33.8%Utility gas
- 3.0%Electricity
- 2.4%Bottled, tank, or LP gas
- 1.3%Wood
- 0.3%Other fuel
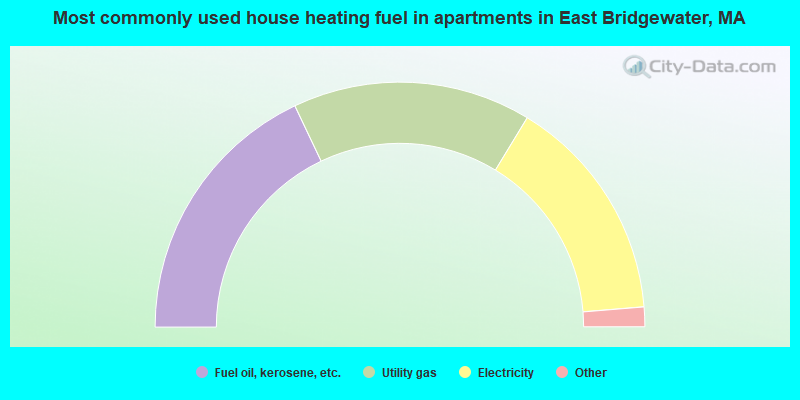
- 35.9%Fuel oil, kerosene, etc.
- 31.5%Utility gas
- 30.0%Electricity
- 1.7%Bottled, tank, or LP gas
- 0.9%Wood
Private vs. public school enrollment:
| Here: | 5.7% |
| Massachusetts: | 10.8% |
| Here: | 5.5% |
| Massachusetts: | 12.2% |
| Here: | 36.6% |
| Massachusetts: | 48.2% |


