East Colusa, CA (California) Houses and Residents
| East Colusa: | $420,957 |
| California: | $715,900 |
Total population: 9,242 (Urban population: 6,149 (all inside urban clusters), Rural population: 2,132 (222 farm, 1,910 nonfarm))
Houses: 3,182 (2,935 occupied: 1,796 owner occupied, 1,139 renter occupied)
| % of renters here: | 39% |
| State: | 44% |
Housing density: 12 houses/condos per square mile
Median price asked for vacant for-sale houses and condos in 2022 in this county: $270,007.
Median contract rent in 2022: $842 (lower quartile is $690, upper quartile is $1,072)
Median rent asked for vacant for-rent units in 2022: $660
Median gross rent in East Colusa, CA in 2022: $1,075
Housing units in East Colusa with a mortgage: 997 (133 second mortgage, 146 home equity loan, 10 both second mortgage and home equity loan)
Houses without a mortgage: 502


Household type by relationship:
Households: 21,194- In family households: 19,053 (3,793 male householders, 1,493 female householders)
4,033 spouses, 7,360 children (6,940 natural, 124 adopted, 296 stepchildren), 484 grandchildren, 333 brothers or sisters, 296 parents, foster children, 476 other relatives, 566 non-relatives
- In nonfamily households: 2,141 (906 male householders (726 living alone)), 864 female householders (749 living alone)), 371 nonrelatives
- In group quarters: 225 (190 institutionalized population)
4,240 married couples with children.
991 single-parent households (315 men, 676 women).
66.1% of residents of East Colusa speak English at home.
31.2% of residents speak Spanish at home (48% speak English very well, 21% speak English well, 20% speak English not well, 10% don't speak English at all).
2.1% of residents speak other Indo-European language at home (67% speak English very well, 18% speak English well, 12% speak English not well, 4% don't speak English at all).
0.4% of residents speak Asian or Pacific Island language at home (58% speak English very well, 42% speak English not well).
0.2% of residents speak other language at home (85% speak English very well, 15% speak English well).
Foreign born population: 2,113 (21.9%)
(39.8% of them are naturalized citizens)
| Here: | 6.0 |
| State: | 6.0 |
| Here: | 5.1 |
| State: | 3.9 |

- Bedrooms in owner-occupied houses and condos in East Colusa, California
- 54no bedroom
- 1051 bedroom
- 4272 bedrooms
- 9723 bedrooms
- 1834 bedrooms
- 555+ bedrooms

- Bedrooms in renter-occupied apartments in East Colusa, California
- 49no bedroom
- 3741 bedroom
- 4292 bedrooms
- 2333 bedrooms
- 454 bedrooms
- 95+ bedrooms

- Cars and other vehicles available in East Colusa in owner-occupied houses/condos
- 60no vehicle
- 4581 vehicle
- 8402 vehicles
- 3133 vehicles
- 824 vehicles
- 435+ vehicles

- Cars and other vehicles available in East Colusa in renter-occupied apartments
- 208no vehicle
- 4671 vehicle
- 3562 vehicles
- 933 vehicles
- 134 vehicles
- 25+ vehicles

- Rooms in owner-occupied houses in East Colusa, California
- 121 room
- 532 rooms
- 1373 rooms
- 1974 rooms
- 4405 rooms
- 4436 rooms
- 2487 rooms
- 1828 rooms
- 849+ rooms

- Rooms in renter-occupied apartments in East Colusa, California
- 381 room
- 1822 rooms
- 2633 rooms
- 1614 rooms
- 2775 rooms
- 1516 rooms
- 337 rooms
- 288 rooms
- 69+ rooms


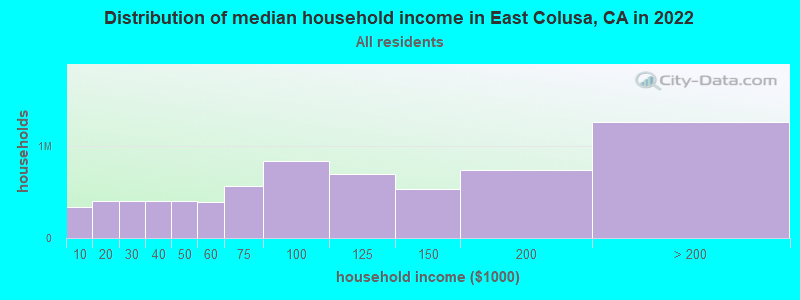
East Colusa, CA household income distribution

- 320,478Less than $10,000
- 386,038$10,000 to $19,999
- 379,897$20,000 to $29,999
- 382,886$30,000 to $39,999
- 381,710$40,000 to $49,999
- 372,719$50,000 to $59,999
- 540,992$60,000 to $74,999
- 800,177$75,000 to $99,999
- 666,551$100,000 to $124,999
- 504,485$125,000 to $149,999
- 707,265$150,000 to $199,999
- 1,205,413$200,000 or more
Percentage of workers working in this county: 85.5%
Number of people working at home: 706 (17.0% of all workers)
Travel time to work (commute)
- Less than 5 minutes: 335
- 5 to 9 minutes: 891
- 10 to 14 minutes: 367
- 15 to 19 minutes: 441
- 20 to 24 minutes: 321
- 25 to 29 minutes: 145
- 30 to 34 minutes: 235
- 35 to 39 minutes: 12
- 40 to 44 minutes: 93
- 45 to 59 minutes: 109
- 60 to 89 minutes: 170
- 90 or more minutes: 88
Means of transportation to work:
- Drove a car alone: 2,345 (71.0%)
- Carpooled: 508 (15.4%)
- Bus or trolley bus: 25 (0.8%)
- Motorcycle: 3 (0.1%)
- Bicycle: 82 (2.5%)
- Walked: 204 (6.2%)
- Other means: 40 (1.2%)
- Worked at home: 94 (2.8%)


- Year of entry for the foreign-born population in East Colusa, California
- 3631995 to March 2000
- 3241990 to 1994
- 3001985 to 1989
- 1911980 to 1984
- 1711975 to 1979
- 1111970 to 1974
- 1171965 to 1969
- 140Before 1965
Most common places of birth for foreign-born residents (%):
| East Colusa: | 88.2% (1,514) |
| California: | 44.3% (3,928,701) |
| East Colusa: | 3.4% (59) |
| California: | 0.3% (25,825) |
| East Colusa: | 2.0% (34) |
| California: | 2.2% (198,201) |
| East Colusa: | 1.6% (27) |
| California: | 4.1% (359,673) |
Place of birth for U.S.-born residents:
- This state: 5,468
- Other state: 1,076
- Northeast: 92
- Midwest: 275
- South: 344
- West: 365
59% of East Colusa residents lived in the same house 5 years ago.
Out of people who lived in different houses, 60% lived in this county.
Out of people who lived in different counties, 90% lived in California.
Education attainment for males 25 years and older:
- No schooling: 156
- Nursery to 4th grade: 71
- 5th and 6th grade: 167
- 7th and 8th grade: 77
- 9th grade: 40
- 10th grade: 71
- 11th grade: 82
- 12th grade, no diploma: 139
- High school graduate (or equivalency): 616
- Less than 1 year of college: 143
- Some college more than 1 year, no degree: 400
- Associate degree: 171
- Bachelor's degree: 184
- Master's degree: 40
- Professional school degree: 58
- Doctorate degree: 15

Education attainment for females 25 years and older:
- No schooling: 60
- Nursery to 4th grade: 71
- 5th and 6th grade: 149
- 7th and 8th grade: 98
- 9th grade: 70
- 10th grade: 56
- 11th grade: 88
- 12th grade, no diploma: 117
- High school graduate (or equivalency): 605
- Less than 1 year of college: 256
- Some college more than 1 year, no degree: 413
- Associate degree: 190
- Bachelor's degree: 244
- Master's degree: 55
- Professional school degree: 19
- Doctorate degree: 5


Housing units in structures:
- One, detached: 2,340
- One, attached: 111
- Two: 105
- 3 or 4: 117
- 5 to 9: 67
- 10 to 19: 36
- 20 to 49: 43
- 50 or more: 66
- Mobile homes: 248
- Boats, RVs, vans, etc.: 49
Median worth of mobile homes: $114,845
Housing units lacking complete kitchen facilities: 2.2%

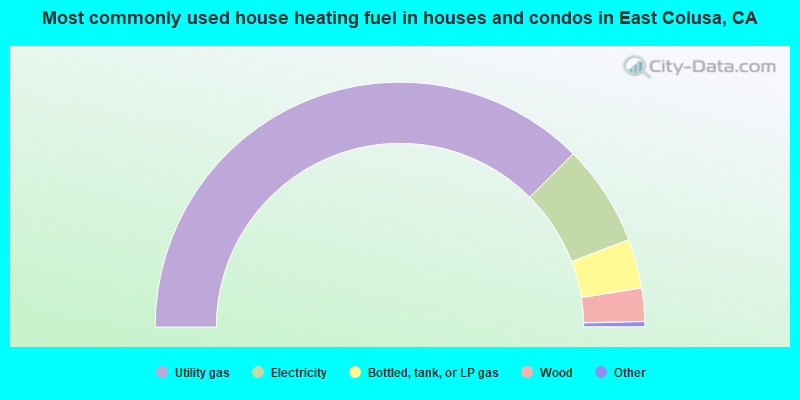
- 75.1%Utility gas
- 13.4%Electricity
- 6.5%Bottled, tank, or LP gas
- 4.4%Wood
- 0.3%Fuel oil, kerosene, etc.
- 0.2%No fuel used
- 0.1%Other fuel
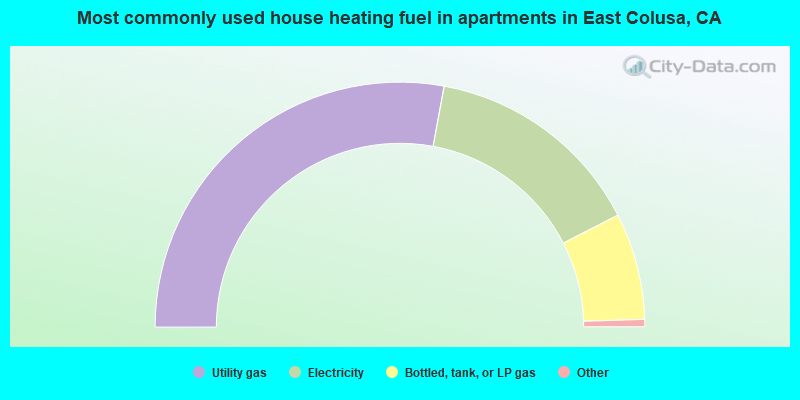
- 55.8%Utility gas
- 29.1%Electricity
- 14.1%Bottled, tank, or LP gas
- 0.5%Fuel oil, kerosene, etc.
- 0.4%Wood
Private vs. public school enrollment:
| Here: | 5.4% |
| California: | 9.9% |
| Here: | 3.4% |
| California: | 7.8% |
| Here: | 8.9% |
| California: | 15.4% |


