East Jefferson, TX (Texas) Houses and Residents
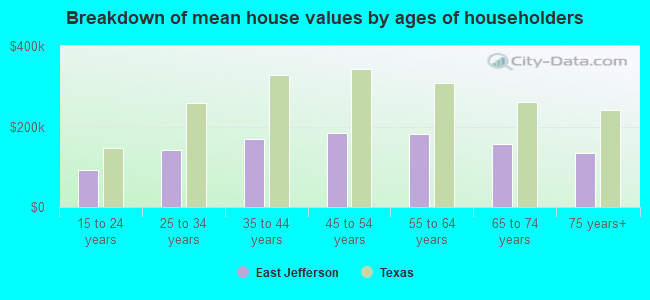
| East Jefferson: | $146,458 |
| Texas: | $275,400 |
Total population: 111,383 (All urban)
Houses: 46,315 (42,165 occupied: 29,187 owner occupied, 12,978 renter occupied)
| % of renters here: | 31% |
| State: | 38% |
Housing density: 462 houses/condos per square mile
Median price asked for vacant for-sale houses and condos in 2022 in this county: $179,024.
Median contract rent in 2022: $787 (lower quartile is $580, upper quartile is $1,048)
Median rent asked for vacant for-rent units in 2022: $759
Median gross rent in East Jefferson, TX in 2022: $967
Housing units in East Jefferson with a mortgage: 11,932 (319 second mortgage, 724 home equity loan, 0 both second mortgage and home equity loan)
Houses without a mortgage: 15,404


Household type by relationship:
Households: 236,290- In family households: 198,045 (39,440 male householders, 22,372 female householders)
40,897 spouses, 72,084 children (66,502 natural, 1,499 adopted, 4,083 stepchildren), 7,614 grandchildren, 3,005 brothers or sisters, 2,000 parents, foster children, 3,968 other relatives, 5,153 non-relatives
- In nonfamily households: 38,245 (15,508 male householders (12,452 living alone)), 16,121 female householders (14,263 living alone)), 6,616 nonrelatives
- In group quarters: 15,983 (13,291 institutionalized population)
37,587 married couples with children.
19,203 single-parent households (2,897 men, 16,306 women).
83.7% of residents of East Jefferson speak English at home.
9.9% of residents speak Spanish at home (49% speak English very well, 21% speak English well, 21% speak English not well, 9% don't speak English at all).
3.0% of residents speak other Indo-European language at home (72% speak English very well, 23% speak English well, 5% speak English not well).
3.2% of residents speak Asian or Pacific Island language at home (41% speak English very well, 29% speak English well, 24% speak English not well, 5% don't speak English at all).
0.2% of residents speak other language at home (59% speak English very well, 24% speak English well, 11% speak English not well, 6% don't speak English at all).
Foreign born population: 16,829 (14.6%)
(35.3% of them are naturalized citizens)
| Here: | 6.1 |
| State: | 6.3 |
| Here: | 4.4 |
| State: | 4.0 |
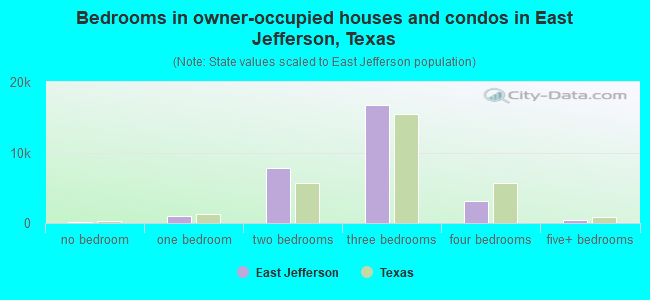
- Bedrooms in owner-occupied houses and condos in East Jefferson, Texas
- 193no bedroom
- 1,0431 bedroom
- 7,7972 bedrooms
- 16,7073 bedrooms
- 3,0684 bedrooms
- 3795+ bedrooms
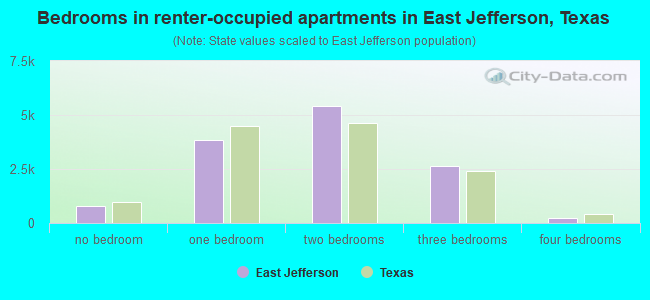
- Bedrooms in renter-occupied apartments in East Jefferson, Texas
- 801no bedroom
- 3,8471 bedroom
- 5,4202 bedrooms
- 2,6623 bedrooms
- 2154 bedrooms
- 335+ bedrooms
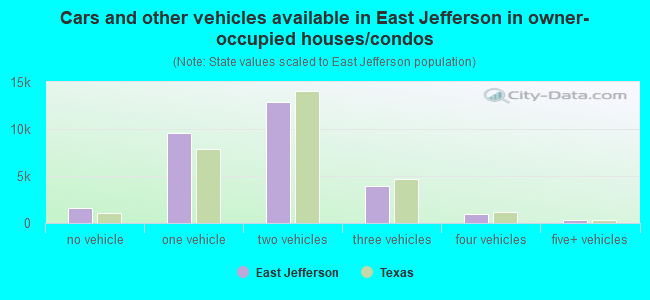
- Cars and other vehicles available in East Jefferson in owner-occupied houses/condos
- 1,588no vehicle
- 9,5351 vehicle
- 12,8762 vehicles
- 3,9153 vehicles
- 9674 vehicles
- 3065+ vehicles
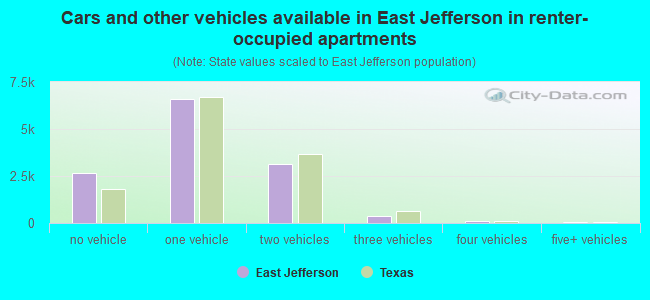
- Cars and other vehicles available in East Jefferson in renter-occupied apartments
- 2,674no vehicle
- 6,6061 vehicle
- 3,1432 vehicles
- 3883 vehicles
- 924 vehicles
- 755+ vehicles
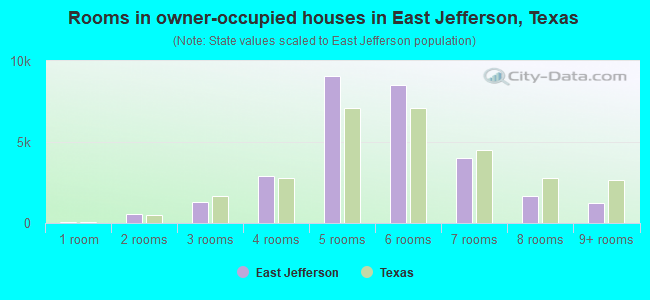
- Rooms in owner-occupied houses in East Jefferson, Texas
- 331 room
- 5252 rooms
- 1,2853 rooms
- 2,8734 rooms
- 9,0995 rooms
- 8,5016 rooms
- 3,9887 rooms
- 1,6608 rooms
- 1,2239+ rooms
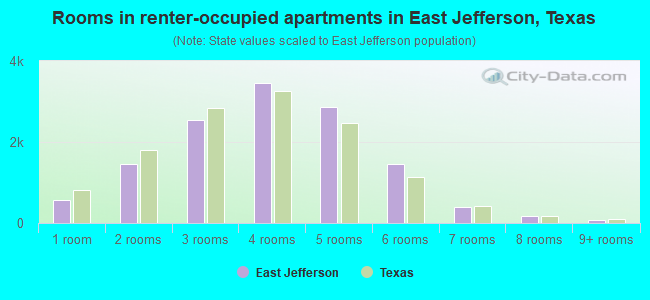
- Rooms in renter-occupied apartments in East Jefferson, Texas
- 5721 room
- 1,4532 rooms
- 2,5553 rooms
- 3,4634 rooms
- 2,8605 rooms
- 1,4566 rooms
- 3937 rooms
- 1638 rooms
- 639+ rooms
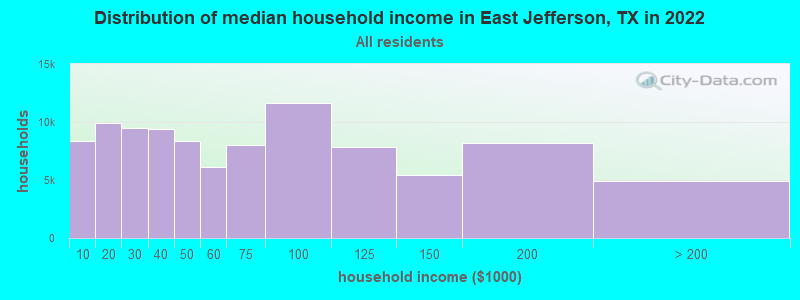
East Jefferson, TX household income distribution

- 8,389Less than $10,000
- 9,871$10,000 to $19,999
- 9,464$20,000 to $29,999
- 9,389$30,000 to $39,999
- 8,319$40,000 to $49,999
- 6,146$50,000 to $59,999
- 8,043$60,000 to $74,999
- 11,596$75,000 to $99,999
- 7,820$100,000 to $124,999
- 5,404$125,000 to $149,999
- 8,211$150,000 to $199,999
- 4,899$200,000 or more
Percentage of workers working in this county: 89.9%
Number of people working at home: 10,397 (15.1% of all workers)
Travel time to work (commute)
- Less than 5 minutes: 1,680
- 5 to 9 minutes: 6,253
- 10 to 14 minutes: 8,928
- 15 to 19 minutes: 8,897
- 20 to 24 minutes: 6,436
- 25 to 29 minutes: 2,208
- 30 to 34 minutes: 4,828
- 35 to 39 minutes: 440
- 40 to 44 minutes: 291
- 45 to 59 minutes: 814
- 60 to 89 minutes: 512
- 90 or more minutes: 857
Means of transportation to work:
- Drove a car alone: 35,768 (83.8%)
- Carpooled: 5,025 (11.8%)
- Bus or trolley bus: 148 (0.3%)
- Taxi: 19 (0.0%)
- Motorcycle: 60 (0.1%)
- Bicycle: 43 (0.1%)
- Walked: 609 (1.4%)
- Other means: 472 (1.1%)
- Worked at home: 525 (1.2%)
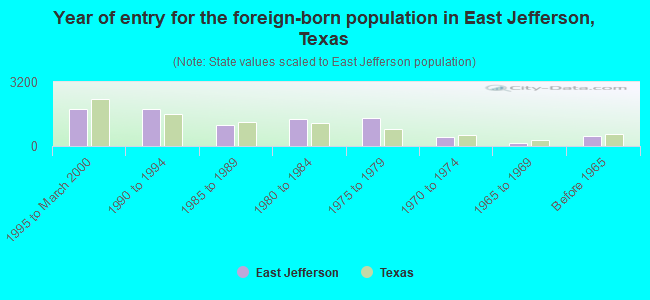
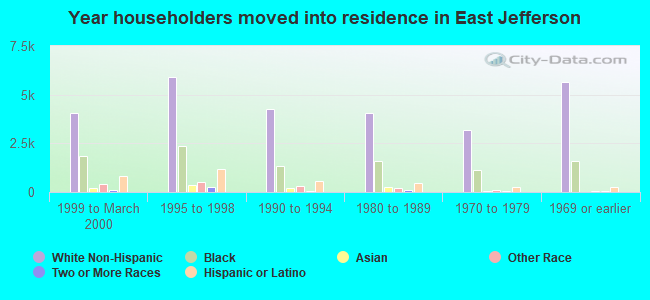
- Year of entry for the foreign-born population in East Jefferson, Texas
- 1,8641995 to March 2000
- 1,8671990 to 1994
- 1,0661985 to 1989
- 1,3261980 to 1984
- 1,3951975 to 1979
- 4451970 to 1974
- 1651965 to 1969
- 485Before 1965
Most common places of birth for foreign-born residents (%):
| East Jefferson: | 54.2% (4,665) |
| Texas: | 64.8% (1,879,369) |
| East Jefferson: | 21.0% (1,809) |
| Texas: | 3.7% (107,027) |
| East Jefferson: | 3.9% (339) |
| Texas: | 0.3% (9,470) |
| East Jefferson: | 3.3% (283) |
| Texas: | 2.7% (78,388) |
| East Jefferson: | 2.8% (238) |
| Texas: | 1.6% (45,907) |
| East Jefferson: | 1.7% (150) |
| Texas: | 1.2% (33,655) |
| East Jefferson: | 1.7% (149) |
| Texas: | 1.4% (39,249) |
| East Jefferson: | 1.7% (145) |
| Texas: | 0.2% (5,590) |
Place of birth for U.S.-born residents:
- This state: 80,824
- Other state: 26,097
- Northeast: 1,698
- Midwest: 3,519
- South: 18,759
- West: 2,121
61% of East Jefferson residents lived in the same house 5 years ago.
Out of people who lived in different houses, 67% lived in this county.
Out of people who lived in different counties, 70% lived in Texas.
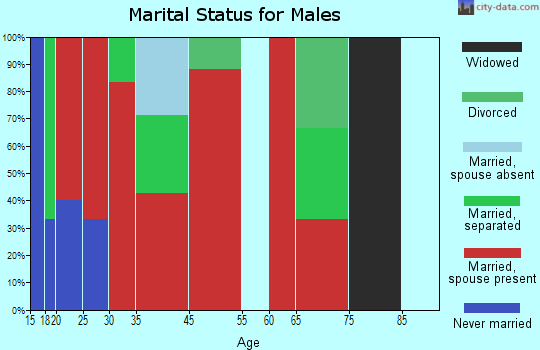
Education attainment for males 25 years and older:
- No schooling: 770
- Nursery to 4th grade: 467
- 5th and 6th grade: 941
- 7th and 8th grade: 1,293
- 9th grade: 1,186
- 10th grade: 1,275
- 11th grade: 1,233
- 12th grade, no diploma: 1,377
- High school graduate (or equivalency): 13,379
- Less than 1 year of college: 2,852
- Some college more than 1 year, no degree: 5,993
- Associate degree: 1,782
- Bachelor's degree: 3,371
- Master's degree: 655
- Professional school degree: 418
- Doctorate degree: 108

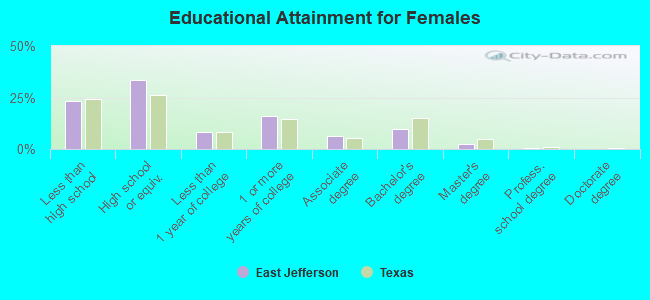
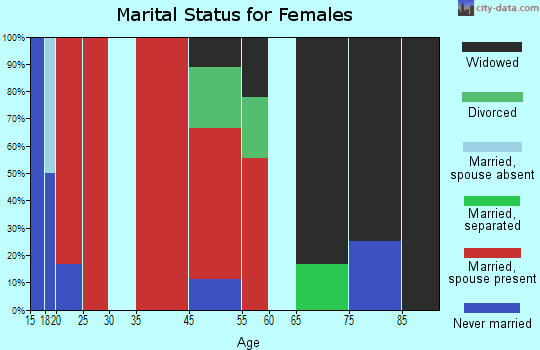
Education attainment for females 25 years and older:
- No schooling: 601
- Nursery to 4th grade: 486
- 5th and 6th grade: 918
- 7th and 8th grade: 1,442
- 9th grade: 1,004
- 10th grade: 1,452
- 11th grade: 1,234
- 12th grade, no diploma: 1,495
- High school graduate (or equivalency): 12,496
- Less than 1 year of college: 3,095
- Some college more than 1 year, no degree: 5,991
- Associate degree: 2,321
- Bachelor's degree: 3,544
- Master's degree: 950
- Professional school degree: 260
- Doctorate degree: 46
Housing units in structures:
- One, detached: 36,129
- One, attached: 946
- Two: 845
- 3 or 4: 873
- 5 to 9: 1,521
- 10 to 19: 1,652
- 20 to 49: 604
- 50 or more: 2,262
- Mobile homes: 1,389
- Boats, RVs, vans, etc.: 94
Median worth of mobile homes: $39,113
Housing units lacking complete kitchen facilities: 1.5%
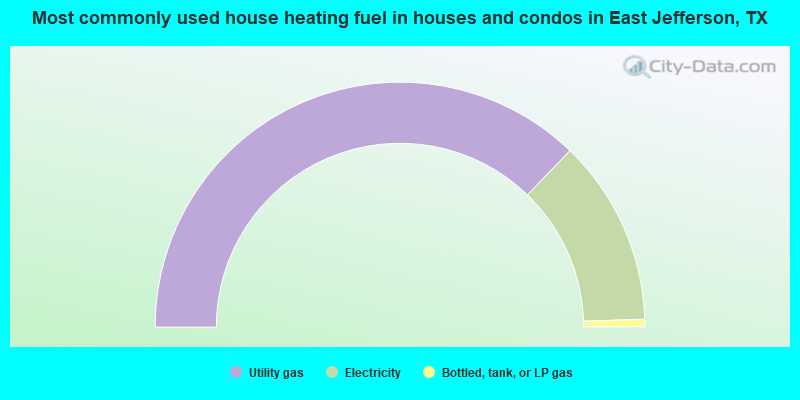
- 74.3%Utility gas
- 24.5%Electricity
- 1.0%Bottled, tank, or LP gas
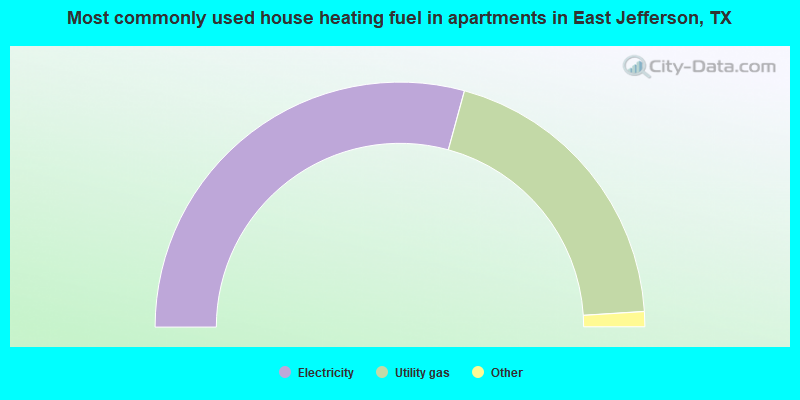
- 58.5%Electricity
- 39.5%Utility gas
- 1.2%Bottled, tank, or LP gas
- 0.6%No fuel used
- 0.2%Other fuel
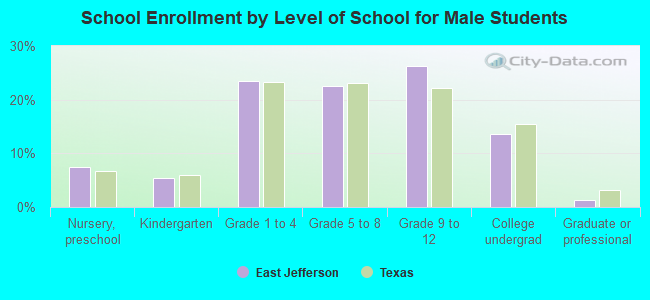
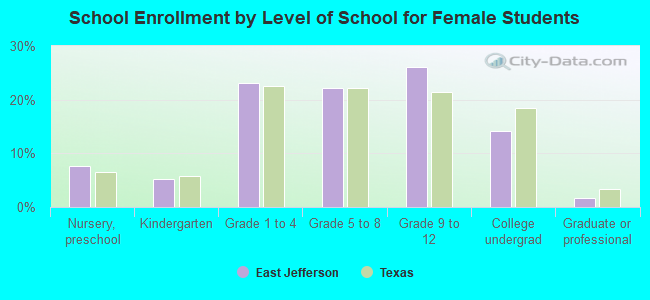
Private vs. public school enrollment:
| Here: | 4.6% |
| Texas: | 6.8% |
| Here: | 4.1% |
| Texas: | 6.2% |
| Here: | 7.9% |
| Texas: | 15.4% |