Housing density: 875 houses/condos per square mile
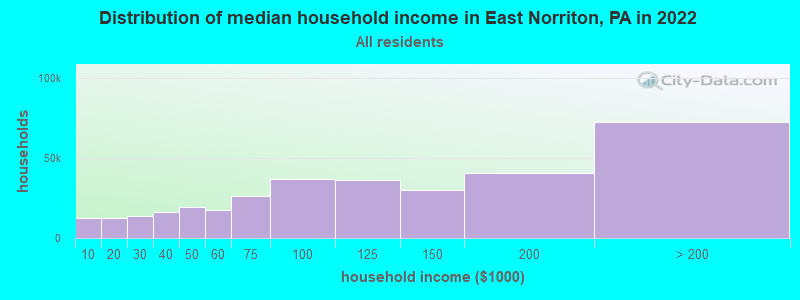
Median price asked for vacant for-sale houses and condos in 2022 in this county: $277,563.
Median contract rent in 2022: $1,673 (lower quartile is $1,385, upper quartile is over $2,000)
Median rent asked for vacant for-rent units in 2022: $1,876
Median gross rent in East Norriton, PA in 2022: $1,827
Housing units in East Norriton with a mortgage: 2,535 (241 second mortgage, 394 home equity loan, 0 both second mortgage and home equity loan) Houses without a mortgage: 1,129
Compare current foreclosures near East Norriton, PA:
In family households: 657,689 (153,043 male householders, 55,916 female householders)
168,592 spouses, 232,658 children (220,132 natural, 5,731 adopted, 6,795 stepchildren), 10,517 grandchildren, 5,677 brothers or sisters, 7,198 parents, foster children, 6,750 other relatives, 12,236 non-relatives
In nonfamily households: 121,179 (42,162 male householders (32,252 living alone)), 56,629 female householders (48,629 living alone)), 22,388 nonrelatives
In group quarters: 21,006 (13,115 institutionalized population)
143,178 married couples with children.
26,552 single-parent households (5,856 men, 20,696 women).
89.4% of residents of East Norriton speak English at home.
2.4% of residents speak Spanish at home (73% speak English very well, 21% speak English well, 6% speak English not well).
5.4% of residents speak other Indo-European language at home (74% speak English very well, 19% speak English well, 6% speak English not well, 1% don't speak English at all).
2.5% of residents speak Asian or Pacific Island language at home (46% speak English very well, 31% speak English well, 23% speak English not well).
0.3% of residents speak other language at home (88% speak English very well, 12% speak English well).
Foreign born population: 1,710 (11.3%)
(66.7% of them are naturalized citizens)
Year of entry for the foreign-born population in East Norriton, Pennsylvania
3031995 to March 2000
461990 to 1994
1051985 to 1989
811980 to 1984
961975 to 1979
1051970 to 1974
451965 to 1969
174Before 1965
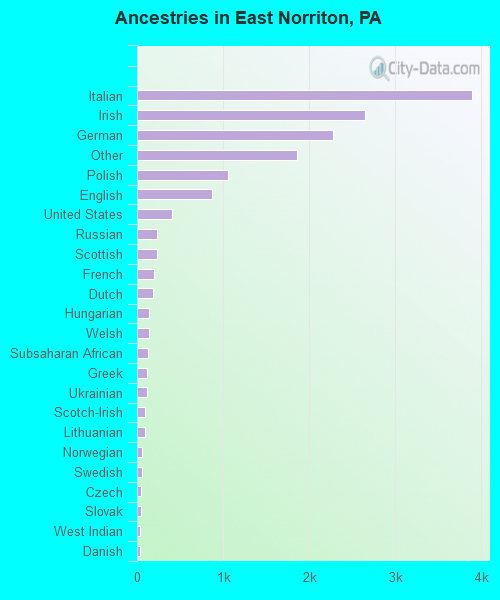
First ancestries reported:
Italian: 3,895 (25.9%)
Irish: 2,651 (17.7%)
German: 2,279 (15.2%)
Other: 1,860 (12.4%)
Polish: 1,063 (7.1%)
English: 874 (5.8%)
United States: 401 (2.7%)
Russian: 234 (1.6%)
Scottish: 227 (1.5%)
French: 194 (1.3%)
Dutch: 190 (1.3%)
Hungarian: 144 (1.0%)
Welsh: 135 (0.9%)
Subsaharan African: 128 (0.9%)
Greek: 113 (0.8%)
Ukrainian: 112 (0.7%)
Scotch-Irish: 96 (0.6%)
Lithuanian: 92 (0.6%)
Norwegian: 56 (0.4%)
Swedish: 55 (0.4%)
Czech: 45 (0.3%)
Slovak: 42 (0.3%)
West Indian: 40 (0.3%)
Danish: 39 (0.3%)
Arab: 17 (0.1%)
Swiss: 16 (0.1%)
French Canadian: 11 (0.07%)
Portuguese: 6 (0.04%)
Most common places of birth for foreign-born residents (%):
India
East Norriton:
24.7% (236)
Pennsylvania:
7.4% (37,541)
Korea
East Norriton:
13.3% (127)
Pennsylvania:
5.3% (26,703)
Italy
East Norriton:
9.3% (89)
Pennsylvania:
6.0% (30,559)
United Kingdom
East Norriton:
6.4% (61)
Pennsylvania:
4.6% (23,171)
Jamaica
East Norriton:
3.8% (36)
Pennsylvania:
2.4% (12,390)
Ecuador
East Norriton:
3.7% (35)
Pennsylvania:
0.5% (2,562)
Canada
East Norriton:
3.5% (33)
Pennsylvania:
3.0% (15,200)
Greece
East Norriton:
3.1% (30)
Pennsylvania:
1.4% (7,362)
Vietnam
East Norriton:
3.1% (30)
Pennsylvania:
5.2% (26,656)
Other Western Africa
East Norriton:
3.1% (30)
Pennsylvania:
0.9% (4,385)
Poland
East Norriton:
2.8% (27)
Pennsylvania:
2.3% (11,916)
China, excluding Hong Kong and Taiwan
East Norriton:
2.8% (27)
Pennsylvania:
4.6% (23,478)
Nigeria
East Norriton:
2.2% (21)
Pennsylvania:
0.6% (2,934)
Russia
East Norriton:
1.9% (18)
Pennsylvania:
2.7% (13,885)
Philippines
East Norriton:
1.9% (18)
Pennsylvania:
2.2% (11,411)
Cambodia
East Norriton:
1.7% (16)
Pennsylvania:
1.3% (6,656)
Place of birth for U.S.-born residents:
This state: 10,129
Other state: 1,997
Northeast: 1,056
Midwest: 213
South: 474
West: 254
70% of East Norriton residents lived in the same house 5 years ago. Out of people who lived in different houses, 57% lived in this county. Out of people who lived in different counties, 74% lived in Pennsylvania.
Education attainment for males 25 years and older:
No schooling: 24
Nursery to 4th grade: 9
5th and 6th grade: 15
7th and 8th grade: 91
9th grade: 62
10th grade: 103
11th grade: 127
12th grade, no diploma: 114
High school graduate (or equivalency): 1,245
Less than 1 year of college: 234
Some college more than 1 year, no degree: 604
Associate degree: 308
Bachelor's degree: 1,066
Master's degree: 485
Professional school degree: 101
Doctorate degree: 58
Education attainment for females 25 years and older:
No schooling: 30
Nursery to 4th grade: 10
5th and 6th grade: 36
7th and 8th grade: 116
9th grade: 107
10th grade: 143
11th grade: 127
12th grade, no diploma: 157
High school graduate (or equivalency): 1,737
Less than 1 year of college: 395
Some college more than 1 year, no degree: 606
Associate degree: 322
Bachelor's degree: 957
Master's degree: 421
Professional school degree: 57
Doctorate degree: 56
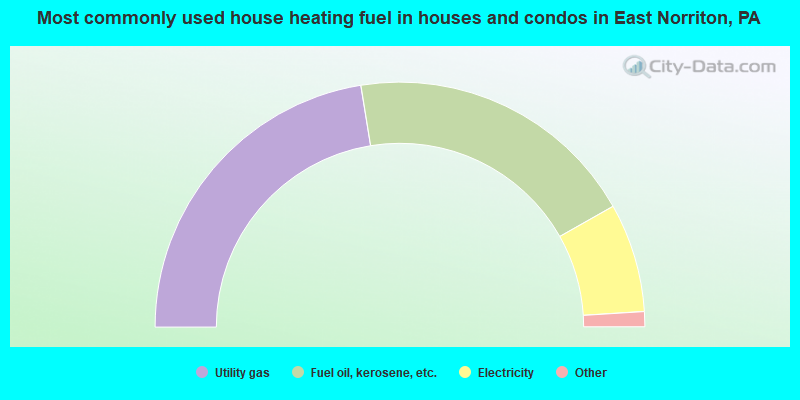
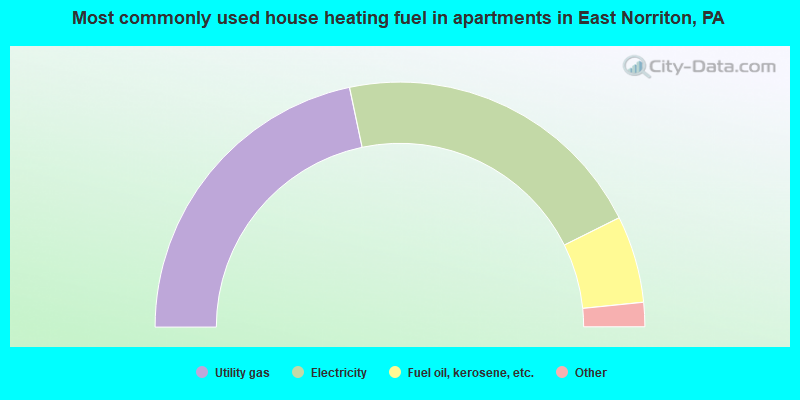
Housing units in structures:
One, detached: 3,645
One, attached: 463
Two: 40
3 or 4: 13
5 to 9: 133
10 to 19: 311
20 to 49: 117
50 or more: 592
Boats, RVs, vans, etc.: 6
Housing units lacking complete plumbing facilities: 0.2%
Housing units lacking complete kitchen facilities: 0.2%