East Providence, RI (Rhode Island) Houses and Residents
| East Providence: | $332,611 |
| Rhode Island: | $383,900 |
Mean price in 2022:
Detached houses: $345,716
Here: $345,716 State: $445,354 Townhouses or other attached units: $364,641
Here: $364,641 State: $371,092 In 2-unit structures: $357,504
Here: $357,504 State: $317,098 In 3-to-4-unit structures: $312,741
Here: $312,741 State: $315,052 In 5-or-more-unit structures: $152,047
Here: $152,047 State: $291,252 Mobile homes: $37,682
Here: $37,682 State: $105,454
Total population: 47,331 (All urban)
Houses: 21,827 (20,512 occupied: 12,806 owner occupied, 8,397 renter occupied)
| % of renters here: | 40% |
| State: | 37% |
Housing density: 1,628 houses/condos per square mile
Median price asked for vacant for-sale houses and condos in 2022: $332,502.
Median contract rent in 2022: $1,131 (lower quartile is $597, upper quartile is $1,574)
Median rent asked for vacant for-rent units in 2022: $520
Median gross rent in East Providence, RI in 2022: $1,272
Housing units in East Providence with a mortgage: 8,125 (1,630 second mortgage, 64 home equity loan, 1,219 both second mortgage and home equity loan)
Houses without a mortgage: 231
Median household income for houses/condos with a mortgage: $116,940
Median household income for apartments without a mortgage: $76,942
Median monthly housing costs: $1,380
Compare current foreclosures near East Providence, RI:
| Photo | Address | Area | Beds / Baths | Price | Details |
|---|---|---|---|---|---|

|
#1
Blanding Ave
East Providence, RI 02914
|
1,165 sq. feet
|
1 baths 3 beds |
show details | |

|
#2
Follett St
East Providence, RI 02914
|
1,584 sq. feet
|
2 baths 4 beds |
show details | |

|
#3
Belmont Ave
East Providence, RI 02914
|
1,344 sq. feet
|
1 baths 2 beds |
show details | |

|
#4
Warren Ave # 2
East Providence, RI 02914
|
2,508 sq. feet
|
3 baths 5 beds |
show details | |

|
#5
Arlington St
East Providence, RI 02914
|
1,092 sq. feet
|
2 baths 2 beds |
show details | |

|
#6
Maxfield Ave
East Providence, RI 02914
|
1,296 sq. feet
|
1 baths 2 beds |
show details | |

|
#7
Goldsmith Ave Apt 507
East Providence, RI 02914
|
- sq. feet
|
- baths - beds |
show details | |

|
#8
Hebron Ave
Attleboro, MA 02703
|
2,939 sq. feet
|
4 baths 6 beds |
$559,900
|
show details |

|
#9
Loomis St
North Attleboro, MA 02760
|
2,294 sq. feet
|
2 baths 4 beds |
$700,000
|
show details |

|
#10
County St
East Taunton, MA 02718
|
1,157 sq. feet
|
1 baths 1 beds |
$219,900
|
show details |
| Photo | Address | Area | Beds / Baths | Price | Details |
|---|---|---|---|---|---|

|
#11
Somerset Ave
Taunton, MA 02780
|
3,196 sq. feet
|
3 baths 4 beds |
$754,900
|
show details |

|
#12
Whittier Ave
Providence, RI 02909
|
3 sq. feet
|
3 baths 6 beds |
$109,900
|
show details |

|
#13
Cook Rd
Cumberland, RI 02864
|
2,050 sq. feet
|
2 baths 4 beds |
$749,500
|
show details |

|
#14
Horton St
North Dighton, MA 02764
|
816 sq. feet
|
1 baths 2 beds |
$259,900
|
show details |

|
#15
Albion St
Fall River, MA 02723
|
2,481 sq. feet
|
3 baths 6 beds |
show details | |

|
#16
What Cheer Ave
Providence, RI 02909
|
2,280 sq. feet
|
2 baths 3 beds |
show details | |

|
#17
Spooner Ave
Warwick, RI 02886
|
1,777 sq. feet
|
2 baths 4 beds |
show details | |

|
#18
Guertin St
West Warwick, RI 02893
|
1,338 sq. feet
|
2 baths 4 beds |
show details | |

|
#19
Wingold St
Fall River, MA 02720
|
1,028 sq. feet
|
1 baths 2 beds |
show details | |

|
#20
Woburn St
Cranston, RI 02910
|
1,212 sq. feet
|
1 baths 4 beds |
show details |
| Photo | Address | Area | Beds / Baths | Price | Details |
|---|---|---|---|---|---|

|
#21
Atwood Ave
Johnston, RI 02919
|
1,792 sq. feet
|
1 baths 4 beds |
show details | |

|
#22
Pokross St
Fall River, MA 02724
|
960 sq. feet
|
1 baths 3 beds |
show details | |

|
#23
Pinnery Ave
Warwick, RI 02886
|
1,299 sq. feet
|
1 baths 3 beds |
show details | |

|
#24
Mount Hope St
North Attleboro, MA 02760
|
3,554 sq. feet
|
2 baths 4 beds |
show details | |

|
#25
Putnam Pike
Greenville, RI 02828
|
1,114 sq. feet
|
1 baths 2 beds |
show details | |

|
#26
Atwood Ave
Johnston, RI 02919
|
1,792 sq. feet
|
2 baths 4 beds |
show details | |

|
#27
Valley Green Court
Providence, RI 02904
|
1,440 sq. feet
|
3 baths 2 beds |
show details | |

|
#28
Thacher St
Attleboro, MA 02703
|
1,040 sq. feet
|
1 baths 3 beds |
show details | |

|
#29
Lewis St
Dighton, MA 02715
|
3,144 sq. feet
|
2 baths 3 beds |
show details | |

|
#30
Van Zandt Ave
Warwick, RI 02889
|
800 sq. feet
|
1 baths 4 beds |
show details |
| Photo | Address | Area | Beds / Baths | Price | Details |
|---|---|---|---|---|---|

|
#31
Knotty Oak Rd
Coventry, RI 02816
|
1,080 sq. feet
|
1 baths 2 beds |
show details | |

|
#32
Peckham Ln
Coventry, RI 02816
|
2,623 sq. feet
|
3 baths 3 beds |
show details | |

|
#33
Branch Ave
Providence, RI 02904
|
2,921 sq. feet
|
4 baths 6 beds |
show details | |

|
#34
Tyndall Ave
Providence, RI 02908
|
1,523 sq. feet
|
1 baths 4 beds |
show details | |

|
#35
Depot St
North Attleboro, MA 02760
|
- sq. feet
|
2 baths 3 beds |
show details | |

|
#36
Claremont Avenue A/k/a 5 Claremont Avenue
Bristol, RI 02809
|
1,852 sq. feet
|
2 baths 2 beds |
show details | |

|
#37
Chace Ave
Warren, RI 02885
|
1,224 sq. feet
|
1 baths 2 beds |
show details | |

|
#38
Hazard Ave
Warwick, RI 02889
|
1,017 sq. feet
|
1 baths 3 beds |
show details | |

|
#39
Marion Avenue
Providence, RI 02905
|
1,252 sq. feet
|
1 baths 3 beds |
show details | |

|
#40
Hancock St
Tiverton, RI 02878
|
1,628 sq. feet
|
2 baths 3 beds |
show details |
| Photo | Address | Area | Beds / Baths | Price | Details |
|---|---|---|---|---|---|

|
#41
Maxwell St
Taunton, MA 02780
|
1,537 sq. feet
|
2 baths 5 beds |
show details | |

|
#42
Cynthia Dr Apt 13
North Providence, RI 02911
|
768 sq. feet
|
1 baths 2 beds |
show details | |

|
#43
Lisa Ln
Bristol, RI 02809
|
1,658 sq. feet
|
2 baths 3 beds |
show details | |

|
#44
Grove St
Woonsocket, RI 02895
|
2,534 sq. feet
|
3 baths 6 beds |
show details | |

|
#45
Verndale St
Warwick, RI 02889
|
1,206 sq. feet
|
1 baths 2 beds |
show details | |

|
#46
Coventry Dr
Coventry, RI 02816
|
1,560 sq. feet
|
1 baths 3 beds |
show details | |

|
#47
A South County Trail
East Greenwich, RI 02818
|
1,748 sq. feet
|
1 baths 2 beds |
show details | |

|
#48
Crestview Ave
Somerset, MA 02725
|
988 sq. feet
|
1 baths 2 beds |
show details | |

|
#49
Emory St
Attleboro, MA 02703
|
1,872 sq. feet
|
1 baths 3 beds |
show details | |

|
Check over 1 million property listings on Foreclosure.com!
|
browse all offers | |||


 | House shot at in East Providence (0 replies) |
| Rhode Island Housing Crisis? (51 replies) |
| Crazy Rhode Island real estate market (525 replies) |
| Providence General Crime Thread (All Posts Go Here) (2858 replies) |
| Safety on Abbott St (east side of Providence) (86 replies) |
| Is now a good time to buy in RI? (107 replies) |
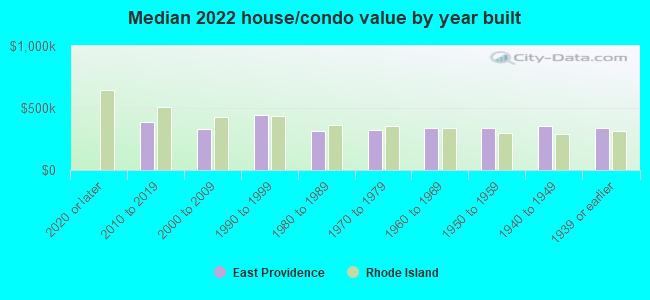
Median year apartment built: 1966
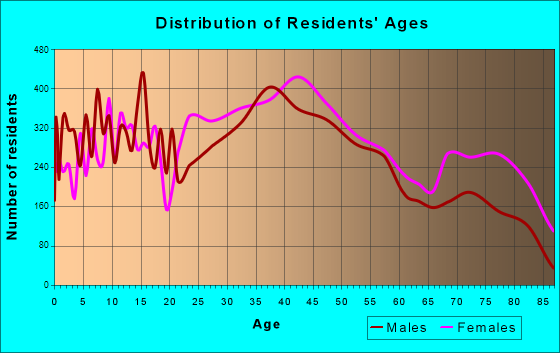
Household type by relationship:
Households: 46,962- Male householders: 9,522 (3,335 living alone), Female householders: 10,865 (4,248 living alone)
8,601 spouses (8,466 opposite-sex spouses), 1,750 unmarried partners, (1,616 opposite-sex unmarried partners), 12,080 children (11,146 natural, 328 adopted, 605 stepchildren), 465 grandchildren, 437 brothers or sisters, 576 parents, 100 foster children, 599 other relatives, 1,222 non-relatives
- In group quarters: 739
Size of family households: 5,706 2-persons, 2,498 3-persons, 2,163 4-persons, 792 5-persons, 169 6-persons, 135 7-or-more-persons.
Size of nonfamily households: 8,107 1-person, 1,606 2-persons, 54 3-persons, 5 4-persons.
5,051 married couples with children.
2,108 single-parent households (942 men, 1,166 women).
77.4% of residents of East Providence speak English at home.
5.9% of residents speak Spanish at home (73% speak English very well, 16% speak English well, 10% speak English not well, 1% don't speak English at all).
14.1% of residents speak other Indo-European language at home (66% speak English very well, 20% speak English well, 8% speak English not well, 7% don't speak English at all).
1.1% of residents speak Asian or Pacific Island language at home (50% speak English very well, 43% speak English well, 7% speak English not well).
0.4% of residents speak other language at home (89% speak English very well, 11% speak English well).
Foreign born population: 7,168 (15.3%)
(55.8% of them are naturalized citizens)
| Here: | 6.0 |
| State: | 6.2 |
| Here: | 3.9 |
| State: | 4.1 |
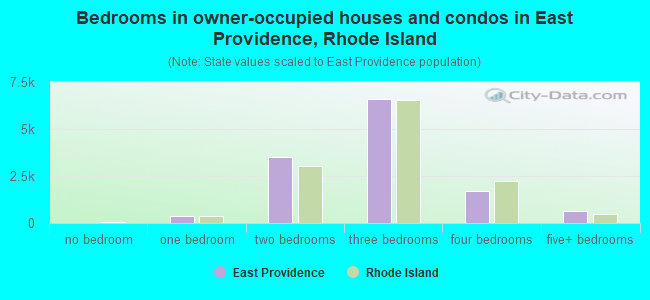
- Bedrooms in owner-occupied houses and condos in East Providence, Rhode Island
- 23no bedroom
- 3841 bedroom
- 3,5042 bedrooms
- 6,5753 bedrooms
- 1,6894 bedrooms
- 6315+ bedrooms
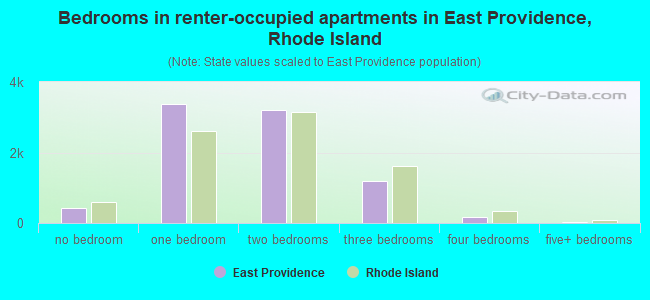
- Bedrooms in renter-occupied apartments in East Providence, Rhode Island
- 419no bedroom
- 3,3721 bedroom
- 3,2142 bedrooms
- 1,2013 bedrooms
- 1764 bedrooms
- 165+ bedrooms
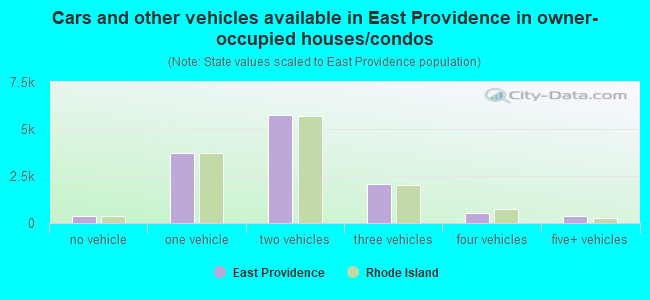
- Cars and other vehicles available in East Providence in owner-occupied houses/condos
- 393no vehicle
- 3,7081 vehicle
- 5,7442 vehicles
- 2,0853 vehicles
- 5244 vehicles
- 3535+ vehicles
- Cars and other vehicles available in East Providence in renter-occupied apartments
- 1,556no vehicle
- 4,7881 vehicle
- 1,7272 vehicles
- 2293 vehicles
- 984 vehicles
- 05+ vehicles
- Rooms in owner-occupied houses in East Providence, Rhode Island
- 231 room
- 182 rooms
- 3323 rooms
- 1,3894 rooms
- 3,1905 rooms
- 3,1576 rooms
- 2,1547 rooms
- 9878 rooms
- 1,5569+ rooms
- Rooms in renter-occupied apartments in East Providence, Rhode Island
- 3951 room
- 8992 rooms
- 1,9513 rooms
- 2,2354 rooms
- 1,9545 rooms
- 3356 rooms
- 3057 rooms
- 1828 rooms
- 1429+ rooms
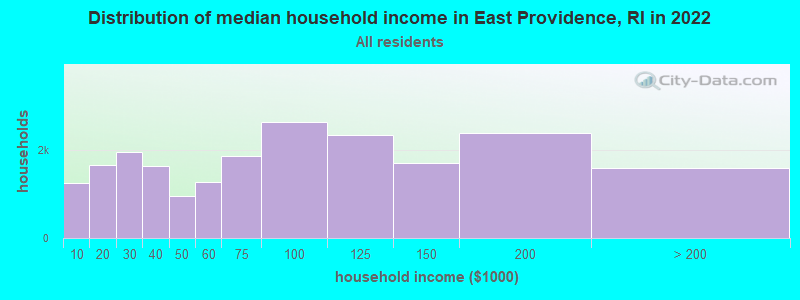
East Providence, RI household income distribution

- 1,234Less than $10,000
- 1,660$10,000 to $19,999
- 1,935$20,000 to $29,999
- 1,630$30,000 to $39,999
- 961$40,000 to $49,999
- 1,268$50,000 to $59,999
- 1,847$60,000 to $74,999
- 2,625$75,000 to $99,999
- 2,331$100,000 to $124,999
- 1,707$125,000 to $149,999
- 2,371$150,000 to $199,999
- 1,594$200,000 or more
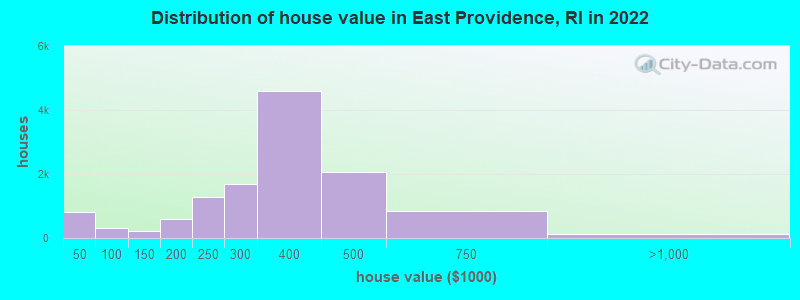
Home value of owner - occupied houses in 2022 in East Providence, RI
-
- 331Less than $10,000
- 7$10,000 to $14,999
- 12$20,000 to $24,999
- 19$25,000 to $29,999
- 47$30,000 to $34,999
- 91$35,000 to $39,999
- 292$40,000 to $49,999
- 6$80,000 to $89,999
- 15$90,000 to $99,999
- 32$100,000 to $124,999
- 180$125,000 to $149,999
- 418$150,000 to $174,999
- 169$175,000 to $199,999
- 1,276$200,000 to $249,999
- 1,701$250,000 to $299,999
- 4,599$300,000 to $399,999
- 2,052$400,000 to $499,999
- 844$500,000 to $749,999
- 63$750,000 to $999,999
- 26$1,000,000 to $1,499,999
- 37$2,000,000 or more
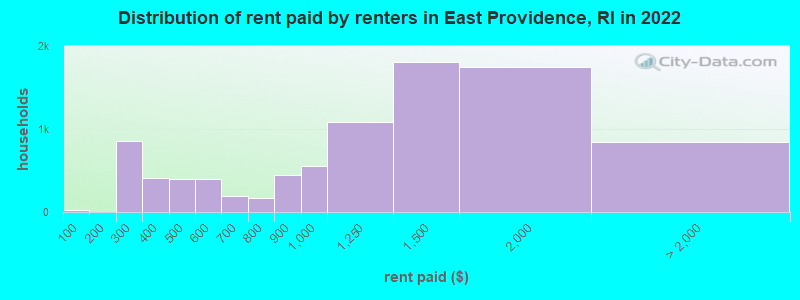
Rent paid by renters in 2022 in East Providence, RI
-
- 29Less than $100
- 523$200 to $249
- 333$250 to $299
- 262$300 to $349
- 142$350 to $399
- 218$400 to $449
- 176$450 to $499
- 255$500 to $549
- 137$550 to $599
- 153$600 to $649
- 35$650 to $699
- 84$700 to $749
- 80$750 to $799
- 445$800 to $899
- 552$900 to $999
- 1,082$1,000 to $1,249
- 1,812$1,250 to $1,499
- 1,744$1,500 to $1,999
- 442$2,000 to $2,499
- 24$2,500 to $2,999
- 19$3,000 to $3,499
- 354No cash rent
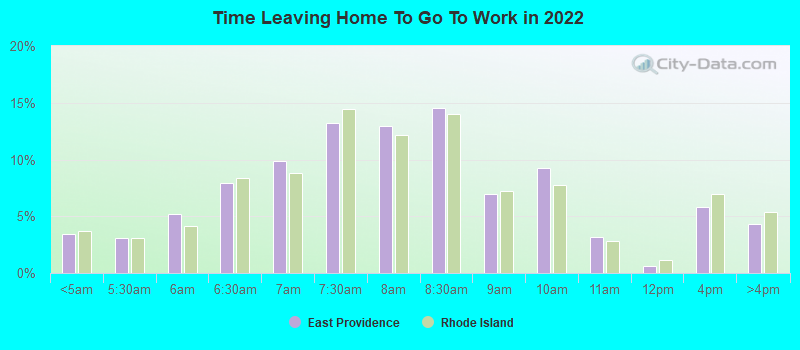
Percentage of workers working in this county: 67.0%
Number of people working at home: 3,074 (12.7% of all workers)
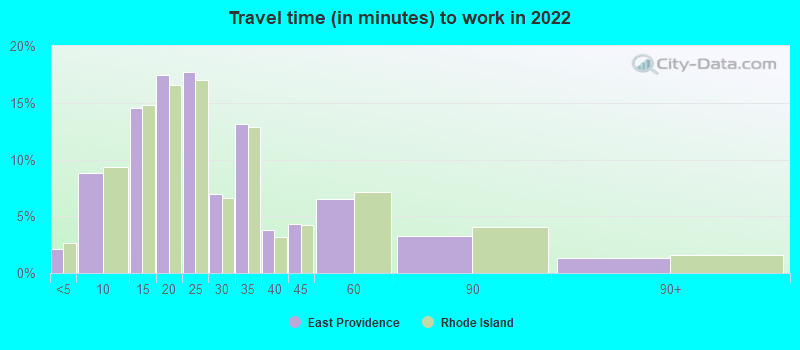
Travel time to work (commute)
- Less than 5 minutes: 577
- 5 to 9 minutes: 2,051
- 10 to 14 minutes: 4,185
- 15 to 19 minutes: 3,203
- 20 to 24 minutes: 3,582
- 25 to 29 minutes: 1,167
- 30 to 34 minutes: 2,626
- 35 to 39 minutes: 785
- 40 to 44 minutes: 742
- 45 to 59 minutes: 1,045
- 60 to 89 minutes: 700
- 90 or more minutes: 441
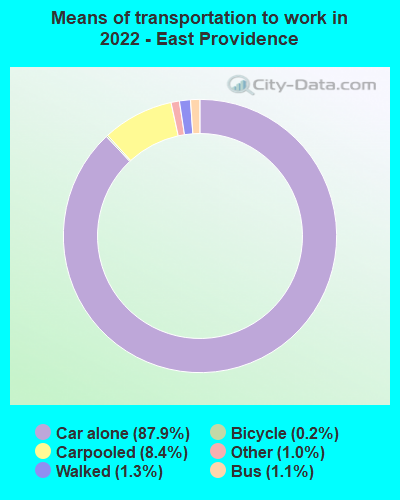
Means of transportation to work:
- Drove a car alone: 19,372 (75.5%)
- Carpooled: 2,044 (8.0%)
- Bus: 199 (0.8%)
- Long-distance train or commuter rail: 6 (0.0%)
- Taxi: 348 (1.4%)
- Bicycle: 82 (0.3%)
- Walked: 332 (1.3%)
- Worked at home: 3,074 (12.0%)
- Unemployment by race in 2022
- Unemployment rate for White non-Hispanic residents
- 5.3%Males
- 1.5%Females
- Unemployment rate for Black residents
- 15.2%Males
- 11.6%Females
- Unemployment rate for other race residents
- 11.0%Males
- 1.8%Females
- Unemployment rate for two or more race residents
- 2.2%Males
- Unemployment rate for Hispanic or Latino residents
- 10.9%Males
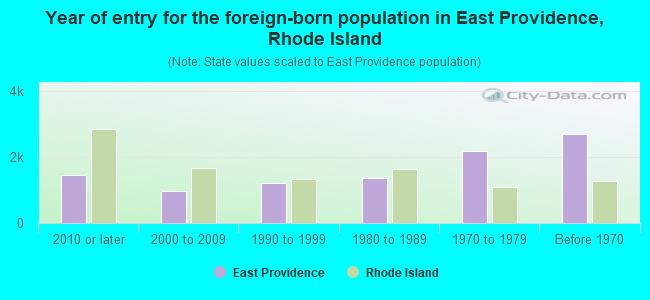
- Year of entry for the foreign-born population in East Providence, Rhode Island
- 1,4532010 or later
- 9752000 to 2009
- 1,2021990 to 1999
- 1,3651980 to 1989
- 2,1811970 to 1979
- 2,695Before 1970
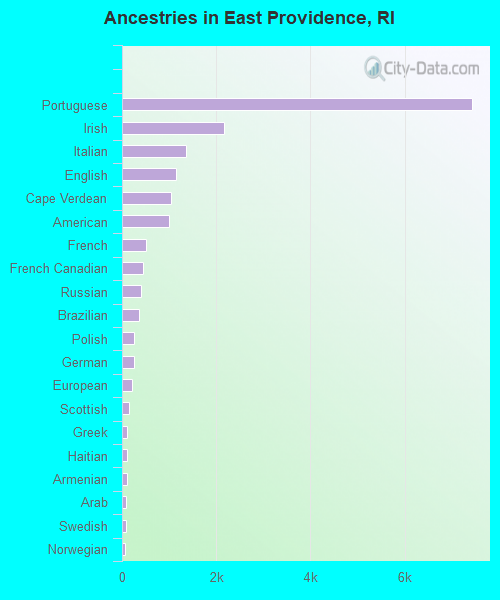
First ancestries reported:
- Portuguese: 7,422 (31.6%)
- Irish: 2,161 (9.2%)
- Italian: 1,363 (5.8%)
- English: 1,145 (4.9%)
- Cape Verdean: 1,041 (4.4%)
- American: 998 (4.2%)
- French: 501 (2.1%)
- French Canadian: 441 (1.9%)
- Russian: 396 (1.7%)
- Brazilian: 352 (1.5%)
- Polish: 258 (1.1%)
- German: 246 (1.0%)
- European: 220 (0.9%)
- Scottish: 141 (0.6%)
- Greek: 113 (0.5%)
- Haitian: 104 (0.4%)
- Armenian: 99 (0.4%)
- Arab: 91 (0.4%)
- Swedish: 90 (0.4%)
- Norwegian: 73 (0.3%)
- Syrian: 52 (0.2%)
- Jamaican: 48 (0.2%)
- Lebanese: 41 (0.2%)
- Hungarian: 35 (0.1%)
- Scotch-Irish: 33 (0.1%)
- Dutch: 31 (0.1%)
- Barbadian: 30 (0.1%)
- Nigerian: 25 (0.1%)
- Canadian: 23 (0.10%)
- British: 20 (0.09%)
- Danish: 18 (0.08%)
- German Russian: 17 (0.07%)
- Iranian: 17 (0.07%)
- West Indian: 12 (0.05%)
- Liberian: 11 (0.05%)
- Welsh: 10 (0.04%)
- British West Indian: 8 (0.03%)
- Eastern European: 7 (0.03%)
- Northern European: 7 (0.03%)
- Swiss: 7 (0.03%)
- Lithuanian: 6 (0.03%)
- African: 6 (0.03%)
Most common places of birth for foreign-born residents (%):
| East Providence: | 49.9% (3,598) |
| Rhode Island: | 10.0% (15,766) |
| East Providence: | 13.5% (973) |
| Rhode Island: | 2.4% (3,822) |
| East Providence: | 5.8% (417) |
| Rhode Island: | 1.8% (2,826) |
| East Providence: | 5.2% (375) |
| Rhode Island: | 21.0% (33,163) |
| East Providence: | 4.6% (331) |
| Rhode Island: | 4.1% (6,461) |
| East Providence: | 4.5% (321) |
| Rhode Island: | 5.1% (8,042) |
| East Providence: | 3.8% (277) |
| Rhode Island: | 0.7% (1,165) |
| East Providence: | 2.7% (194) |
| Rhode Island: | 3.0% (4,789) |
| East Providence: | 2.0% (146) |
| Rhode Island: | 4.1% (6,520) |
| East Providence: | 1.9% (139) |
| Rhode Island: | 0.4% (556) |
| East Providence: | 1.7% (122) |
| Rhode Island: | 1.7% (2,625) |
| East Providence: | 1.5% (110) |
| Rhode Island: | 2.4% (3,836) |
Place of birth for U.S.-born residents:
- This state: 24,932
- Other state: 13,631
- Northeast: 9,743
- Midwest: 912
- South: 1,451
- West: 1,533
86.8% of East Providence residents lived in the same house 1 years ago.
Out of people who lived in different houses, 35.3% lived in this county.
Out of people who lived in different counties, 36.3% lived in Rhode Island.
| East Providence: | 86.8% |
| State average: | 89.3% |
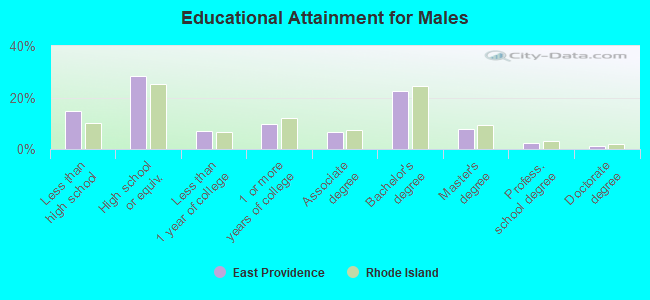
Education attainment for males 25 years and older:
- No schooling: 822
- Nursery to 4th grade: 148
- 5th and 6th grade: 62
- 7th and 8th grade: 195
- 9th grade: 413
- 10th grade: 117
- 11th grade: 282
- 12th grade, no diploma: 574
- High school graduate (or equivalency): 5,016
- Less than 1 year of college: 1,245
- Some college more than 1 year, no degree: 1,732
- Associate degree: 1,183
- Bachelor's degree: 4,007
- Master's degree: 1,363
- Professional school degree: 380
- Doctorate degree: 222
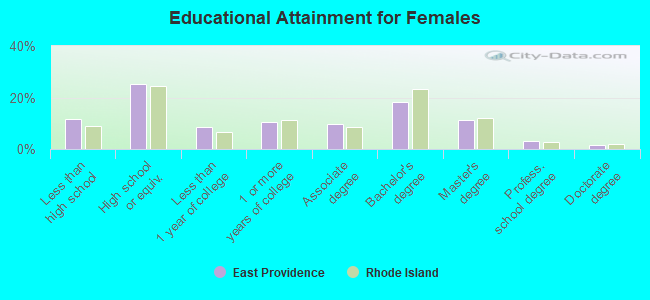
Education attainment for females 25 years and older:
- No schooling: 743
- Nursery to 4th grade: 268
- 5th and 6th grade: 33
- 7th and 8th grade: 164
- 9th grade: 140
- 10th grade: 206
- 11th grade: 128
- 12th grade, no diploma: 470
- High school graduate (or equivalency): 4,653
- Less than 1 year of college: 1,609
- Some college more than 1 year, no degree: 1,958
- Associate degree: 1,815
- Bachelor's degree: 3,402
- Master's degree: 2,088
- Professional school degree: 605
- Doctorate degree: 288
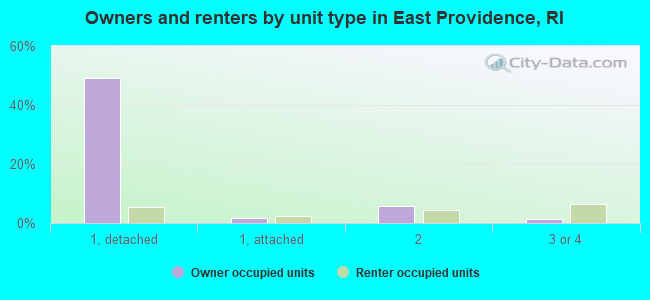
Housing units in structures:
- One, detached: 11,593
- One, attached: 735
- Two: 2,636
- 3 or 4: 1,926
- 5 to 9: 683
- 10 to 19: 1,051
- 20 to 49: 999
- 50 or more: 2,100
- Mobile homes: 100
Median worth of mobile homes: $63,083
Housing units lacking complete kitchen facilities in 2022: 2.3%
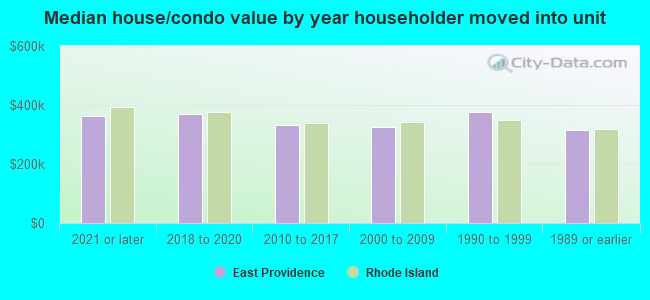
House/condo owner moved in on average 14 years ago
Renter moved in on average 5 years ago
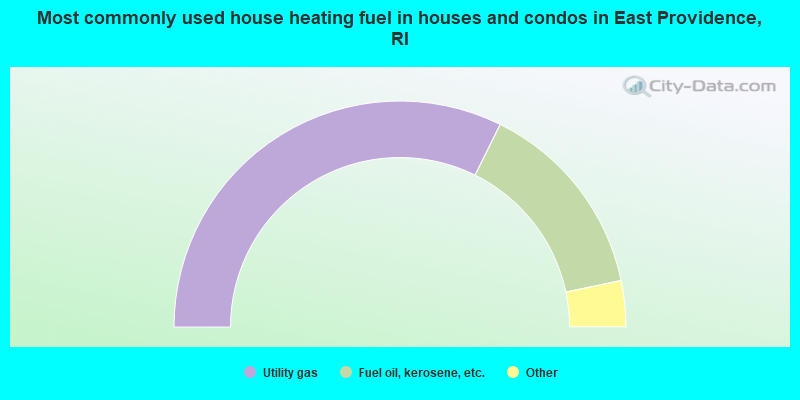
- 64.7%Utility gas
- 28.8%Fuel oil, kerosene, etc.
- 3.0%Bottled, tank, or LP gas
- 2.4%Electricity
- 0.9%Wood
- 0.2%Solar energy
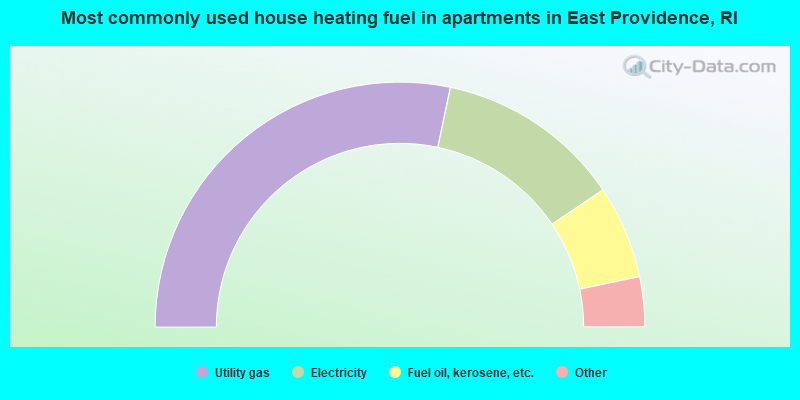
- 56.6%Utility gas
- 24.5%Electricity
- 12.3%Fuel oil, kerosene, etc.
- 2.8%No fuel used
- 2.7%Bottled, tank, or LP gas
- 0.8%Other fuel
- 0.3%Coal or coke
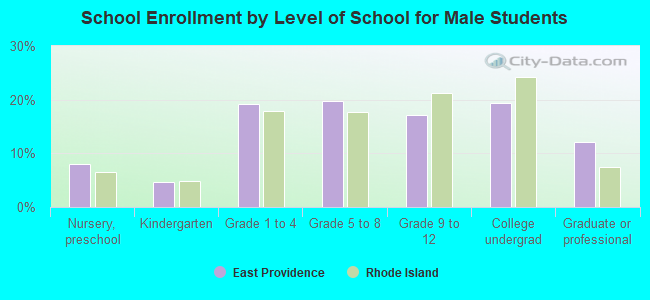
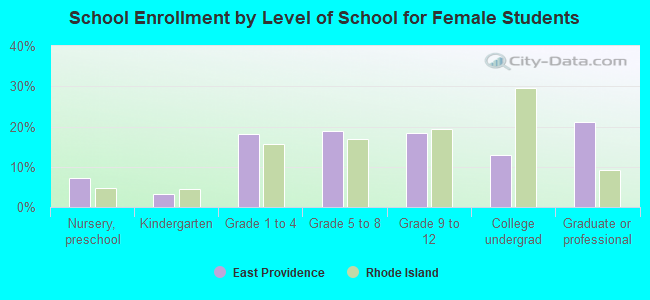
Private vs. public school enrollment:
| Here: | 12.9% |
| Rhode Island: | 12.2% |
| Here: | 14.9% |
| Rhode Island: | 11.6% |
| Here: | 30.7% |
| Rhode Island: | 41.1% |