Housing density: 166 houses/condos per square mile
Median price asked for vacant for-sale houses and condos in 2022 in this county: $360,195.
Median contract rent in 2022: $1,262 (lower quartile is $967, upper quartile is $1,529)
Median rent asked for vacant for-rent units in 2022: $1,215
Median gross rent in East Windsor, CT in 2022: $1,403
Housing units in East Windsor with a mortgage: 1,370 (113 second mortgage, 157 home equity loan, 7 both second mortgage and home equity loan) Houses without a mortgage: 697
Compare current foreclosures near East Windsor, CT:
In family households: 715,089 (143,179 male householders, 84,652 female householders)
161,327 spouses, 258,438 children (243,975 natural, 5,783 adopted, 8,680 stepchildren), 15,602 grandchildren, 8,779 brothers or sisters, 9,385 parents, foster children, 10,085 other relatives, 18,701 non-relatives
In nonfamily households: 150,698 (54,155 male householders (41,831 living alone)), 68,868 female householders (58,693 living alone)), 27,675 nonrelatives
In group quarters: 28,227 (15,383 institutionalized population)
135,700 married couples with children.
56,984 single-parent households (8,611 men, 48,373 women).
91.7% of residents of East Windsor speak English at home.
1.9% of residents speak Spanish at home (52% speak English very well, 17% speak English well, 28% speak English not well, 3% don't speak English at all).
5.4% of residents speak other Indo-European language at home (71% speak English very well, 23% speak English well, 6% speak English not well).
0.4% of residents speak Asian or Pacific Island language at home (35% speak English very well, 50% speak English well, 15% speak English not well).
0.7% of residents speak other language at home (77% speak English very well, 23% speak English not well).
Foreign born population: 630 (5.7%)
(65.9% of them are naturalized citizens)
Year of entry for the foreign-born population in East Windsor, Connecticut
811995 to March 2000
481990 to 1994
461985 to 1989
221980 to 1984
91975 to 1979
311970 to 1974
231965 to 1969
136Before 1965
First ancestries reported:
Irish: 1,682 (14.0%)
French: 1,500 (12.4%)
English: 1,284 (10.7%)
Italian: 1,271 (10.5%)
Other: 1,153 (9.6%)
German: 1,043 (8.7%)
Polish: 954 (7.9%)
French Canadian: 813 (6.7%)
United States: 453 (3.8%)
Scottish: 341 (2.8%)
Lithuanian: 282 (2.3%)
Scotch-Irish: 188 (1.6%)
Swedish: 187 (1.6%)
Greek: 133 (1.1%)
Czech: 116 (1.0%)
Ukrainian: 90 (0.7%)
Subsaharan African: 88 (0.7%)
Dutch: 74 (0.6%)
Norwegian: 73 (0.6%)
Portuguese: 62 (0.5%)
Hungarian: 59 (0.5%)
West Indian: 59 (0.5%)
Russian: 53 (0.4%)
Danish: 51 (0.4%)
Slovak: 23 (0.2%)
Welsh: 10 (0.08%)
Swiss: 7 (0.06%)
Most common places of birth for foreign-born residents (%):
Canada
East Windsor:
17.9% (71)
Connecticut:
5.2% (19,083)
United Kingdom
East Windsor:
8.8% (35)
Connecticut:
4.4% (16,395)
India
East Windsor:
7.1% (28)
Connecticut:
4.1% (15,108)
Pakistan
East Windsor:
6.8% (27)
Connecticut:
0.9% (3,317)
Philippines
East Windsor:
6.8% (27)
Connecticut:
1.7% (6,247)
Greece
East Windsor:
6.6% (26)
Connecticut:
1.2% (4,622)
Italy
East Windsor:
5.6% (22)
Connecticut:
7.0% (26,023)
Poland
East Windsor:
5.3% (21)
Connecticut:
6.9% (25,507)
Mexico
East Windsor:
5.1% (20)
Connecticut:
3.6% (13,282)
Laos
East Windsor:
4.5% (18)
Connecticut:
0.7% (2,692)
Ghana
East Windsor:
4.3% (17)
Connecticut:
0.3% (1,058)
China, excluding Hong Kong and Taiwan
East Windsor:
3.5% (14)
Connecticut:
2.5% (9,358)
Other Caribbean
East Windsor:
3.0% (12)
Connecticut:
0.7% (2,569)
Trinidad and Tobago
East Windsor:
2.8% (11)
Connecticut:
0.5% (2,025)
Jamaica
East Windsor:
2.3% (9)
Connecticut:
7.2% (26,819)
Germany
East Windsor:
2.0% (8)
Connecticut:
3.1% (11,432)
Austria
East Windsor:
1.5% (6)
Connecticut:
0.3% (1,224)
Russia
East Windsor:
1.5% (6)
Connecticut:
1.4% (5,021)
Place of birth for U.S.-born residents:
This state: 6,305
Other state: 2,977
Northeast: 2,246
Midwest: 232
South: 360
West: 139
56% of East Windsor residents lived in the same house 5 years ago. Out of people who lived in different houses, 65% lived in this county. Out of people who lived in different counties, 43% lived in Connecticut.
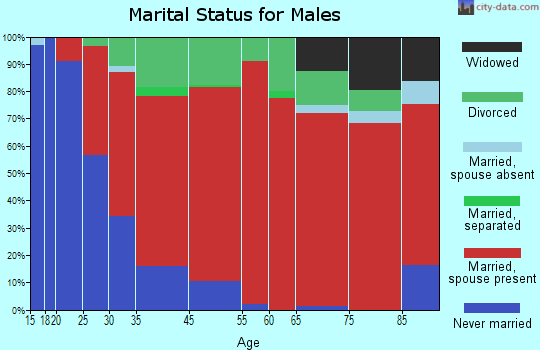
Education attainment for males 25 years and older:
No schooling: 13
Nursery to 4th grade: 5
5th and 6th grade: 22
7th and 8th grade: 101
9th grade: 89
10th grade: 119
11th grade: 95
12th grade, no diploma: 166
High school graduate (or equivalency): 1,300
Less than 1 year of college: 149
Some college more than 1 year, no degree: 389
Associate degree: 188
Bachelor's degree: 469
Master's degree: 144
Professional school degree: 68
Doctorate degree: 14
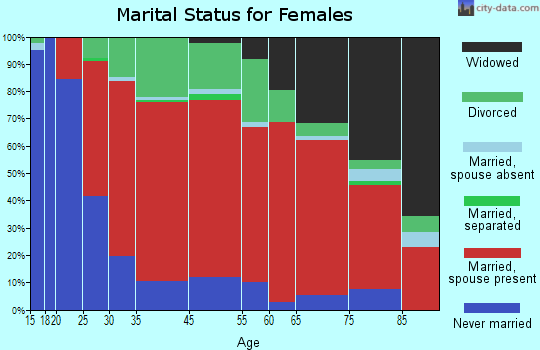
Education attainment for females 25 years and older:
No schooling: 5
Nursery to 4th grade: 0
5th and 6th grade: 5
7th and 8th grade: 127
9th grade: 64
10th grade: 133
11th grade: 75
12th grade, no diploma: 216
High school graduate (or equivalency): 1,397
Less than 1 year of college: 214
Some college more than 1 year, no degree: 419
Associate degree: 292
Bachelor's degree: 487
Master's degree: 184
Professional school degree: 40
Doctorate degree: 11
Housing units in structures:
One, detached: 2,170
One, attached: 375
Two: 310
3 or 4: 320
5 to 9: 402
10 to 19: 352
20 to 49: 148
50 or more: 86
Mobile homes: 193
Median worth of mobile homes: $50,572
Housing units lacking complete plumbing facilities: 0.8%
Housing units lacking complete kitchen facilities: 0.7%