Ellerbe, NC (North Carolina) Houses and Residents
| Ellerbe: | $102,134 |
| North Carolina: | $280,600 |
Mean price in 2022:
Detached houses: $152,239
Here: $152,239 State: $375,326 Mobile homes: $81,862
Here: $81,862 State: $124,933
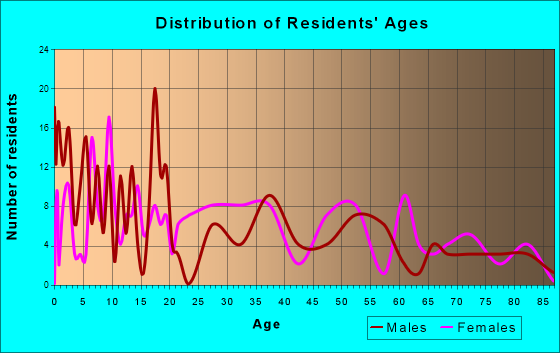
Total population: 1,012 (Urban population: 0, Rural population: 1,016 (all nonfarm))
Houses: 549 (493 occupied: 301 owner occupied, 198 renter occupied)
| % of renters here: | 40% |
| State: | 33% |
Housing density: 375 houses/condos per square mile
Median price asked for vacant for-sale houses and condos in 2022 in this county: $224,949.
Median contract rent in 2022: $435 (lower quartile is $363, upper quartile is $674)
Median rent asked for vacant for-rent units in 2022: $540
Median gross rent in Ellerbe, NC in 2022: $748
Housing units in Ellerbe with a mortgage: 100 (0 second mortgage, 0 home equity loan, 0 both second mortgage and home equity loan)
Houses without a mortgage: 0
Median household income for houses/condos with a mortgage: $72,375
Median household income for apartments without a mortgage: $47,191
Median monthly housing costs: $545
Compare current foreclosures near Ellerbe, NC:
| Photo | Address | Area | Beds / Baths | Price | Details |
|---|---|---|---|---|---|

|
#1
N Us Highway 220
Ellerbe, NC 28338
|
2,196 sq. feet
|
3 baths 4 beds |
show details | |

|
#2
Concord Church Rd
Ellerbe, NC 28338
|
1,792 sq. feet
|
2 baths - beds |
show details | |

|
#3
Wiregrass Rd
Rockingham, NC 28379
|
1,188 sq. feet
|
1 baths 3 beds |
show details | |

|
#4
Austin St
Hamlet, NC 28345
|
1,813 sq. feet
|
3 baths 3 beds |
show details | |

|
#5
Mcdonald Ave
Hamlet, NC 28345
|
1,412 sq. feet
|
2 baths 3 beds |
show details | |

|
#6
Patton St
Hamlet, NC 28345
|
- sq. feet
|
2 baths 2 beds |
show details | |

|
#7
Burning Tree Rd
Pinehurst, NC 28374
|
1,962 sq. feet
|
3 baths 4 beds |
show details | |

|
#8
W New England Ave
Pinebluff, NC 28373
|
1,528 sq. feet
|
2 baths 3 beds |
show details | |

|
#9
W Denny Ave
Pinebluff, NC 28373
|
1,777 sq. feet
|
2 baths 4 beds |
show details | |

|
#10
5th St
Lilesville, NC 28091
|
1,176 sq. feet
|
1 baths 3 beds |
show details |
| Photo | Address | Area | Beds / Baths | Price | Details |
|---|---|---|---|---|---|

|
#11
Dr.
Hamlet, NC 28345
|
- sq. feet
|
- baths - beds |
$399,000
|
show details |

|
#12
Wedgewood Dr
Jackson Springs, NC 27281
|
2,005 sq. feet
|
4 baths 3 beds |
show details | |

|
#13
Hoffman Rd
Jackson Springs, NC 27281
|
1,554 sq. feet
|
2 baths 3 beds |
show details | |

|
#14
Clark Mountain Rd
Lilesville, NC 28091
|
1,368 sq. feet
|
1 baths 2 beds |
show details | |

|
#15
Wedgewood Dr
Jackson Springs, NC 27281
|
2,005 sq. feet
|
4 baths 3 beds |
show details | |

|
#16
Mcrae Ave
Wadesboro, NC 28170
|
1,400 sq. feet
|
1 baths 3 beds |
show details | |

|
#17
Dale Peterkin St
Hamlet, NC 28345
|
660 sq. feet
|
1 baths - beds |
show details | |

|
#18
N Us 1 Hwy
Hoffman, NC 28347
|
1,620 sq. feet
|
2 baths - beds |
show details | |

|
#19
Roberdell Rd
Rockingham, NC 28379
|
2,059 sq. feet
|
2 baths - beds |
show details | |

|
#20
Judith Ann Dr
Rockingham, NC 28379
|
1,836 sq. feet
|
2 baths - beds |
show details |
| Photo | Address | Area | Beds / Baths | Price | Details |
|---|---|---|---|---|---|

|
#21
N Us 1 Hwy
Hoffman, NC 28347
|
946 sq. feet
|
1 baths - beds |
show details | |

|
#22
Williams St
Hamlet, NC 28345
|
728 sq. feet
|
1 baths - beds |
show details | |

|
#23
Green Lake Rd
Rockingham, NC 28379
|
1,340 sq. feet
|
1 baths - beds |
show details | |

|
#24
Dogwood Ln
Hamlet, NC 28345
|
1,514 sq. feet
|
2 baths - beds |
show details | |

|
#25
Ledbetter Rd
Rockingham, NC 28379
|
1,568 sq. feet
|
2 baths - beds |
show details | |

|
#26
Silver Leaf Dr
Rockingham, NC 28379
|
1,008 sq. feet
|
- baths - beds |
show details | |

|
#27
5th Street Ext
Hamlet, NC 28345
|
- sq. feet
|
- baths - beds |
show details | |

|
#28
Outside Ln
Rockingham, NC 28379
|
- sq. feet
|
- baths - beds |
show details | |

|
#29
Of Cowan St
Lilesville, NC 28091
|
- sq. feet
|
- baths - beds |
show details | |

|
#30
R R St
Lilesville, NC 28091
|
- sq. feet
|
- baths - beds |
show details |
| Photo | Address | Area | Beds / Baths | Price | Details |
|---|---|---|---|---|---|

|
#31
Pee Dee Dr E Of Sr 1840
Lilesville, NC 28091
|
- sq. feet
|
- baths - beds |
show details | |

|
#32
Nc 381 Hwy # 177
Hamlet, NC 28345
|
- sq. feet
|
- baths - beds |
show details | |

|
#33
Windy Ln
Candor, NC 27229
|
1,976 sq. feet
|
- baths - beds |
show details | |

|
#34
W Philadelphia Ave
Pinebluff, NC 28373
|
- sq. feet
|
- baths - beds |
show details | |

|
#35
Capel Mill Rd
Candor, NC 27229
|
- sq. feet
|
- baths - beds |
show details | |

|
#36
Chavis Plantation Rd
Hamlet, NC 28345
|
- sq. feet
|
- baths - beds |
show details | |

|
#37
Dennis Rd
Wadesboro, NC 28170
|
- sq. feet
|
- baths - beds |
show details | |

|
#38
7 Lks S
West End, NC 27376
|
- sq. feet
|
- baths - beds |
show details | |

|
#39
7 Lks S
West End, NC 27376
|
- sq. feet
|
- baths - beds |
show details | |

|
#40
7 Lks N
West End, NC 27376
|
- sq. feet
|
- baths - beds |
show details |
| Photo | Address | Area | Beds / Baths | Price | Details |
|---|---|---|---|---|---|

|
#41
Bennett Rd
Wadesboro, NC 28170
|
- sq. feet
|
- baths - beds |
show details | |

|
#42
Bennett Rd
Wadesboro, NC 28170
|
- sq. feet
|
- baths - beds |
show details | |

|
#43
Myrtle Ave
Hamlet, NC 28345
|
- sq. feet
|
- baths - beds |
show details | |

|
#44
County Home Rd
Rockingham, NC 28379
|
- sq. feet
|
- baths - beds |
show details | |

|
#45
Pekin Rd
Candor, NC 27229
|
1,064 sq. feet
|
- baths - beds |
show details | |

|
#46
Deweese Ave
Rockingham, NC 28379
|
- sq. feet
|
- baths - beds |
show details | |

|
#47
Windblow Rd
Jackson Springs, NC 27281
|
- sq. feet
|
- baths - beds |
show details | |

|
#48
Loblolly Ct
Rockingham, NC 28379
|
- sq. feet
|
- baths - beds |
show details | |

|
#49
W Eason Dr
Rockingham, NC 28379
|
- sq. feet
|
- baths - beds |
show details | |

|
Check over 1 million property listings on Foreclosure.com!
|
browse all offers | |||

Latest news about housing in Ellerbe, NC collected exclusively by city-data.com from local newspapers, TV, and radio stations

 | Urban with kids? Is this possible? (60 replies) |
| Is there laws for rentals in NC (2 replies) |
| Durham neighborhood question: NCCU area (9 replies) |
| United way? (127 replies) |
| Richmond County (0 replies) |
Median year apartment built: 1967
Household type by relationship:
Households: 1,181- Male householders: 191 (72 living alone), Female householders: 297 (80 living alone)
137 spouses (137 opposite-sex spouses), 33 unmarried partners, (33 opposite-sex unmarried partners), 387 children (355 natural, 0 adopted, 31 stepchildren), 97 grandchildren, 0 brothers or sisters, 0 parents, 0 foster children, 4 other relatives, 24 non-relatives
- In group quarters: 8
Size of family households: 129 2-persons, 57 3-persons, 61 4-persons, 50 5-persons, 25 6-persons.
Size of nonfamily households: 155 1-person, 9 2-persons, 7 3-persons.
102 married couples with children.
104 single-parent households (9 men, 95 women).
91.3% of residents of Ellerbe speak English at home.
7.7% of residents speak Spanish at home (22% speak English very well, 38% speak English well, 40% speak English not well).
Foreign born population: 49 (4.1%)
(0.0% of them are naturalized citizens)
| Here: | 5.7 |
| State: | 6.4 |
| Here: | 4.9 |
| State: | 4.4 |

- Bedrooms in owner-occupied houses and condos in Ellerbe, North Carolina
- 0no bedroom
- 01 bedroom
- 652 bedrooms
- 1723 bedrooms
- 484 bedrooms
- 175+ bedrooms

- Bedrooms in renter-occupied apartments in Ellerbe, North Carolina
- 36no bedroom
- 211 bedroom
- 292 bedrooms
- 1133 bedrooms
- 04 bedrooms
- 05+ bedrooms

- Cars and other vehicles available in Ellerbe in owner-occupied houses/condos
- 0no vehicle
- 621 vehicle
- 1582 vehicles
- 713 vehicles
- 104 vehicles
- 05+ vehicles

- Cars and other vehicles available in Ellerbe in renter-occupied apartments
- 47no vehicle
- 491 vehicle
- 972 vehicles
- 53 vehicles
- 04 vehicles
- 05+ vehicles

- Rooms in owner-occupied houses in Ellerbe, North Carolina
- 01 room
- 02 rooms
- 03 rooms
- 414 rooms
- 995 rooms
- 466 rooms
- 707 rooms
- 148 rooms
- 319+ rooms

- Rooms in renter-occupied apartments in Ellerbe, North Carolina
- 361 room
- 02 rooms
- 03 rooms
- 354 rooms
- 845 rooms
- 416 rooms
- 47 rooms
- 08 rooms
- 09+ rooms


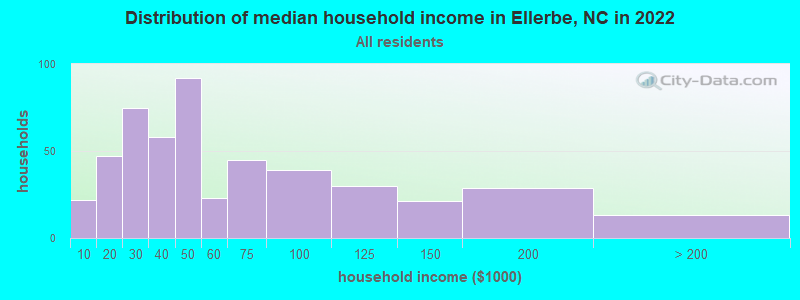
Ellerbe, NC household income distribution

- 22Less than $10,000
- 47$10,000 to $19,999
- 75$20,000 to $29,999
- 58$30,000 to $39,999
- 92$40,000 to $49,999
- 23$50,000 to $59,999
- 45$60,000 to $74,999
- 39$75,000 to $99,999
- 30$100,000 to $124,999
- 21$125,000 to $149,999
- 29$150,000 to $199,999
- 13$200,000 or more
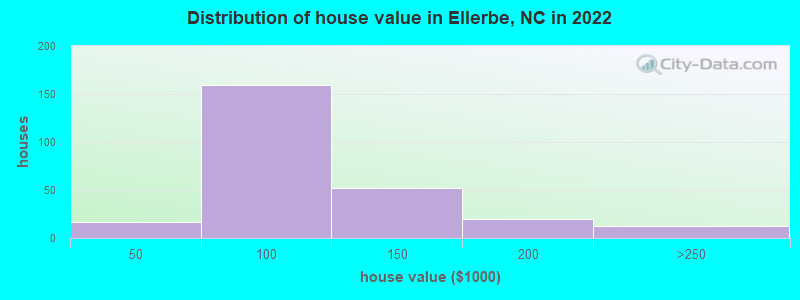
Home value of owner - occupied houses in 2022 in Ellerbe, NC
-
- 2Less than $10,000
- 14$40,000 to $49,999
- 28$50,000 to $59,999
- 55$60,000 to $69,999
- 16$70,000 to $79,999
- 28$80,000 to $89,999
- 15$90,000 to $99,999
- 35$100,000 to $124,999
- 16$125,000 to $149,999
- 16$150,000 to $174,999
- 3$175,000 to $199,999
- 13$200,000 to $249,999
Rent paid by renters in 2022 in Ellerbe, NC
-
- 7$150 to $199
- 30$300 to $349
- 32$350 to $399
- 20$400 to $449
- 1$550 to $599
- 56$600 to $649
- 5$1,000 to $1,249
- 41No cash rent


Percentage of workers working in this county: 55.8%
Number of people working at home: 0 (0.0% of all workers)
Travel time to work (commute)
- Less than 5 minutes: 0
- 5 to 9 minutes: 35
- 10 to 14 minutes: 25
- 15 to 19 minutes: 60
- 20 to 24 minutes: 71
- 25 to 29 minutes: 89
- 30 to 34 minutes: 33
- 35 to 39 minutes: 31
- 40 to 44 minutes: 20
- 45 to 59 minutes: 78
- 60 to 89 minutes: 4
- 90 or more minutes: 20
Means of transportation to work:
- Drove a car alone: 218 (64.7%)
- Carpooled: 99 (29.4%)
- Bus or trolley bus: 2 (0.6%)
- Taxi: 1 (0.3%)
- Bicycle: 4 (1.2%)
- Walked: 7 (2.1%)
- Other means: 2 (0.6%)
- Worked at home: 4 (1.2%)

- Unemployment by race in 2022
- Unemployment rate for White non-Hispanic residents
- 3.4%Males
- Unemployment rate for Black residents
- 43.9%Males
- 21.4%Females
- Unemployment rate for other race residents
- 28.8%Males
- Unemployment rate for Hispanic or Latino residents
- 28.7%Males

- Year of entry for the foreign-born population in Ellerbe, North Carolina
- 02010 or later
- 172000 to 2009
- 91990 to 1999
- 221980 to 1989
- 101970 to 1979
- 3Before 1970

First ancestries reported:
- American: 52 (6.6%)
- English: 17 (2.2%)
- Irish: 14 (1.8%)
- African: 3 (0.4%)
Most common places of birth for foreign-born residents (%):
| Ellerbe: | 75.5% (37) |
| North Carolina: | 24.7% (214,776) |
| Ellerbe: | 12.2% (6) |
| North Carolina: | 0.7% (6,091) |
Place of birth for U.S.-born residents:
- This state: 904
- Other state: 187
- Northeast: 85
- Midwest: 16
- South: 65
- West: 19
85.2% of Ellerbe residents lived in the same house 1 years ago.
Out of people who lived in different houses, 26.6% lived in this county.
Out of people who lived in different counties, 23.0% lived in North Carolina.
| Ellerbe: | 85.2% |
| State average: | 87.3% |
Education attainment for males 25 years and older:
- No schooling: 0
- Nursery to 4th grade: 0
- 5th and 6th grade: 17
- 7th and 8th grade: 17
- 9th grade: 10
- 10th grade: 47
- 11th grade: 0
- 12th grade, no diploma: 2
- High school graduate (or equivalency): 77
- Less than 1 year of college: 9
- Some college more than 1 year, no degree: 33
- Associate degree: 41
- Bachelor's degree: 27
- Master's degree: 22
- Professional school degree: 0
- Doctorate degree: 4

Education attainment for females 25 years and older:
- No schooling: 0
- Nursery to 4th grade: 15
- 5th and 6th grade: 7
- 7th and 8th grade: 0
- 9th grade: 32
- 10th grade: 1
- 11th grade: 0
- 12th grade, no diploma: 4
- High school graduate (or equivalency): 50
- Less than 1 year of college: 56
- Some college more than 1 year, no degree: 75
- Associate degree: 102
- Bachelor's degree: 49
- Master's degree: 17
- Professional school degree: 0
- Doctorate degree: 0

Housing units in structures:
- One, detached: 413
- Two: 19
- 3 or 4: 9
- 5 to 9: 17
- Mobile homes: 88
Housing units lacking complete kitchen facilities in 2022: 7.7%
House/condo owner moved in on average 7 years ago
Renter moved in on average 2 years ago

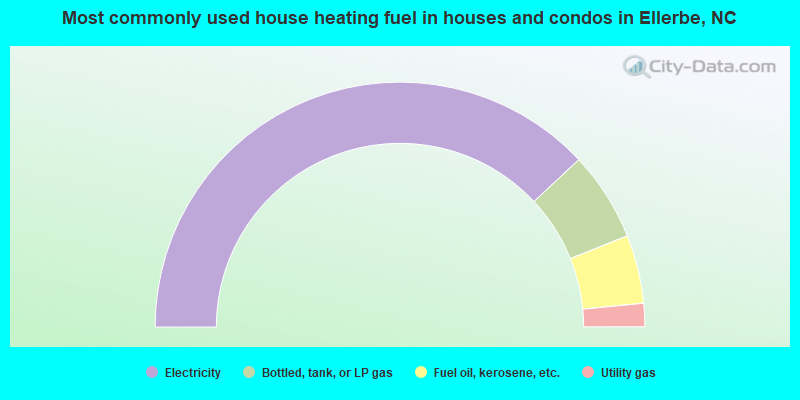
- 76.0%Electricity
- 11.8%Bottled, tank, or LP gas
- 9.0%Fuel oil, kerosene, etc.
- 3.1%Utility gas
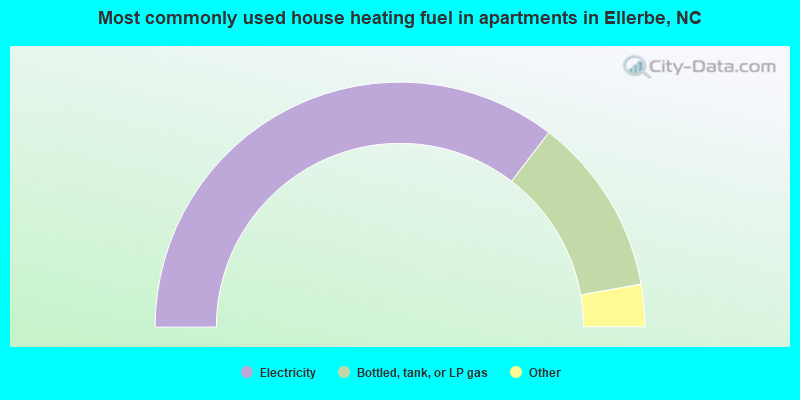
- 71.1%Electricity
- 23.7%Bottled, tank, or LP gas
- 3.7%Fuel oil, kerosene, etc.
- 1.6%No fuel used
Private vs. public school enrollment:
| Here: | 14.9% |
| North Carolina: | 13.8% |
| Here: | 0.0% |
| North Carolina: | 11.9% |
| Here: | 0.0% |
| North Carolina: | 19.3% |


