Elmwood Park, IL (Illinois) Houses and Residents
| Elmwood Park: | $319,667 |
| Illinois: | $251,600 |
Mean price in 2022:
Detached houses: $352,748
Here: $352,748 State: $310,164 Townhouses or other attached units: $298,871
Here: $298,871 State: $286,230 In 2-unit structures: $351,618
Here: $351,618 State: $299,638 In 3-to-4-unit structures: $366,188
Here: $366,188 State: $330,907 In 5-or-more-unit structures: $191,305
Here: $191,305 State: $318,887
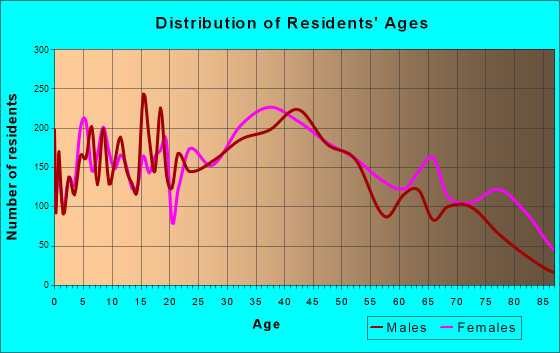
Total population: 24,954 (All urban)
Houses: 10,080 (9,444 occupied: 5,919 owner occupied, 3,686 renter occupied)
| % of renters here: | 38% |
| State: | 33% |
Housing density: 5,288 houses/condos per square mile
Median price asked for vacant for-sale houses and condos in 2022: $149,850.
Median contract rent in 2022: $1,165 (lower quartile is $966, upper quartile is $1,375)
Median rent asked for vacant for-rent units in 2022: $1,128
Median gross rent in Elmwood Park, IL in 2022: $1,263
Housing units in Elmwood Park with a mortgage: 3,803 (469 second mortgage, 12 home equity loan, 430 both second mortgage and home equity loan)
Houses without a mortgage: 74
Median household income for houses/condos with a mortgage: $106,329
Median household income for apartments without a mortgage: $65,183
Median monthly housing costs: $1,399
Compare current foreclosures in Elmwood Park, IL:
| Photo | Address | Area | Beds / Baths | Price | Details |
|---|---|---|---|---|---|

|
#1
N 74th Ave
Elmwood Park, IL 60707
|
1,300 sq. feet
|
1 baths 3 beds |
$235,000
|
show details |

|
#2
N Natoma Ave
Elmwood Park, IL 60707
|
1,730 sq. feet
|
1 baths 3 beds |
show details | |

|
#3
N Nashville Ave
Elmwood Park, IL 60707
|
934 sq. feet
|
1 baths 2 beds |
show details | |

|
#4
W Sunset Dr
Elmwood Park, IL 60707
|
1,398 sq. feet
|
1 baths 4 beds |
show details | |

|
#5
N Montclare Ave
Elmwood Park, IL 60707
|
1,049 sq. feet
|
1 baths 3 beds |
show details | |

|
#6
N 77th Ct
Elmwood Park, IL 60707
|
1,678 sq. feet
|
2 baths 4 beds |
show details | |

|
#7
N 77th Ct
Elmwood Park, IL 60707
|
1,164 sq. feet
|
1 baths 3 beds |
show details | |

|
#8
W Diversey Ave
Elmwood Park, IL 60707
|
- sq. feet
|
3 baths 6 beds |
show details | |

|
#9
N Newland Ave
Elmwood Park, IL 60707
|
1,008 sq. feet
|
1 baths - beds |
show details | |

|
#10
N 73rd Ct
Elmwood Park, IL 60707
|
1,488 sq. feet
|
2 baths - beds |
show details |
| Photo | Address | Area | Beds / Baths | Price | Details |
|---|---|---|---|---|---|

|
#11
N 77th Ave
Elmwood Park, IL 60707
|
1,110 sq. feet
|
1 baths - beds |
show details | |

|
#12
N Nagle Ave
Elmwood Park, IL 60707
|
1,461 sq. feet
|
1 baths - beds |
show details | |

|
#13
N Newcastle Ave
Elmwood Park, IL 60707
|
1,322 sq. feet
|
1 baths - beds |
show details | |

|
#14
N Newland Ave
Elmwood Park, IL 60707
|
594 sq. feet
|
1 baths - beds |
show details | |

|
#15
W Shakespeare Ave
Elmwood Park, IL 60707
|
1,232 sq. feet
|
1 baths - beds |
show details | |

|
#16
N Nashville Ave
Elmwood Park, IL 60707
|
1,634 sq. feet
|
2 baths - beds |
show details | |

|
#17
N Rutherford Ave
Elmwood Park, IL 60707
|
1,080 sq. feet
|
1 baths - beds |
show details | |

|
#18
W Altgeld St
Elmwood Park, IL 60707
|
1,271 sq. feet
|
1 baths - beds |
show details | |

|
#19
N Nagle Ave
Elmwood Park, IL 60707
|
1,020 sq. feet
|
1 baths - beds |
show details | |

|
#20
W Wellington Ave
Elmwood Park, IL 60707
|
1,768 sq. feet
|
1 baths - beds |
show details |
| Photo | Address | Area | Beds / Baths | Price | Details |
|---|---|---|---|---|---|

|
#21
N Natchez Ave
Elmwood Park, IL 60707
|
818 sq. feet
|
1 baths - beds |
show details | |

|
#22
N Rutherford Ave
Elmwood Park, IL 60707
|
2,122 sq. feet
|
1 baths - beds |
show details | |

|
#23
N Rutherford Ave
Elmwood Park, IL 60707
|
1,356 sq. feet
|
1 baths - beds |
show details | |

|
#24
N Newland Ave
Elmwood Park, IL 60707
|
1,888 sq. feet
|
1 baths - beds |
show details | |

|
#25
W Bloomingdale Ave
Elmwood Park, IL 60707
|
989 sq. feet
|
1 baths - beds |
show details | |

|
#26
N Natoma Ave
Elmwood Park, IL 60707
|
1,849 sq. feet
|
1 baths - beds |
show details | |

|
#27
N Nashville Ave
Elmwood Park, IL 60707
|
934 sq. feet
|
1 baths - beds |
show details | |

|
#28
N Sayre Ave # 2
Elmwood Park, IL 60707
|
2,816 sq. feet
|
2 baths - beds |
show details | |

|
#29
N Newcastle Ave # 1
Elmwood Park, IL 60707
|
1,680 sq. feet
|
2 baths - beds |
show details | |

|
#30
N Nashville Ave
Elmwood Park, IL 60707
|
1,165 sq. feet
|
2 baths - beds |
show details |
| Photo | Address | Area | Beds / Baths | Price | Details |
|---|---|---|---|---|---|

|
#31
N Oak Park Ave
Elmwood Park, IL 60707
|
1,505 sq. feet
|
2 baths - beds |
show details | |

|
#32
N Nagle Ave
Elmwood Park, IL 60707
|
2,247 sq. feet
|
2 baths - beds |
show details | |

|
#33
N Octavia Ave
Elmwood Park, IL 60707
|
1,152 sq. feet
|
1 baths - beds |
show details | |

|
#34
N Mont Clare Ave
Elmwood Park, IL 60707
|
1,020 sq. feet
|
2 baths - beds |
show details | |

|
#35
N Natchez Ave
Elmwood Park, IL 60707
|
1,561 sq. feet
|
1 baths - beds |
show details | |

|
#36
N Newcastle Ave
Elmwood Park, IL 60707
|
1,680 sq. feet
|
2 baths - beds |
show details | |

|
#37
W Sunset Dr
Elmwood Park, IL 60707
|
1,398 sq. feet
|
1 baths - beds |
show details | |

|
#38
N Nordica Ave
Elmwood Park, IL 60707
|
4,914 sq. feet
|
3 baths - beds |
show details | |

|
#39
N Odell Ave
Elmwood Park, IL 60707
|
2,241 sq. feet
|
2 baths - beds |
show details | |

|
#40
N Harlem Ave
Elmwood Park, IL 60707
|
1,793 sq. feet
|
2 baths - beds |
show details |
| Photo | Address | Area | Beds / Baths | Price | Details |
|---|---|---|---|---|---|

|
#41
N New England Ave
Elmwood Park, IL 60707
|
835 sq. feet
|
1 baths - beds |
show details | |

|
#42
N Octavia Ave
Elmwood Park, IL 60707
|
1,056 sq. feet
|
1 baths - beds |
show details | |

|
#43
N Oak Park Ave
Elmwood Park, IL 60707
|
1,489 sq. feet
|
1 baths - beds |
show details | |

|
#44
N Rutherford Ave
Elmwood Park, IL 60707
|
1,382 sq. feet
|
1 baths - beds |
show details | |

|
#45
N Oleander Ave
Elmwood Park, IL 60707
|
1,118 sq. feet
|
1 baths - beds |
show details | |

|
#46
N Nagle Ave # 1
Elmwood Park, IL 60707
|
6,066 sq. feet
|
6 baths - beds |
show details | |

|
#47
N West Brook Rd
Elmwood Park, IL 60707
|
816 sq. feet
|
1 baths - beds |
show details | |

|
#48
N Rutherford Ave
Elmwood Park, IL 60707
|
1,328 sq. feet
|
1 baths - beds |
show details | |

|
#49
N Oak Park Ave
Elmwood Park, IL 60707
|
1,392 sq. feet
|
1 baths - beds |
show details | |

|
Check over 1 million property listings on Foreclosure.com!
|
browse all offers | |||


 | Why are homes so overpriced in the Chicago suburbs? (41 replies) |
| Gay Couple Moving to Chicago. Advise Please. (19 replies) |
| Elmwood Park vs. Northwest side of Chicago (11 replies) |
| Elmwood Park - River Forest border (11 replies) |
| LGBT Friendly Neighborhood (28 replies) |
| Has Elmwood Park really changed that bad for the worst? (13 replies) |
Median year apartment built: 1969
Household type by relationship:
Households: 23,741- Male householders: 4,603 (1,292 living alone), Female householders: 4,591 (1,644 living alone)
3,917 spouses (3,904 opposite-sex spouses), 427 unmarried partners, (409 opposite-sex unmarried partners), 7,643 children (7,487 natural, 40 adopted, 115 stepchildren), 602 grandchildren, 352 brothers or sisters, 728 parents, 0 foster children, 455 other relatives, 237 non-relatives
- In group quarters: 182
Size of family households: 2,097 2-persons, 1,521 3-persons, 1,618 4-persons, 458 5-persons, 255 6-persons, 72 7-or-more-persons.
Size of nonfamily households: 3,155 1-person, 378 2-persons, 8 3-persons, 10 4-persons.
3,036 married couples with children.
1,208 single-parent households (352 men, 856 women).
53.6% of residents of Elmwood Park speak English at home.
21.9% of residents speak Spanish at home (75% speak English very well, 17% speak English well, 5% speak English not well, 2% don't speak English at all).
20.4% of residents speak other Indo-European language at home (47% speak English very well, 27% speak English well, 23% speak English not well, 3% don't speak English at all).
3.5% of residents speak Asian or Pacific Island language at home (60% speak English very well, 31% speak English well, 10% speak English not well).
1.3% of residents speak other language at home (81% speak English very well, 19% speak English not well).
Foreign born population: 5,879 (24.8%)
(58.8% of them are naturalized citizens)
| Here: | 6.1 |
| State: | 6.4 |
| Here: | 4.0 |
| State: | 4.1 |

- Bedrooms in owner-occupied houses and condos in Elmwood Park, Illinois
- 100no bedroom
- 2731 bedroom
- 1,6802 bedrooms
- 2,2573 bedrooms
- 1,3464 bedrooms
- 2635+ bedrooms

- Bedrooms in renter-occupied apartments in Elmwood Park, Illinois
- 176no bedroom
- 1,1801 bedroom
- 1,4572 bedrooms
- 6953 bedrooms
- 1474 bedrooms
- 335+ bedrooms

- Cars and other vehicles available in Elmwood Park in owner-occupied houses/condos
- 238no vehicle
- 2,1331 vehicle
- 2,2842 vehicles
- 9133 vehicles
- 2614 vehicles
- 905+ vehicles

- Cars and other vehicles available in Elmwood Park in renter-occupied apartments
- 606no vehicle
- 1,9541 vehicle
- 8732 vehicles
- 2303 vehicles
- 234 vehicles
- 05+ vehicles

- Rooms in owner-occupied houses in Elmwood Park, Illinois
- 821 room
- 332 rooms
- 2233 rooms
- 7434 rooms
- 9435 rooms
- 1,6306 rooms
- 9337 rooms
- 6438 rooms
- 6909+ rooms

- Rooms in renter-occupied apartments in Elmwood Park, Illinois
- 1441 room
- 782 rooms
- 9213 rooms
- 1,2154 rooms
- 7305 rooms
- 3096 rooms
- 1617 rooms
- 698 rooms
- 579+ rooms


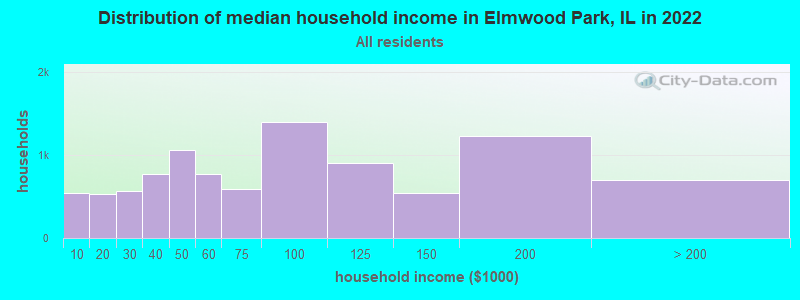
Elmwood Park, IL household income distribution

- 540Less than $10,000
- 534$10,000 to $19,999
- 566$20,000 to $29,999
- 772$30,000 to $39,999
- 1,054$40,000 to $49,999
- 772$50,000 to $59,999
- 587$60,000 to $74,999
- 1,396$75,000 to $99,999
- 908$100,000 to $124,999
- 542$125,000 to $149,999
- 1,231$150,000 to $199,999
- 702$200,000 or more
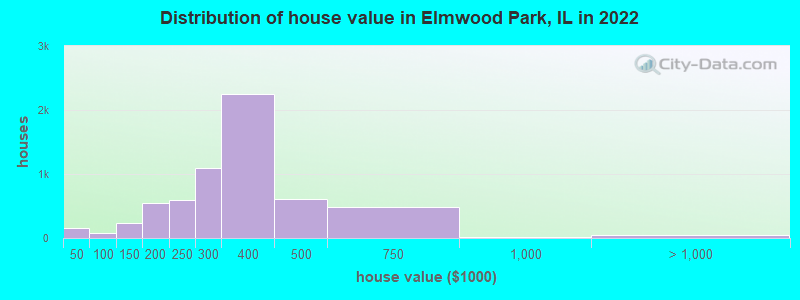
Home value of owner - occupied houses in 2022 in Elmwood Park, IL
-
- 45Less than $10,000
- 22$10,000 to $14,999
- 7$15,000 to $19,999
- 54$20,000 to $24,999
- 8$25,000 to $29,999
- 15$30,000 to $34,999
- 7$40,000 to $49,999
- 6$60,000 to $69,999
- 44$80,000 to $89,999
- 19$90,000 to $99,999
- 124$100,000 to $124,999
- 116$125,000 to $149,999
- 433$150,000 to $174,999
- 118$175,000 to $199,999
- 593$200,000 to $249,999
- 1,097$250,000 to $299,999
- 2,245$300,000 to $399,999
- 601$400,000 to $499,999
- 486$500,000 to $749,999
- 8$750,000 to $999,999
- 29$1,000,000 to $1,499,999
- 14$1,500,000 to $1,999,999
- 2$2,000,000 or more
Rent paid by renters in 2022 in Elmwood Park, IL
-
- 8$100 to $149
- 10$250 to $299
- 7$350 to $399
- 23$450 to $499
- 23$500 to $549
- 3$550 to $599
- 82$600 to $649
- 10$650 to $699
- 30$700 to $749
- 97$750 to $799
- 362$800 to $899
- 411$900 to $999
- 1,136$1,000 to $1,249
- 1,030$1,250 to $1,499
- 199$1,500 to $1,999
- 119$2,000 to $2,499
- 30$2,500 to $2,999
- 14$3,500 or more
- 77No cash rent


Percentage of workers working in this county: 90.1%
Number of people working at home: 1,437 (11.8% of all workers)
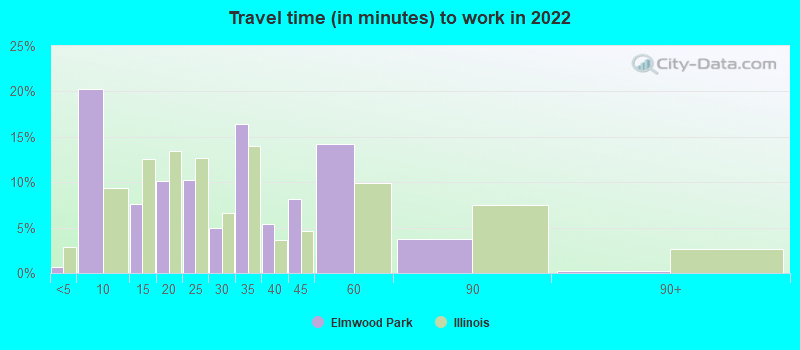
Travel time to work (commute)
- Less than 5 minutes: 17
- 5 to 9 minutes: 577
- 10 to 14 minutes: 826
- 15 to 19 minutes: 867
- 20 to 24 minutes: 1,434
- 25 to 29 minutes: 686
- 30 to 34 minutes: 1,901
- 35 to 39 minutes: 545
- 40 to 44 minutes: 603
- 45 to 59 minutes: 1,665
- 60 to 89 minutes: 975
- 90 or more minutes: 295
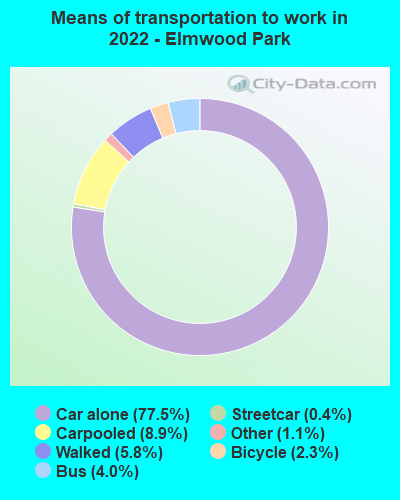
Means of transportation to work:
- Drove a car alone: 2,124 (54.7%)
- Carpooled: 262 (6.7%)
- Bus: 101 (2.6%)
- Subway or elevated rail: 7 (0.2%)
- Taxi: 31 (0.8%)
- Bicycle: 66 (1.7%)
- Walked: 163 (4.2%)
- Worked at home: 1,437 (37.0%)

- Unemployment by race in 2022
- Unemployment rate for White non-Hispanic residents
- 4.1%Males
- 6.0%Females
- Unemployment rate for other race residents
- 8.7%Males
- 6.1%Females
- Unemployment rate for two or more race residents
- 8.3%Females
- Unemployment rate for Hispanic or Latino residents
- 6.1%Males
- 5.8%Females

- Year of entry for the foreign-born population in Elmwood Park, Illinois
- 1,4602010 or later
- 1,5462000 to 2009
- 1,5811990 to 1999
- 1,2211980 to 1989
- 8391970 to 1979
- 1,262Before 1970
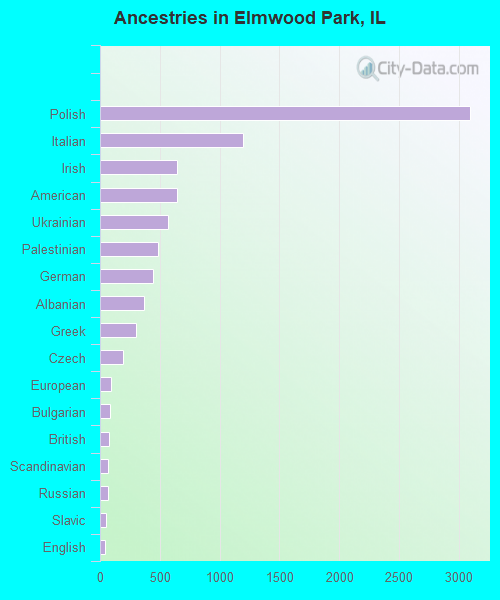
First ancestries reported:
- Polish: 3,098 (20.1%)
- Italian: 1,193 (7.7%)
- Irish: 647 (4.2%)
- American: 642 (4.2%)
- Ukrainian: 570 (3.7%)
- Palestinian: 487 (3.2%)
- German: 444 (2.9%)
- Albanian: 370 (2.4%)
- Greek: 299 (1.9%)
- Czech: 190 (1.2%)
- European: 93 (0.6%)
- Bulgarian: 82 (0.5%)
- British: 75 (0.5%)
- Scandinavian: 70 (0.5%)
- Russian: 67 (0.4%)
- Slavic: 47 (0.3%)
- English: 45 (0.3%)
- Guyanese: 26 (0.2%)
- Romanian: 21 (0.1%)
- Eastern European: 16 (0.1%)
- French Canadian: 16 (0.1%)
- Northern European: 14 (0.09%)
- Serbian: 14 (0.09%)
- Scotch-Irish: 13 (0.08%)
- French: 12 (0.08%)
- Yugoslavian: 12 (0.08%)
- Dutch: 9 (0.06%)
- Croatian: 8 (0.05%)
- West Indian: 8 (0.05%)
- Egyptian: 7 (0.05%)
- Lithuanian: 7 (0.05%)
- Scottish: 7 (0.05%)
- Jordanian: 6 (0.04%)
- Finnish: 6 (0.04%)
- Swedish: 5 (0.03%)
Most common places of birth for foreign-born residents (%):
| Elmwood Park: | 33.9% (1,991) |
| Illinois: | 6.9% (124,474) |
| Elmwood Park: | 10.2% (600) |
| Illinois: | 34.7% (626,958) |
| Elmwood Park: | 9.5% (559) |
| Illinois: | 1.6% (29,316) |
| Elmwood Park: | 8.9% (524) |
| Illinois: | 5.2% (93,003) |
| Elmwood Park: | 6.5% (382) |
| Illinois: | 0.9% (16,553) |
| Elmwood Park: | 4.0% (236) |
| Illinois: | 0.4% (7,117) |
| Elmwood Park: | 3.9% (232) |
| Illinois: | 0.4% (6,488) |
| Elmwood Park: | 3.1% (180) |
| Illinois: | 0.6% (10,720) |
| Elmwood Park: | 2.7% (158) |
| Illinois: | 0.9% (15,679) |
| Elmwood Park: | 2.6% (151) |
| Illinois: | 9.2% (166,409) |
| Elmwood Park: | 1.6% (97) |
| Illinois: | 0.4% (7,171) |
| Elmwood Park: | 1.6% (94) |
| Illinois: | 0.9% (16,844) |
Place of birth for U.S.-born residents:
- This state: 15,125
- Other state: 1,731
- Northeast: 282
- Midwest: 507
- South: 479
- West: 445
90.8% of Elmwood Park residents lived in the same house 1 years ago.
Out of people who lived in different houses, 45.4% lived in this county.
Out of people who lived in different counties, 26.9% lived in Illinois.
| Elmwood Park: | 90.8% |
| State average: | 88.3% |
Education attainment for males 25 years and older:
- No schooling: 188
- Nursery to 4th grade: 0
- 5th and 6th grade: 68
- 7th and 8th grade: 184
- 9th grade: 30
- 10th grade: 40
- 11th grade: 47
- 12th grade, no diploma: 232
- High school graduate (or equivalency): 2,185
- Less than 1 year of college: 650
- Some college more than 1 year, no degree: 1,174
- Associate degree: 678
- Bachelor's degree: 1,520
- Master's degree: 850
- Professional school degree: 149
- Doctorate degree: 47

Education attainment for females 25 years and older:
- No schooling: 191
- Nursery to 4th grade: 6
- 5th and 6th grade: 121
- 7th and 8th grade: 138
- 9th grade: 7
- 10th grade: 54
- 11th grade: 93
- 12th grade, no diploma: 190
- High school graduate (or equivalency): 2,430
- Less than 1 year of college: 362
- Some college more than 1 year, no degree: 1,648
- Associate degree: 793
- Bachelor's degree: 1,669
- Master's degree: 886
- Professional school degree: 234
- Doctorate degree: 51

Housing units in structures:
- One, detached: 5,096
- One, attached: 162
- Two: 697
- 3 or 4: 941
- 5 to 9: 1,518
- 10 to 19: 448
- 20 to 49: 573
- 50 or more: 630
- Mobile homes: 10
Housing units lacking complete kitchen facilities in 2022: 1.5%
House/condo owner moved in on average 17 years ago
Renter moved in on average 1 years ago

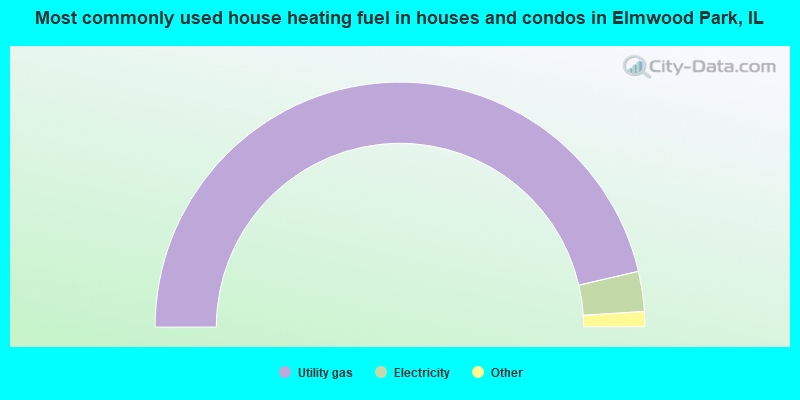
- 92.7%Utility gas
- 5.3%Electricity
- 1.0%Bottled, tank, or LP gas
- 0.5%Other fuel
- 0.3%No fuel used
- 0.2%Solar energy
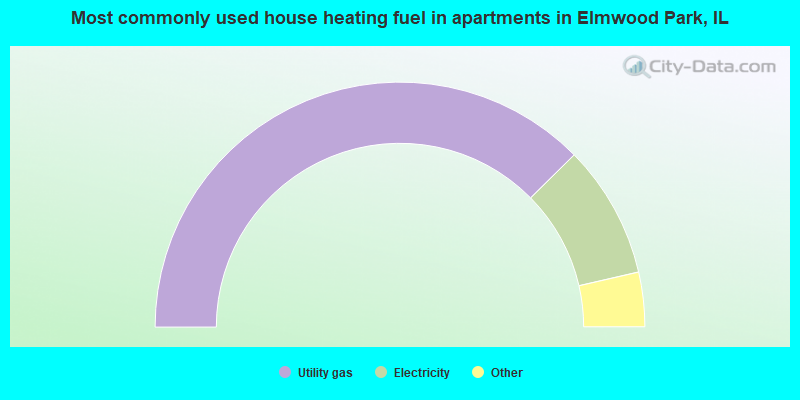
- 75.2%Utility gas
- 17.6%Electricity
- 3.0%Bottled, tank, or LP gas
- 2.9%No fuel used
- 0.9%Wood
- 0.4%Other fuel
Private vs. public school enrollment:
| Here: | 18.5% |
| Illinois: | 13.3% |
| Here: | 22.0% |
| Illinois: | 9.9% |
| Here: | 33.4% |
| Illinois: | 27.4% |


