Elsinore Valley, CA (California) Houses and Residents
| Elsinore Valley: | $616,700 |
| California: | $715,900 |
Total population: 93,311 (Urban population: 64,028 (59,144 inside urbanized areas, 4,884 inside urban clusters), Rural population: 6,788 (28 farm, 6,760 nonfarm))
Houses: 23,709 (22,040 occupied: 16,514 owner occupied, 5,526 renter occupied)
| % of renters here: | 25% |
| State: | 44% |
Housing density: 123 houses/condos per square mile
Median price asked for vacant for-sale houses and condos in 2022 in this county: $550,307.
Median contract rent in 2022: $1,476 (lower quartile is $1,032, upper quartile is $1,898)
Median rent asked for vacant for-rent units in 2022: $1,430
Median gross rent in Elsinore Valley, CA in 2022: $1,693
Housing units in Elsinore Valley with a mortgage: 12,112 (2,659 second mortgage, 722 home equity loan, 41 both second mortgage and home equity loan)
Houses without a mortgage: 1,473
Compare current foreclosures near Elsinore Valley, CA:
| Photo | Address | Area | Beds / Baths | Price | Details |
|---|---|---|---|---|---|

|
#1
View Ln
Corona, CA 92881
|
2,420 sq. feet
|
3 baths 3 beds |
$30,425
|
show details |

|
#2
Red Maple Pl
Perris, CA 92570
|
1,049 sq. feet
|
2 baths 2 beds |
$24,292
|
show details |

|
#3
Ryan Ave
Lake Elsinore, CA 92530
|
- sq. feet
|
2 baths 2 beds |
$519,000
|
show details |

|
#4
Periwinkle Way
Lake Elsinore, CA 92532
|
2,858 sq. feet
|
3 baths 5 beds |
show details | |

|
#5
Sweet Magnolia Way
Murrieta, CA 92563
|
3,732 sq. feet
|
4 baths 4 beds |
show details | |

|
#6
Hibiscus
Lake Elsinore, CA 92530
|
3,014 sq. feet
|
5 baths 5 beds |
show details | |

|
#7
Blue Topaz Dr
Sun City, CA 92585
|
3,290 sq. feet
|
3 baths 5 beds |
show details | |

|
#8
Lumerina St
Corona, CA 92883
|
3,675 sq. feet
|
3 baths 3 beds |
show details | |

|
#9
Prescott Cir
Corona, CA 92881
|
1,853 sq. feet
|
2 baths 4 beds |
show details | |

|
#10
Sugar Gum Rd
Riverside, CA 92508
|
2,028 sq. feet
|
2 baths 4 beds |
show details |
| Photo | Address | Area | Beds / Baths | Price | Details |
|---|---|---|---|---|---|

|
#11
Sanctuary Dr
Corona, CA 92883
|
4,767 sq. feet
|
3 baths 4 beds |
show details | |

|
#12
Grove Dr
Riverside, CA 92503
|
3,269 sq. feet
|
4 baths 4 beds |
show details | |

|
#13
Vista Del Cerro Dr Unit 208
Corona, CA 92879
|
1,063 sq. feet
|
2 baths 2 beds |
show details | |

|
#14
S Peak Ct
Riverside, CA 92503
|
4,576 sq. feet
|
3 baths 4 beds |
show details | |

|
#15
Baldy Peak Dr
Sun City, CA 92586
|
1,570 sq. feet
|
3 baths 3 beds |
show details | |

|
#16
S Buena Vista Ave
Corona, CA 92882
|
3,099 sq. feet
|
2 baths 4 beds |
show details | |

|
#17
Independence Way
Corona, CA 92882
|
2,040 sq. feet
|
2 baths 4 beds |
show details | |

|
#18
Villa Valtelena
Lake Elsinore, CA 92532
|
2,589 sq. feet
|
3 baths 4 beds |
show details | |

|
#19
Westlake Dr
Menifee, CA 92584
|
1,746 sq. feet
|
2 baths 3 beds |
show details | |

|
#20
Canyon Estates Dr
Lake Elsinore, CA 92532
|
2,358 sq. feet
|
2 baths 6 beds |
show details |
| Photo | Address | Area | Beds / Baths | Price | Details |
|---|---|---|---|---|---|

|
#21
Avenue 10 # 10
Lake Elsinore, CA 92530
|
1,705 sq. feet
|
2 baths 3 beds |
show details | |

|
#22
Serrana Rd
Perris, CA 92570
|
1,300 sq. feet
|
2 baths 3 beds |
show details | |

|
#23
Almont Way
Sun City, CA 92585
|
2,865 sq. feet
|
3 baths 6 beds |
show details | |

|
#24
Park Ave
Perris, CA 92570
|
1,368 sq. feet
|
1 baths 3 beds |
show details | |

|
#25
Fortuna St
Perris, CA 92571
|
- sq. feet
|
2 baths 3 beds |
show details | |

|
#26
Via Las Laderas
Murrieta, CA 92562
|
2,102 sq. feet
|
2 baths 3 beds |
show details | |

|
#27
Wanki Ave
Wildomar, CA 92595
|
1,899 sq. feet
|
2 baths 3 beds |
show details | |

|
#28
Calle Arrebol
Murrieta, CA 92563
|
1,810 sq. feet
|
2 baths 2 beds |
show details | |

|
#29
Morning Mist Ct
Riverside, CA 92503
|
4,576 sq. feet
|
4 baths 5 beds |
show details | |

|
#30
Martin Pl
Riverside, CA 92503
|
2,532 sq. feet
|
2 baths 4 beds |
show details |
| Photo | Address | Area | Beds / Baths | Price | Details |
|---|---|---|---|---|---|

|
#31
Piazza Ct
Menifee, CA 92584
|
- sq. feet
|
2 baths 4 beds |
show details | |

|
#32
Canopy Ln
Lake Elsinore, CA 92532
|
3,794 sq. feet
|
3 baths 6 beds |
show details | |

|
#33
Daybreak Ln
Rancho Santa Margarita, CA 92688
|
1,420 sq. feet
|
2 baths 3 beds |
show details | |

|
#34
Abington St
Riverside, CA 92503
|
4,132 sq. feet
|
4 baths 4 beds |
show details | |

|
#35
Eleanor Ln
Moreno Valley, CA 92551
|
1,123 sq. feet
|
2 baths 3 beds |
show details | |

|
#36
Desert Rose Way
Lake Elsinore, CA 92532
|
3,060 sq. feet
|
2 baths 3 beds |
show details | |

|
#37
Quartz Cir
Corona, CA 92882
|
3,181 sq. feet
|
4 baths 5 beds |
show details | |

|
#38
Tierra Shores Ln
Menifee, CA 92584
|
1,979 sq. feet
|
2 baths 3 beds |
show details | |

|
#39
Cleveland Ave
Riverside, CA 92503
|
2,302 sq. feet
|
2 baths 4 beds |
show details | |

|
#40
Silverado Canyon Rd
Silverado, CA 92676
|
1,032 sq. feet
|
2 baths 3 beds |
show details |
| Photo | Address | Area | Beds / Baths | Price | Details |
|---|---|---|---|---|---|

|
#41
Parkwell Ct
Riverside, CA 92505
|
3,257 sq. feet
|
3 baths 5 beds |
show details | |

|
#42
Avenida Bonita
Murrieta, CA 92562
|
3,359 sq. feet
|
4 baths 4 beds |
show details | |

|
#43
32981 N. Peak Dr.
Trabuco Canyon, CA 92679
|
2,647 sq. feet
|
2 baths 4 beds |
show details | |

|
#44
Belvedere Way
Corona, CA 92882
|
2,113 sq. feet
|
3 baths 4 beds |
show details | |

|
#45
Sonata Dr
Murrieta, CA 92562
|
3,028 sq. feet
|
3 baths 5 beds |
show details | |

|
#46
Almond Dr
Perris, CA 92571
|
1,516 sq. feet
|
2 baths 3 beds |
show details | |

|
#47
Via Joaquin
Rancho Santa Margarita, CA 92688
|
1,100 sq. feet
|
2 baths 3 beds |
show details | |

|
#48
Zancon
Mission Viejo, CA 92692
|
1,123 sq. feet
|
2 baths 3 beds |
show details | |

|
#49
Bonnie Lea Dr
Lake Elsinore, CA 92530
|
702 sq. feet
|
1 baths 1 beds |
show details | |

|
Check over 1 million property listings on Foreclosure.com!
|
browse all offers | |||

Household type by relationship:
Households: 2,153,812- In family households: 1,916,707 (357,691 male householders, 152,550 female householders)
376,381 spouses, 728,028 children (675,451 natural, 15,499 adopted, 37,078 stepchildren), 69,455 grandchildren, 34,232 brothers or sisters, 33,896 parents, foster children, 57,727 other relatives, 76,462 non-relatives
- In nonfamily households: 237,105 (84,686 male householders (58,397 living alone)), 91,333 female householders (74,097 living alone)), 61,086 nonrelatives
- In group quarters: 35,829 (20,862 institutionalized population)
308,692 married couples with children.
98,911 single-parent households (26,262 men, 72,649 women).
74.3% of residents of Elsinore Valley speak English at home.
22.8% of residents speak Spanish at home (55% speak English very well, 21% speak English well, 17% speak English not well, 7% don't speak English at all).
1.5% of residents speak other Indo-European language at home (68% speak English very well, 20% speak English well, 12% speak English not well).
1.3% of residents speak Asian or Pacific Island language at home (62% speak English very well, 15% speak English well, 23% speak English not well).
0.1% of residents speak other language at home (70% speak English very well, 20% speak English well, 10% speak English not well).
Foreign born population: 18,627 (16.4%)
(60.1% of them are naturalized citizens)
| Here: | 7.3 |
| State: | 6.0 |
| Here: | 5.7 |
| State: | 3.9 |

- Bedrooms in owner-occupied houses and condos in Elsinore Valley, California
- 201no bedroom
- 1,0321 bedroom
- 2,7692 bedrooms
- 7,2083 bedrooms
- 4,3644 bedrooms
- 9405+ bedrooms

- Bedrooms in renter-occupied apartments in Elsinore Valley, California
- 562no bedroom
- 1,0251 bedroom
- 2,2542 bedrooms
- 1,3103 bedrooms
- 2934 bedrooms
- 825+ bedrooms

- Cars and other vehicles available in Elsinore Valley in owner-occupied houses/condos
- 360no vehicle
- 3,5891 vehicle
- 7,7652 vehicles
- 3,3143 vehicles
- 1,0424 vehicles
- 4445+ vehicles

- Cars and other vehicles available in Elsinore Valley in renter-occupied apartments
- 720no vehicle
- 2,3181 vehicle
- 1,7642 vehicles
- 5323 vehicles
- 1394 vehicles
- 535+ vehicles

- Rooms in owner-occupied houses in Elsinore Valley, California
- 1141 room
- 3892 rooms
- 1,1843 rooms
- 1,3594 rooms
- 3,0915 rooms
- 3,8116 rooms
- 3,3997 rooms
- 2,0078 rooms
- 1,1609+ rooms

- Rooms in renter-occupied apartments in Elsinore Valley, California
- 2591 room
- 6122 rooms
- 9403 rooms
- 1,3584 rooms
- 1,1855 rooms
- 5816 rooms
- 3127 rooms
- 1958 rooms
- 849+ rooms


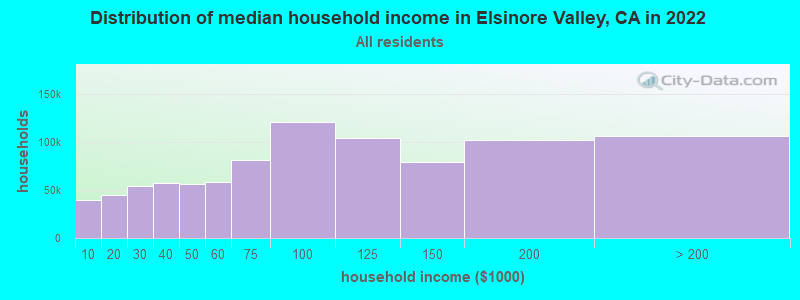
Elsinore Valley, CA household income distribution

- 39,480Less than $10,000
- 44,649$10,000 to $19,999
- 53,887$20,000 to $29,999
- 57,260$30,000 to $39,999
- 56,552$40,000 to $49,999
- 58,157$50,000 to $59,999
- 81,432$60,000 to $74,999
- 120,502$75,000 to $99,999
- 103,702$100,000 to $124,999
- 79,316$125,000 to $149,999
- 101,338$150,000 to $199,999
- 106,042$200,000 or more
Percentage of workers working in this county: 61.7%
Number of people working at home: 6,318 (11.7% of all workers)
Travel time to work (commute)
- Less than 5 minutes: 335
- 5 to 9 minutes: 1,313
- 10 to 14 minutes: 2,340
- 15 to 19 minutes: 2,597
- 20 to 24 minutes: 2,889
- 25 to 29 minutes: 1,251
- 30 to 34 minutes: 3,499
- 35 to 39 minutes: 772
- 40 to 44 minutes: 1,264
- 45 to 59 minutes: 3,324
- 60 to 89 minutes: 5,153
- 90 or more minutes: 2,528
Means of transportation to work:
- Drove a car alone: 21,147 (74.1%)
- Carpooled: 5,246 (18.4%)
- Bus or trolley bus: 159 (0.6%)
- Streetcar or trolley car: 9 (0.0%)
- Railroad: 99 (0.3%)
- Motorcycle: 78 (0.3%)
- Bicycle: 86 (0.3%)
- Walked: 263 (0.9%)
- Other means: 178 (0.6%)
- Worked at home: 1,257 (4.4%)


- Year of entry for the foreign-born population in Elsinore Valley, California
- 1,2361995 to March 2000
- 1,6781990 to 1994
- 1,8821985 to 1989
- 1,1761980 to 1984
- 1,2691975 to 1979
- 9831970 to 1974
- 5881965 to 1969
- 1,249Before 1965
Most common places of birth for foreign-born residents (%):
| Elsinore Valley: | 65.2% (6,556) |
| California: | 44.3% (3,928,701) |
| Elsinore Valley: | 5.5% (557) |
| California: | 2.4% (211,458) |
| Elsinore Valley: | 4.0% (400) |
| California: | 7.5% (664,935) |
| Elsinore Valley: | 2.5% (249) |
| California: | 1.6% (141,181) |
| Elsinore Valley: | 2.5% (248) |
| California: | 1.5% (133,090) |
| Elsinore Valley: | 1.7% (175) |
| California: | 4.1% (359,673) |
| Elsinore Valley: | 1.5% (151) |
| California: | 1.1% (98,160) |
Place of birth for U.S.-born residents:
- This state: 43,779
- Other state: 16,400
- Northeast: 3,170
- Midwest: 5,979
- South: 4,110
- West: 3,141
46% of Elsinore Valley residents lived in the same house 5 years ago.
Out of people who lived in different houses, 50% lived in this county.
Out of people who lived in different counties, 85% lived in California.
Education attainment for males 25 years and older:
- No schooling: 463
- Nursery to 4th grade: 202
- 5th and 6th grade: 563
- 7th and 8th grade: 493
- 9th grade: 678
- 10th grade: 425
- 11th grade: 753
- 12th grade, no diploma: 1,118
- High school graduate (or equivalency): 5,296
- Less than 1 year of college: 2,110
- Some college more than 1 year, no degree: 3,752
- Associate degree: 1,512
- Bachelor's degree: 2,078
- Master's degree: 548
- Professional school degree: 197
- Doctorate degree: 91

Education attainment for females 25 years and older:
- No schooling: 463
- Nursery to 4th grade: 227
- 5th and 6th grade: 629
- 7th and 8th grade: 672
- 9th grade: 522
- 10th grade: 622
- 11th grade: 781
- 12th grade, no diploma: 1,103
- High school graduate (or equivalency): 5,823
- Less than 1 year of college: 2,257
- Some college more than 1 year, no degree: 3,701
- Associate degree: 1,585
- Bachelor's degree: 1,875
- Master's degree: 462
- Professional school degree: 142
- Doctorate degree: 22


Housing units in structures:
- One, detached: 16,726
- One, attached: 856
- Two: 330
- 3 or 4: 695
- 5 to 9: 564
- 10 to 19: 329
- 20 to 49: 200
- 50 or more: 241
- Mobile homes: 3,398
- Boats, RVs, vans, etc.: 370
Median worth of mobile homes: $220,596
Housing units lacking complete kitchen facilities: 1.1%

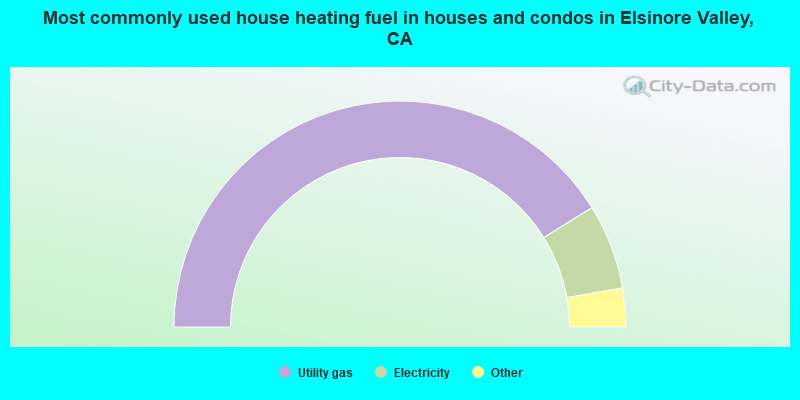
- 82.3%Utility gas
- 12.2%Electricity
- 3.7%Bottled, tank, or LP gas
- 1.0%Wood
- 0.5%No fuel used
- 0.2%Other fuel
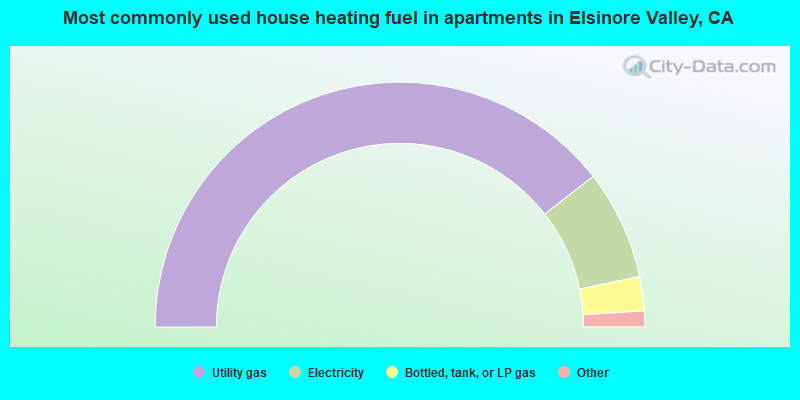
- 79.0%Utility gas
- 14.5%Electricity
- 4.5%Bottled, tank, or LP gas
- 1.0%No fuel used
- 0.7%Other fuel
- 0.3%Wood
- 0.2%Fuel oil, kerosene, etc.
Private vs. public school enrollment:
| Here: | 7.7% |
| California: | 9.9% |
| Here: | 3.9% |
| California: | 7.8% |
| Here: | 16.5% |
| California: | 15.4% |


