Erving, MA (Massachusetts) Houses and Residents
| Erving: | $240,068 |
| Massachusetts: | $534,700 |
Total population: 1,800 (Urban population: 723 (all inside urban clusters), Rural population: 741 (all nonfarm))
Houses: 630 (602 occupied: 476 owner occupied, 126 renter occupied)
| % of renters here: | 21% |
| State: | 38% |
Housing density: 45 houses/condos per square mile
Median price asked for vacant for-sale houses and condos in 2022 in this county: $191,319.
Median contract rent in 2022: $836 (lower quartile is $538, upper quartile is $1,038)
Median rent asked for vacant for-rent units in 2022: $895
Median gross rent in Erving, MA in 2022: $950
Housing units in Erving with a mortgage: 257 (17 second mortgage, 25 home equity loan, 0 both second mortgage and home equity loan)
Houses without a mortgage: 128


Latest news about housing in Erving, MA collected exclusively by city-data.com from local newspapers, TV, and radio stations

 | How Much Massachusetts Households Make Per Year: Census Data (37 replies) |
| Is Massachusetts Real Estate Affordable? (132 replies) |
| Is it possible to escape hunters, ATVs and noise in a rural area? (278 replies) |
| The Safest Low-Rent Neighborhood in Massachusetts? (42 replies) |
| Which Franklin county town for young family? (12 replies) |
| "Misplaced" cities and towns (26 replies) |

Household type by relationship:
Households: 69,891- In family households: 54,236 (12,210 male householders, 6,107 female householders)
13,655 spouses, 17,750 children (16,448 natural, 543 adopted, 759 stepchildren), 917 grandchildren, 418 brothers or sisters, 464 parents, foster children, 409 other relatives, 1,987 non-relatives
- In nonfamily households: 15,655 (5,446 male householders (3,978 living alone)), 6,699 female householders (5,318 living alone)), 3,510 nonrelatives
- In group quarters: 1,481 (665 institutionalized population)
11,122 married couples with children.
4,422 single-parent households (1,025 men, 3,397 women).
95.6% of residents of Erving speak English at home.
1.6% of residents speak Spanish at home (64% speak English very well, 14% speak English well, 23% speak English not well).
2.8% of residents speak other Indo-European language at home (74% speak English very well, 16% speak English well, 11% speak English not well).
Foreign born population: 46 (3.2%)
(60.9% of them are naturalized citizens)
| Here: | 6.4 |
| State: | 6.5 |
| Here: | 4.0 |
| State: | 4.0 |

- Bedrooms in owner-occupied houses and condos in Erving, Massachusetts
- 2no bedroom
- 41 bedroom
- 1152 bedrooms
- 2803 bedrooms
- 624 bedrooms
- 135+ bedrooms

- Bedrooms in renter-occupied apartments in Erving, Massachusetts
- 8no bedroom
- 381 bedroom
- 392 bedrooms
- 293 bedrooms
- 124 bedrooms
- 05+ bedrooms

- Cars and other vehicles available in Erving in owner-occupied houses/condos
- 18no vehicle
- 1551 vehicle
- 2132 vehicles
- 663 vehicles
- 214 vehicles
- 35+ vehicles

- Cars and other vehicles available in Erving in renter-occupied apartments
- 10no vehicle
- 631 vehicle
- 452 vehicles
- 83 vehicles
- 04 vehicles
- 05+ vehicles

- Rooms in owner-occupied houses in Erving, Massachusetts
- 21 room
- 02 rooms
- 13 rooms
- 304 rooms
- 1105 rooms
- 1666 rooms
- 987 rooms
- 438 rooms
- 269+ rooms

- Rooms in renter-occupied apartments in Erving, Massachusetts
- 81 room
- 202 rooms
- 233 rooms
- 124 rooms
- 215 rooms
- 236 rooms
- 67 rooms
- 58 rooms
- 89+ rooms


Erving, MA household income distribution

- 1,459Less than $10,000
- 3,200$10,000 to $19,999
- 2,995$20,000 to $29,999
- 2,186$30,000 to $39,999
- 1,914$40,000 to $49,999
- 2,797$50,000 to $59,999
- 2,774$60,000 to $74,999
- 4,939$75,000 to $99,999
- 3,044$100,000 to $124,999
- 2,196$125,000 to $149,999
- 1,765$150,000 to $199,999
- 2,298$200,000 or more

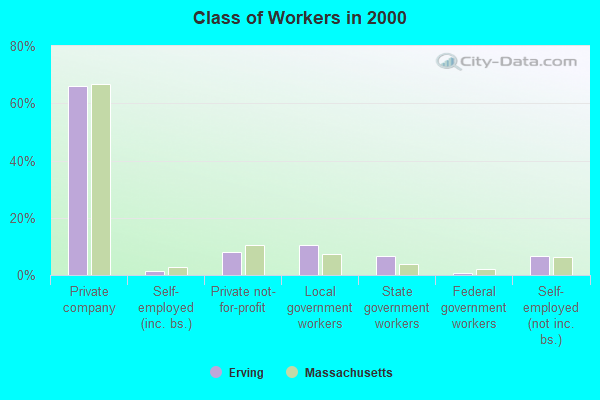
Percentage of workers working in this county: 82.5%
Number of people working at home: 158 (18.4% of all workers)
Travel time to work (commute)
- Less than 5 minutes: 35
- 5 to 9 minutes: 65
- 10 to 14 minutes: 90
- 15 to 19 minutes: 128
- 20 to 24 minutes: 139
- 25 to 29 minutes: 61
- 30 to 34 minutes: 96
- 35 to 39 minutes: 18
- 40 to 44 minutes: 14
- 45 to 59 minutes: 43
- 60 to 89 minutes: 25
- 90 or more minutes: 10
Means of transportation to work:
- Drove a car alone: 621 (83.0%)
- Carpooled: 81 (10.8%)
- Bus or trolley bus: 5 (0.7%)
- Motorcycle: 1 (0.1%)
- Walked: 14 (1.9%)
- Other means: 2 (0.3%)
- Worked at home: 24 (3.2%)

- Year of entry for the foreign-born population in Erving, Massachusetts
- 21995 to March 2000
- 21990 to 1994
- 01985 to 1989
- 01980 to 1984
- 31975 to 1979
- 71970 to 1974
- 51965 to 1969
- 11Before 1965

First ancestries reported:
- French: 275 (15.9%)
- English: 252 (14.6%)
- Polish: 231 (13.4%)
- Irish: 222 (12.8%)
- French Canadian: 151 (8.7%)
- German: 146 (8.4%)
- Other: 118 (6.8%)
- Italian: 68 (3.9%)
- United States: 68 (3.9%)
- Lithuanian: 47 (2.7%)
- Scottish: 31 (1.8%)
- Swedish: 26 (1.5%)
- Scotch-Irish: 19 (1.1%)
- Dutch: 18 (1.0%)
- Norwegian: 15 (0.9%)
- Ukrainian: 13 (0.8%)
- Welsh: 12 (0.7%)
- Danish: 8 (0.5%)
- Portuguese: 4 (0.2%)
- Swiss: 2 (0.1%)
- Czech: 1 (0.06%)
- Greek: 1 (0.06%)
Most common places of birth for foreign-born residents (%):
| Erving: | 40.0% (12) |
| Massachusetts: | 5.2% (40,247) |
| Erving: | 16.7% (5) |
| Massachusetts: | 1.7% (13,456) |
| Erving: | 10.0% (3) |
| Massachusetts: | 3.7% (28,319) |
| Erving: | 10.0% (3) |
| Massachusetts: | 1.8% (13,543) |
| Erving: | 10.0% (3) |
| Massachusetts: | 3.6% (28,086) |
| Erving: | 6.7% (2) |
| Massachusetts: | 3.3% (25,403) |
| Erving: | 6.7% (2) |
| Massachusetts: | 0.4% (3,051) |
Place of birth for U.S.-born residents:
- This state: 1,213
- Other state: 214
- Northeast: 113
- Midwest: 36
- South: 40
- West: 25
65% of Erving residents lived in the same house 5 years ago.
Out of people who lived in different houses, 79% lived in this county.
Out of people who lived in different counties, 51% lived in Massachusetts.
Education attainment for males 25 years and older:
- No schooling: 2
- Nursery to 4th grade: 0
- 5th and 6th grade: 6
- 7th and 8th grade: 9
- 9th grade: 9
- 10th grade: 12
- 11th grade: 22
- 12th grade, no diploma: 11
- High school graduate (or equivalency): 276
- Less than 1 year of college: 33
- Some college more than 1 year, no degree: 43
- Associate degree: 32
- Bachelor's degree: 44
- Master's degree: 9
- Professional school degree: 0
- Doctorate degree: 3

Education attainment for females 25 years and older:
- No schooling: 0
- Nursery to 4th grade: 0
- 5th and 6th grade: 0
- 7th and 8th grade: 8
- 9th grade: 14
- 10th grade: 12
- 11th grade: 24
- 12th grade, no diploma: 32
- High school graduate (or equivalency): 223
- Less than 1 year of college: 31
- Some college more than 1 year, no degree: 56
- Associate degree: 61
- Bachelor's degree: 42
- Master's degree: 18
- Professional school degree: 4
- Doctorate degree: 0


Housing units in structures:
- One, detached: 473
- One, attached: 17
- Two: 59
- 3 or 4: 45
- 10 to 19: 15
- 20 to 49: 12
- Mobile homes: 9
Median worth of mobile homes: $116,955
Housing units lacking complete kitchen facilities: 1.3%

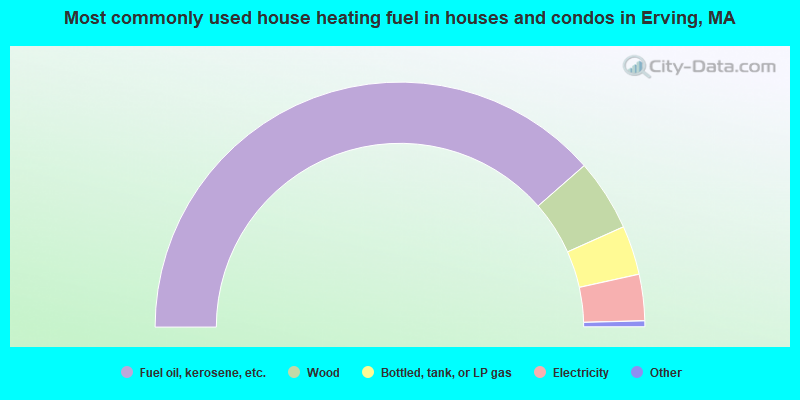
- 77.1%Fuel oil, kerosene, etc.
- 9.5%Wood
- 6.5%Bottled, tank, or LP gas
- 6.1%Electricity
- 0.4%Utility gas
- 0.2%Coal or coke
- 0.2%Solar energy
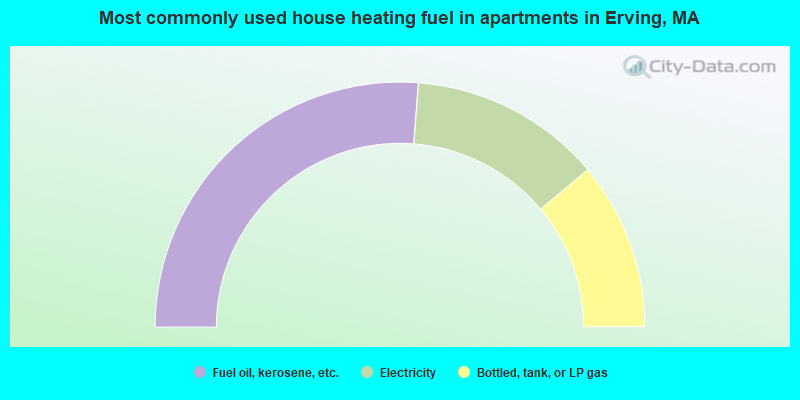
- 52.4%Fuel oil, kerosene, etc.
- 25.4%Electricity
- 22.2%Bottled, tank, or LP gas
Private vs. public school enrollment:
| Here: | 0.0% |
| Massachusetts: | 10.8% |
| Here: | 9.4% |
| Massachusetts: | 12.2% |
| Here: | 33.3% |
| Massachusetts: | 48.2% |


