Housing density: 2,022 houses/condos per square mile
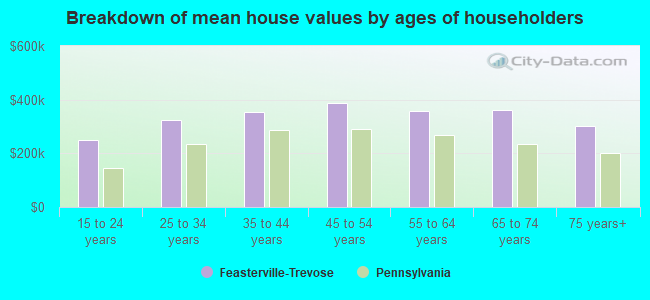
Median price asked for vacant for-sale houses and condos in 2022 in this county: $426,803.
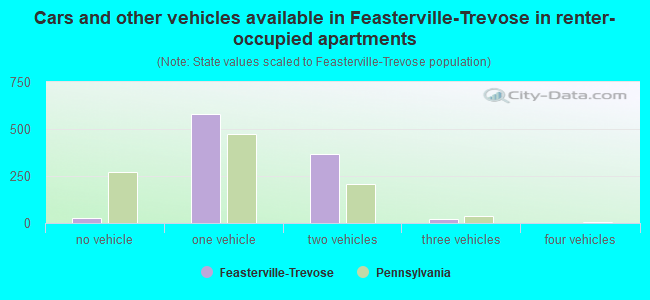
Median contract rent in 2022: $1,463 (lower quartile is $1,314, upper quartile is $1,646)
Median rent asked for vacant for-rent units in 2022: $1,639
Median gross rent in Feasterville-Trevose, PA in 2022: $1,516
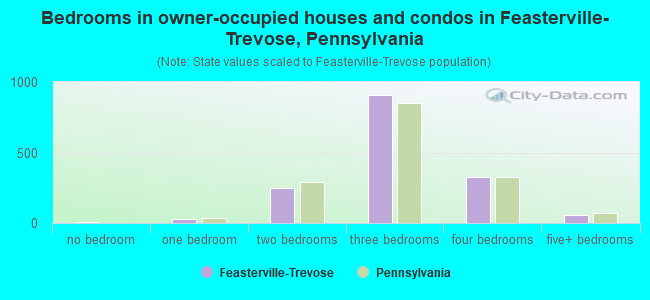
Housing units in Feasterville-Trevose with a mortgage: 901 (42 second mortgage, 182 home equity loan, 0 both second mortgage and home equity loan) Houses without a mortgage: 579
Compare current foreclosures near Feasterville-Trevose, PA:
In family households: 535,609 (125,467 male householders, 43,198 female householders)
136,531 spouses, 190,096 children (179,512 natural, 3,992 adopted, 6,592 stepchildren), 9,957 grandchildren, 4,196 brothers or sisters, 6,188 parents, foster children, 4,791 other relatives, 10,224 non-relatives
In nonfamily households: 81,407 (30,165 male householders (23,033 living alone)), 36,019 female householders (30,879 living alone)), 15,223 nonrelatives
In group quarters: 8,233 (5,275 institutionalized population)
121,743 married couples with children.
21,725 single-parent households (5,641 men, 16,084 women).
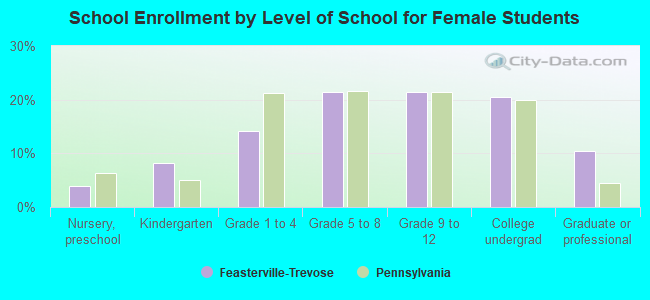
88.1% of residents of Feasterville-Trevose speak English at home.
2.0% of residents speak Spanish at home (63% speak English very well, 20% speak English well, 16% speak English not well).
8.2% of residents speak other Indo-European language at home (59% speak English very well, 34% speak English well, 7% speak English not well).
1.4% of residents speak Asian or Pacific Island language at home (63% speak English very well, 37% speak English well).
0.3% of residents speak other language at home (100% speak English very well).
Foreign born population: 1,074 (15.4%)
(54.7% of them are naturalized citizens)
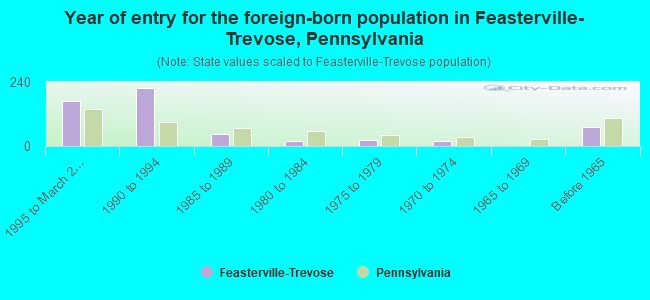
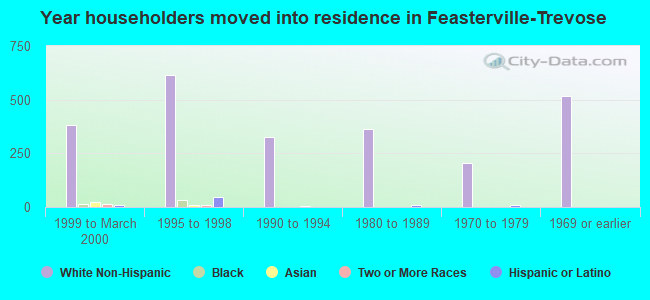
Year of entry for the foreign-born population in Feasterville-Trevose, Pennsylvania
1691995 to March 2000
2161990 to 1994
441985 to 1989
191980 to 1984
241975 to 1979
191970 to 1974
01965 to 1969
71Before 1965
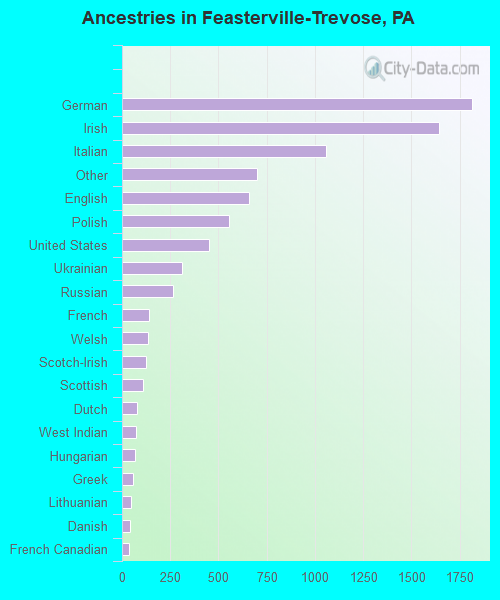
First ancestries reported:
German: 1,812 (21.6%)
Irish: 1,641 (19.6%)
Italian: 1,056 (12.6%)
Other: 701 (8.4%)
English: 656 (7.8%)
Polish: 553 (6.6%)
United States: 450 (5.4%)
Ukrainian: 311 (3.7%)
Russian: 262 (3.1%)
French: 141 (1.7%)
Welsh: 135 (1.6%)
Scotch-Irish: 123 (1.5%)
Scottish: 110 (1.3%)
Dutch: 80 (1.0%)
West Indian: 70 (0.8%)
Hungarian: 65 (0.8%)
Greek: 59 (0.7%)
Lithuanian: 45 (0.5%)
Danish: 43 (0.5%)
French Canadian: 36 (0.4%)
Subsaharan African: 13 (0.2%)
Arab: 10 (0.1%)
Norwegian: 9 (0.1%)
Swedish: 8 (0.10%)
Most common places of birth for foreign-born residents (%):
Ukraine
Feasterville-Trevose:
29.5% (166)
Pennsylvania:
3.3% (16,897)
Russia
Feasterville-Trevose:
23.1% (130)
Pennsylvania:
2.7% (13,885)
China, excluding Hong Kong and Taiwan
Feasterville-Trevose:
10.3% (58)
Pennsylvania:
4.6% (23,478)
Germany
Feasterville-Trevose:
6.0% (34)
Pennsylvania:
5.1% (25,685)
Belarus
Feasterville-Trevose:
4.8% (27)
Pennsylvania:
0.3% (1,472)
Other Eastern Europe
Feasterville-Trevose:
3.0% (17)
Pennsylvania:
1.7% (8,574)
Costa Rica
Feasterville-Trevose:
2.8% (16)
Pennsylvania:
0.2% (1,005)
India
Feasterville-Trevose:
2.5% (14)
Pennsylvania:
7.4% (37,541)
Barbados
Feasterville-Trevose:
2.5% (14)
Pennsylvania:
0.2% (1,248)
Austria
Feasterville-Trevose:
2.0% (11)
Pennsylvania:
0.5% (2,714)
Israel
Feasterville-Trevose:
2.0% (11)
Pennsylvania:
0.5% (2,475)
Netherlands
Feasterville-Trevose:
1.6% (9)
Pennsylvania:
0.4% (2,265)
Yugoslavia
Feasterville-Trevose:
1.6% (9)
Pennsylvania:
0.7% (3,328)
Argentina
Feasterville-Trevose:
1.6% (9)
Pennsylvania:
0.5% (2,409)
Canada
Feasterville-Trevose:
1.6% (9)
Pennsylvania:
3.0% (15,200)
Place of birth for U.S.-born residents:
This state: 5,133
Other state: 703
Northeast: 360
Midwest: 93
South: 144
West: 106
63% of Feasterville-Trevose residents lived in the same house 5 years ago. Out of people who lived in different houses, 51% lived in this county. Out of people who lived in different counties, 70% lived in Pennsylvania.
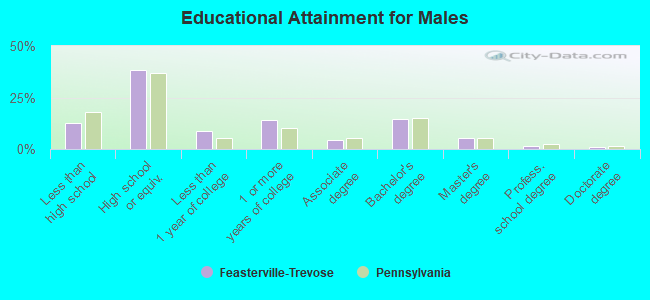
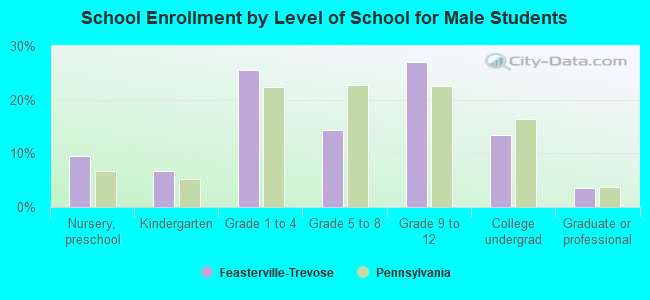
Education attainment for males 25 years and older:
No schooling: 18
Nursery to 4th grade: 0
5th and 6th grade: 0
7th and 8th grade: 54
9th grade: 18
10th grade: 56
11th grade: 92
12th grade, no diploma: 50
High school graduate (or equivalency): 861
Less than 1 year of college: 199
Some college more than 1 year, no degree: 312
Associate degree: 96
Bachelor's degree: 323
Master's degree: 121
Professional school degree: 34
Doctorate degree: 17
Education attainment for females 25 years and older:
No schooling: 0
Nursery to 4th grade: 0
5th and 6th grade: 17
7th and 8th grade: 36
9th grade: 49
10th grade: 54
11th grade: 63
12th grade, no diploma: 71
High school graduate (or equivalency): 989
Less than 1 year of college: 190
Some college more than 1 year, no degree: 207
Associate degree: 105
Bachelor's degree: 352
Master's degree: 130
Professional school degree: 30
Doctorate degree: 18
Housing units in structures:
One, detached: 1,643
One, attached: 54
Two: 64
3 or 4: 28
5 to 9: 291
10 to 19: 187
20 to 49: 242
50 or more: 178
Housing units lacking complete plumbing facilities: 0.3%