Felton, DE (Delaware) Houses and Residents
| Felton: | $283,208 |
| Delaware: | $337,200 |
Mean price in 2022:
Detached houses: $291,365
Here: $291,365 State: $419,599 Mobile homes: $97,696
Here: $97,696 State: $106,273
Total population: 1,386 (Urban population: 0, Rural population: 767 (all nonfarm))
Houses: 588 (569 occupied: 345 owner occupied, 237 renter occupied)
| % of renters here: | 41% |
| State: | 26% |
Housing density: 951 houses/condos per square mile
Median price asked for vacant for-sale houses and condos in 2022 in this county: $164,361.
Median contract rent in 2022: $654 (lower quartile is $495, upper quartile is $1,074)
Median rent asked for vacant for-rent units in 2022: $387
Median gross rent in Felton, DE in 2022: $843
Housing units in Felton with a mortgage: 269 (0 second mortgage, 0 home equity loan, 0 both second mortgage and home equity loan)
Houses without a mortgage: 0
Median household income for houses/condos with a mortgage: $97,193
Median household income for apartments without a mortgage: $54,392
Median monthly housing costs: $1,034
Compare current foreclosures near Felton, DE:
| Photo | Address | Area | Beds / Baths | Price | Details |
|---|---|---|---|---|---|

|
#1
Tiburan Ct
Felton, DE 19943
|
- sq. feet
|
- baths - beds |
show details | |

|
#2
Rockwood Blvd
Felton, DE 19943
|
- sq. feet
|
- baths - beds |
show details | |

|
#3
Irish Hill Rd
Felton, DE 19943
|
- sq. feet
|
- baths - beds |
show details | |

|
#4
Spectrum Farms Rd
Felton, DE 19943
|
- sq. feet
|
- baths - beds |
show details | |

|
#5
Countryside Dr
Felton, DE 19943
|
- sq. feet
|
- baths - beds |
show details | |

|
#6
Pilgrim Ct
Felton, DE 19943
|
- sq. feet
|
- baths - beds |
show details | |

|
#7
Milford Harrington H
Milford, DE 19963
|
1,348 sq. feet
|
1 baths 3 beds |
$210,000
|
show details |

|
#8
Sudlersville Rd
Sudlersville, MD 21668
|
1,657 sq. feet
|
2 baths 3 beds |
$415,000
|
show details |

|
#9
New Castle Ave
Felton, DE 19943
|
- sq. feet
|
- baths - beds |
show details | |

|
#10
Hills Market Rd
Felton, DE 19943
|
- sq. feet
|
- baths - beds |
show details |
| Photo | Address | Area | Beds / Baths | Price | Details |
|---|---|---|---|---|---|

|
#11
Blaine Dr
Felton, DE 19943
|
- sq. feet
|
- baths - beds |
show details | |

|
#12
S Ember Dr
Felton, DE 19943
|
- sq. feet
|
- baths - beds |
show details | |

|
#13
Central Dr
Felton, DE 19943
|
- sq. feet
|
- baths - beds |
show details | |

|
#14
Spider Web Rd
Felton, DE 19943
|
- sq. feet
|
- baths - beds |
show details | |

|
#15
Mels Dr
Felton, DE 19943
|
- sq. feet
|
- baths - beds |
show details | |

|
#16
Mount Olive Cemetery Rd
Felton, DE 19943
|
- sq. feet
|
- baths - beds |
show details | |

|
#17
Berrytown Rd
Felton, DE 19943
|
- sq. feet
|
- baths - beds |
show details | |

|
#18
Equitation Ln
Felton, DE 19943
|
- sq. feet
|
- baths - beds |
show details | |

|
#19
Dickens Ln
Felton, DE 19943
|
- sq. feet
|
- baths - beds |
show details | |

|
#20
Main St
Dover, DE 19901
|
- sq. feet
|
1 baths 2 beds |
show details |
| Photo | Address | Area | Beds / Baths | Price | Details |
|---|---|---|---|---|---|

|
#21
Marvel Road
Marydel, MD 21649
|
2,475 sq. feet
|
2 baths 4 beds |
show details | |

|
#22
W Sunset Ave
Greensboro, MD 21639
|
1,155 sq. feet
|
1 baths 3 beds |
show details | |

|
#23
John Clark Rd
Dover, DE 19904
|
1,080 sq. feet
|
1 baths 3 beds |
show details | |

|
#24
General Torbert Dr
Milford, DE 19963
|
1,318 sq. feet
|
2 baths 3 beds |
show details | |

|
#25
Nimitz Rd
Dover, DE 19901
|
1,777 sq. feet
|
1 baths 4 beds |
show details | |

|
#26
Kenton Rd
Dover, DE 19904
|
928 sq. feet
|
1 baths 2 beds |
show details | |

|
#27
Poplar Ln
Dover, DE 19901
|
1,508 sq. feet
|
2 baths 4 beds |
show details | |

|
#28
Bradley Rd
Dover, DE 19901
|
1,472 sq. feet
|
1 baths 4 beds |
show details | |

|
#29
Eisenhower Dr
Dover, DE 19901
|
1,370 sq. feet
|
1 baths 3 beds |
show details | |

|
#30
Cannon Mill Dr
Dover, DE 19904
|
1,619 sq. feet
|
2 baths 4 beds |
show details |
| Photo | Address | Area | Beds / Baths | Price | Details |
|---|---|---|---|---|---|

|
#31
Kitts Hummock Rd
Dover, DE 19901
|
1,200 sq. feet
|
1 baths 2 beds |
show details | |

|
#32
Garfield Dr
Dover, DE 19901
|
1,810 sq. feet
|
1 baths 4 beds |
show details | |

|
#33
Acorn Ln
Dover, DE 19901
|
1,170 sq. feet
|
2 baths 3 beds |
show details | |

|
#34
Mahogany Pl
Dover, DE 19901
|
1,587 sq. feet
|
2 baths 3 beds |
show details | |

|
#35
Shadybrook Dr
Dover, DE 19901
|
1,587 sq. feet
|
2 baths 3 beds |
show details | |

|
#36
Alonzo Dr
Dover, DE 19904
|
1,548 sq. feet
|
1 baths 3 beds |
show details | |

|
#37
Woodmill Dr
Dover, DE 19904
|
1,415 sq. feet
|
2 baths 3 beds |
show details | |

|
#38
Upland Ave
Dover, DE 19901
|
792 sq. feet
|
1 baths 3 beds |
show details | |

|
#39
Ann Ave
Dover, DE 19904
|
1,512 sq. feet
|
2 baths 3 beds |
show details | |

|
#40
N West St
Dover, DE 19904
|
1,148 sq. feet
|
1 baths 3 beds |
show details |
| Photo | Address | Area | Beds / Baths | Price | Details |
|---|---|---|---|---|---|

|
#41
Carnoustie Rd
Dover, DE 19904
|
1,664 sq. feet
|
2 baths 4 beds |
show details | |

|
#42
Heritage Dr
Dover, DE 19904
|
1,980 sq. feet
|
2 baths 3 beds |
show details | |

|
#43
N West St
Dover, DE 19904
|
1,543 sq. feet
|
2 baths 2 beds |
show details | |

|
#44
Lamplighter Ln
Dover, DE 19904
|
1,188 sq. feet
|
1 baths 3 beds |
show details | |

|
#45
Forrest Ave
Dover, DE 19904
|
1,176 sq. feet
|
1 baths 3 beds |
show details | |

|
#46
Woodrow Ct
Dover, DE 19904
|
1,801 sq. feet
|
2 baths 3 beds |
show details | |

|
#47
Tucket Cir
Dover, DE 19904
|
2,100 sq. feet
|
2 baths 4 beds |
show details | |

|
#48
Midessa Ct
Dover, DE 19904
|
2,404 sq. feet
|
2 baths 3 beds |
show details | |

|
#49
Joshua Clayton Rd
Dover, DE 19904
|
1,232 sq. feet
|
1 baths 4 beds |
show details | |

|
Check over 1 million property listings on Foreclosure.com!
|
browse all offers | |||

Latest news about housing in Felton, DE collected exclusively by city-data.com from local newspapers, TV, and radio stations

 | New construction homes in delaware (73 replies) |
| Roesville Estates 55 Community - Felton DE. (109 replies) |
| What can you tell me about.... (9 replies) |
| Lost dog south of Felton (20 replies) |
| Anyone from Roesville 55+ on here? (3 replies) |
| NVHomes - Bethany Preserves (6 replies) |

Median year apartment built: 2004
Household type by relationship:
Households: 1,164- Male householders: 212 (48 living alone), Female householders: 346 (173 living alone)
225 spouses (222 opposite-sex spouses), 23 unmarried partners, (23 opposite-sex unmarried partners), 265 children (264 natural, 0 adopted, 1 stepchildren), 36 grandchildren, 3 brothers or sisters, 12 parents, 0 foster children, 26 other relatives, 12 non-relatives
Size of family households: 189 2-persons, 70 3-persons, 33 4-persons, 43 5-persons, 2 6-persons, 9 7-or-more-persons.
Size of nonfamily households: 230 1-person, 2 5-persons.
109 married couples with children.
32 single-parent households (0 men, 32 women).
96.4% of residents of Felton speak English at home.
1.3% of residents speak Spanish at home (33% speak English very well, 67% speak English well).
1.9% of residents speak other Indo-European language at home (81% speak English very well, 19% speak English well).
0.2% of residents speak Asian or Pacific Island language at home (100% speak English very well).
Foreign born population: 30 (2.6%)
(76.7% of them are naturalized citizens)
| Here: | 6.3 |
| State: | 6.9 |
| Here: | 4.3 |
| State: | 4.4 |

- Bedrooms in owner-occupied houses and condos in Felton, Delaware
- 0no bedroom
- 11 bedroom
- 142 bedrooms
- 2143 bedrooms
- 1094 bedrooms
- 75+ bedrooms

- Bedrooms in renter-occupied apartments in Felton, Delaware
- 11no bedroom
- 1041 bedroom
- 552 bedrooms
- 503 bedrooms
- 184 bedrooms
- 05+ bedrooms

- Cars and other vehicles available in Felton in owner-occupied houses/condos
- 0no vehicle
- 771 vehicle
- 1622 vehicles
- 913 vehicles
- 164 vehicles
- 05+ vehicles

- Cars and other vehicles available in Felton in renter-occupied apartments
- 24no vehicle
- 1371 vehicle
- 662 vehicles
- 43 vehicles
- 34 vehicles
- 35+ vehicles

- Rooms in owner-occupied houses in Felton, Delaware
- 01 room
- 02 rooms
- 13 rooms
- 14 rooms
- 1145 rooms
- 816 rooms
- 537 rooms
- 318 rooms
- 639+ rooms

- Rooms in renter-occupied apartments in Felton, Delaware
- 111 room
- 02 rooms
- 453 rooms
- 994 rooms
- 345 rooms
- 166 rooms
- 197 rooms
- 98 rooms
- 49+ rooms


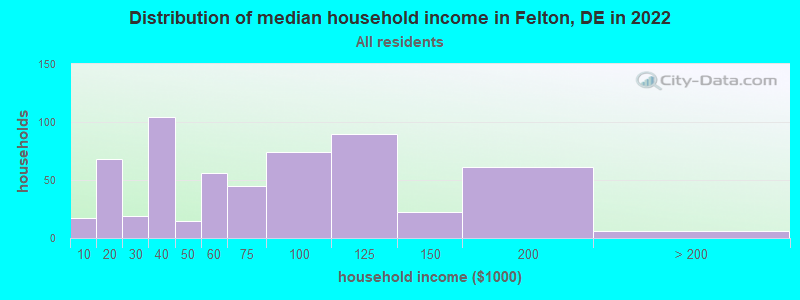
Felton, DE household income distribution

- 17Less than $10,000
- 68$10,000 to $19,999
- 19$20,000 to $29,999
- 104$30,000 to $39,999
- 15$40,000 to $49,999
- 56$50,000 to $59,999
- 45$60,000 to $74,999
- 74$75,000 to $99,999
- 90$100,000 to $124,999
- 22$125,000 to $149,999
- 61$150,000 to $199,999
- 6$200,000 or more
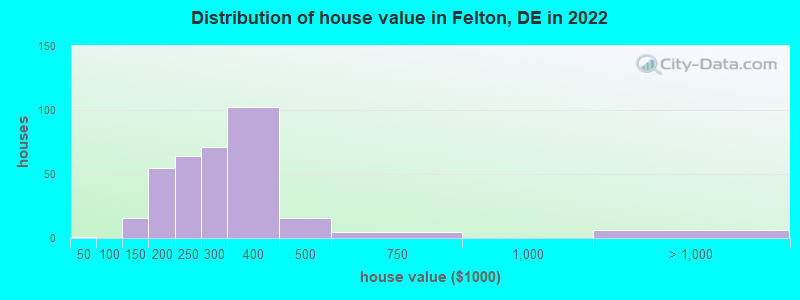
Home value of owner - occupied houses in 2022 in Felton, DE
-
- 1$25,000 to $29,999
- 11$100,000 to $124,999
- 4$125,000 to $149,999
- 4$150,000 to $174,999
- 50$175,000 to $199,999
- 63$200,000 to $249,999
- 71$250,000 to $299,999
- 102$300,000 to $399,999
- 15$400,000 to $499,999
- 4$500,000 to $749,999
- 6$1,500,000 to $1,999,999
Rent paid by renters in 2022 in Felton, DE
-
- 8$150 to $199
- 8$200 to $249
- 2$300 to $349
- 16$350 to $399
- 14$500 to $549
- 94$600 to $649
- 1$700 to $749
- 2$750 to $799
- 17$800 to $899
- 6$900 to $999
- 10$1,000 to $1,249
- 19$1,250 to $1,499
- 18$1,500 to $1,999
- 33No cash rent


Percentage of workers working in this county: 77.3%
Number of people working at home: 91 (15.3% of all workers)
Travel time to work (commute)
- Less than 5 minutes: 11
- 5 to 9 minutes: 10
- 10 to 14 minutes: 50
- 15 to 19 minutes: 84
- 20 to 24 minutes: 126
- 25 to 29 minutes: 32
- 30 to 34 minutes: 112
- 35 to 39 minutes: 12
- 40 to 44 minutes: 16
- 45 to 59 minutes: 27
- 60 to 89 minutes: 24
- 90 or more minutes: 0
Means of transportation to work:
- Drove a car alone: 307 (85.3%)
- Carpooled: 45 (12.5%)
- Walked: 2 (0.6%)
- Worked at home: 6 (1.7%)

- Unemployment by race in 2022
- Unemployment rate for White non-Hispanic residents
- 1.3%Males
- 11.5%Females

- Year of entry for the foreign-born population in Felton, Delaware
- 42010 or later
- 02000 to 2009
- 41990 to 1999
- 31980 to 1989
- 01970 to 1979
- 8Before 1970

First ancestries reported:
- Italian: 105 (15.8%)
- American: 104 (15.6%)
- English: 64 (9.6%)
- German: 36 (5.4%)
- Irish: 33 (5.0%)
- Norwegian: 11 (1.7%)
- Scotch-Irish: 11 (1.7%)
- Polish: 9 (1.4%)
- Pennsylvania German: 7 (1.1%)
- Scottish: 4 (0.6%)
- Trinidadian and Tobagonian: 3 (0.5%)
- Lebanese: 2 (0.3%)
- Eastern European: 2 (0.3%)
Most common places of birth for foreign-born residents (%):
| Felton: | 28.6% (8) |
| Delaware: | 0.9% (846) |
| Felton: | 10.7% (3) |
| Delaware: | 1.4% (1,386) |
| Felton: | 10.7% (3) |
| Delaware: | 1.1% (1,038) |
| Felton: | 7.1% (2) |
| Delaware: | 1.4% (1,388) |
| Felton: | 7.1% (2) |
| Delaware: | 1.6% (1,552) |
| Felton: | 7.1% (2) |
| Delaware: | 15.3% (14,887) |
| Felton: | 7.1% (2) |
| Delaware: | 1.4% (1,345) |
Place of birth for U.S.-born residents:
- This state: 587
- Other state: 526
- Northeast: 318
- Midwest: 25
- South: 145
- West: 43
88.0% of Felton residents lived in the same house 1 years ago.
Out of people who lived in different houses, 44.2% lived in this county.
Out of people who lived in different counties, 0.0% lived in Delaware.
| Felton: | 88.0% |
| State average: | 89.2% |
Education attainment for males 25 years and older:
- No schooling: 7
- Nursery to 4th grade: 0
- 5th and 6th grade: 0
- 7th and 8th grade: 0
- 9th grade: 1
- 10th grade: 0
- 11th grade: 0
- 12th grade, no diploma: 3
- High school graduate (or equivalency): 119
- Less than 1 year of college: 11
- Some college more than 1 year, no degree: 75
- Associate degree: 32
- Bachelor's degree: 43
- Master's degree: 48
- Professional school degree: 0
- Doctorate degree: 7

Education attainment for females 25 years and older:
- No schooling: 13
- Nursery to 4th grade: 0
- 5th and 6th grade: 0
- 7th and 8th grade: 1
- 9th grade: 3
- 10th grade: 4
- 11th grade: 24
- 12th grade, no diploma: 4
- High school graduate (or equivalency): 185
- Less than 1 year of college: 34
- Some college more than 1 year, no degree: 87
- Associate degree: 35
- Bachelor's degree: 59
- Master's degree: 56
- Professional school degree: 3
- Doctorate degree: 0


Housing units in structures:
- One, detached: 415
- One, attached: 11
- 3 or 4: 45
- 5 to 9: 36
- 10 to 19: 6
- 20 to 49: 64
- Mobile homes: 4
- Boats, RVs, vans, etc.: 3
Housing units lacking complete kitchen facilities in 2022: 0.5%
House/condo owner moved in on average 12 years ago
Renter moved in on average 6 years ago

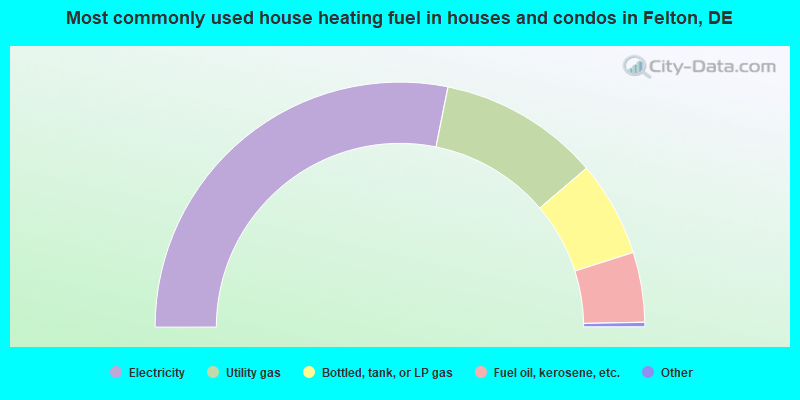
- 56.7%Electricity
- 21.4%Utility gas
- 12.7%Bottled, tank, or LP gas
- 9.3%Fuel oil, kerosene, etc.
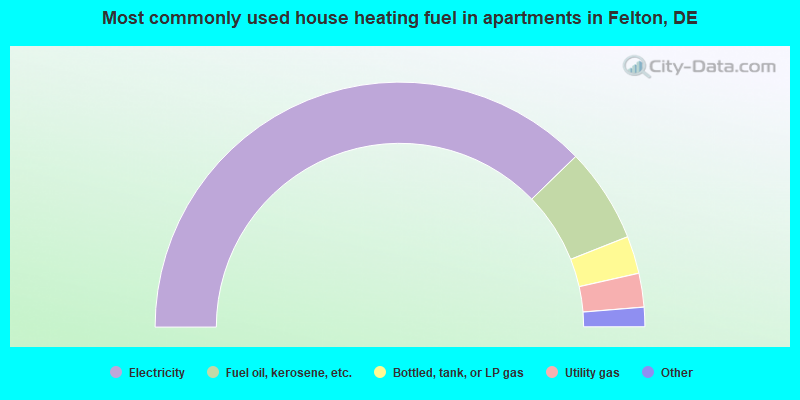
- 76.1%Electricity
- 12.6%Fuel oil, kerosene, etc.
- 5.0%Bottled, tank, or LP gas
- 4.5%Utility gas
- 1.4%No fuel used
- 0.5%Wood
Private vs. public school enrollment:
| Here: | 14.7% |
| Delaware: | 11.5% |
| Here: | 0.0% |
| Delaware: | 12.1% |
| Here: | 7.4% |
| Delaware: | 19.2% |


