Ferndale, WA (Washington) Houses and Residents
| Ferndale: | $542,979 |
| Washington: | $569,500 |
Total population: 12,704 (Urban population: 8,433 (272 inside urbanized areas, 8,161 inside urban clusters), Rural population: 380 (all nonfarm))
Houses: 5,810 (5,350 occupied: 3,534 owner occupied, 1,851 renter occupied)
| % of renters here: | 34% |
| State: | 36% |
Housing density: 935 houses/condos per square mile
Median price asked for vacant for-sale houses and condos in 2022: $678,358.
Median contract rent in 2022: $1,305 (lower quartile is $1,097, upper quartile is $1,577)
Median rent asked for vacant for-rent units in 2022: $1,406
Median gross rent in Ferndale, WA in 2022: $1,395
Housing units in Ferndale with a mortgage: 2,777 (297 second mortgage, 0 home equity loan, 238 both second mortgage and home equity loan)
Houses without a mortgage: 0
Median household income for houses/condos with a mortgage: $106,702
Median household income for apartments without a mortgage: $67,249
Median monthly housing costs: $1,558
Compare current foreclosures near Ferndale, WA:
| Photo | Address | Area | Beds / Baths | Price | Details |
|---|---|---|---|---|---|

|
#1
Glenmore St
Ferndale, WA 98248
|
- sq. feet
|
2 baths 3 beds |
show details | |

|
#2
Glenmore St
Ferndale, WA 98248
|
2,177 sq. feet
|
3 baths 4 beds |
show details | |

|
#3
N Enterprise Rd
Ferndale, WA 98248
|
1,008 sq. feet
|
1 baths 6 beds |
show details | |

|
#4
Timmerman Ln
Ferndale, WA 98248
|
672 sq. feet
|
2 baths 4 beds |
show details | |

|
#5
Harksell Rd
Ferndale, WA 98248
|
1,801 sq. feet
|
2 baths 4 beds |
show details | |

|
#6
Thor Pl
Ferndale, WA 98248
|
1,072 sq. feet
|
1 baths 3 beds |
show details | |

|
#7
Enterprise Rd, Trlr 16
Ferndale, WA 98248
|
1,248 sq. feet
|
1 baths 3 beds |
show details | |

|
#8
Cedar St
Ferndale, WA 98248
|
2,462 sq. feet
|
2 baths 4 beds |
show details | |

|
#9
Kickerville Rd
Ferndale, WA 98248
|
1,496 sq. feet
|
1 baths 1 beds |
show details | |

|
#10
Meadow Crescent St
Ferndale, WA 98248
|
1,738 sq. feet
|
2 baths 3 beds |
show details |
| Photo | Address | Area | Beds / Baths | Price | Details |
|---|---|---|---|---|---|

|
#11
Ferndale Ter
Ferndale, WA 98248
|
1,398 sq. feet
|
1 baths 3 beds |
show details | |

|
#12
Ryan Dr
Ferndale, WA 98248
|
856 sq. feet
|
1 baths 3 beds |
show details | |

|
#13
Douglas Rd, Trlr 31
Ferndale, WA 98248
|
1,604 sq. feet
|
2 baths 3 beds |
show details | |

|
#14
Grandview Rd
Ferndale, WA 98248
|
1,232 sq. feet
|
1 baths 3 beds |
show details | |

|
#15
Washington St # 7
Ferndale, WA 98248
|
- sq. feet
|
- baths - beds |
show details | |

|
#16
Cedar St # 102
Ferndale, WA 98248
|
- sq. feet
|
- baths - beds |
show details | |

|
#17
Angelina St
Ferndale, WA 98248
|
- sq. feet
|
- baths - beds |
show details | |

|
#18
Legoe Ave # 7
Ferndale, WA 98248
|
- sq. feet
|
- baths - beds |
show details | |

|
#19
N Star Rd
Ferndale, WA 98248
|
- sq. feet
|
- baths - beds |
show details | |

|
#20
Labounty Rd # 304
Ferndale, WA 98248
|
- sq. feet
|
- baths - beds |
show details |
| Photo | Address | Area | Beds / Baths | Price | Details |
|---|---|---|---|---|---|

|
#21
Douglas Rd
Ferndale, WA 98248
|
- sq. feet
|
- baths - beds |
show details | |

|
#22
Woodlyn Rd
Ferndale, WA 98248
|
- sq. feet
|
- baths - beds |
show details | |

|
#23
W Wiser Lake Rd
Ferndale, WA 98248
|
- sq. feet
|
- baths - beds |
show details | |

|
#24
Kiwi Dr
Ferndale, WA 98248
|
- sq. feet
|
- baths - beds |
show details | |

|
#25
4th Ave Unit 963
Ferndale, WA 98248
|
- sq. feet
|
- baths - beds |
show details | |

|
#26
Sunnybrook Ln # 202
Ferndale, WA 98248
|
- sq. feet
|
- baths - beds |
show details | |

|
#27
Calico Loop
Ferndale, WA 98248
|
- sq. feet
|
- baths - beds |
show details | |

|
#28
Chehalis Rd
Blaine, WA 98230
|
1,488 sq. feet
|
2 baths 3 beds |
show details | |

|
#29
15th St
Bellingham, WA 98225
|
2,970 sq. feet
|
2 baths 3 beds |
show details | |

|
#30
W Pole Rd
Lynden, WA 98264
|
1,248 sq. feet
|
1 baths 2 beds |
show details |
| Photo | Address | Area | Beds / Baths | Price | Details |
|---|---|---|---|---|---|

|
#31
Marigold Dr Unit 36
Bellingham, WA 98229
|
460 sq. feet
|
1 baths 1 beds |
show details | |

|
#32
Crestline Dr
Bellingham, WA 98229
|
1,358 sq. feet
|
2 baths 4 beds |
show details | |

|
#33
Salish Rd
Blaine, WA 98230
|
1,188 sq. feet
|
2 baths 3 beds |
show details | |

|
#34
Undine St
Bellingham, WA 98226
|
1,664 sq. feet
|
1 baths 2 beds |
show details | |

|
#35
Flynn St Spc 51
Bellingham, WA 98229
|
784 sq. feet
|
1 baths 2 beds |
show details | |

|
#36
Leeside Dr
Blaine, WA 98230
|
1,344 sq. feet
|
2 baths 3 beds |
show details | |

|
#37
Buttercup Dr
Lynden, WA 98264
|
1,182 sq. feet
|
2 baths 3 beds |
show details | |

|
#38
Valencia St
Bellingham, WA 98226
|
888 sq. feet
|
1 baths 3 beds |
show details | |

|
#39
Sutton Dr
Everson, WA 98247
|
1,330 sq. feet
|
1 baths 3 beds |
show details | |

|
#40
Michigan St # A
Bellingham, WA 98229
|
2,472 sq. feet
|
2 baths 2 beds |
show details |
| Photo | Address | Area | Beds / Baths | Price | Details |
|---|---|---|---|---|---|

|
#41
Westhills Pl
Bellingham, WA 98226
|
3,114 sq. feet
|
2 baths 3 beds |
show details | |

|
#42
N Grace Ln
Bellingham, WA 98226
|
2,220 sq. feet
|
2 baths 3 beds |
show details | |

|
#43
Everson Goshen Rd
Bellingham, WA 98226
|
2,021 sq. feet
|
2 baths 3 beds |
show details | |

|
#44
Glenning St
Lynden, WA 98264
|
1,332 sq. feet
|
1 baths 2 beds |
show details | |

|
#45
S State St Apt 416
Bellingham, WA 98225
|
815 sq. feet
|
1 baths 1 beds |
show details | |

|
#46
Ellis St
Bellingham, WA 98225
|
952 sq. feet
|
2 baths 2 beds |
show details | |

|
#47
Lincoln St Unit 123
Bellingham, WA 98229
|
784 sq. feet
|
1 baths 2 beds |
show details | |

|
#48
Otis St
Bellingham, WA 98225
|
726 sq. feet
|
1 baths 2 beds |
show details | |

|
#49
Irving St
Bellingham, WA 98225
|
1,140 sq. feet
|
1 baths 3 beds |
show details | |

|
Check over 1 million property listings on Foreclosure.com!
|
browse all offers | |||

Latest news about housing in Ferndale, WA collected exclusively by city-data.com from local newspapers, TV, and radio stations


Median year apartment built: 2002
Household type by relationship:
Households: 15,407- Male householders: 2,708 (340 living alone), Female householders: 2,565 (662 living alone)
2,904 spouses (2,879 opposite-sex spouses), 460 unmarried partners, (455 opposite-sex unmarried partners), 5,239 children (4,578 natural, 242 adopted, 418 stepchildren), 246 grandchildren, 76 brothers or sisters, 164 parents, 46 foster children, 518 other relatives, 442 non-relatives
- In group quarters: 33
Size of family households: 1,243 2-persons, 637 3-persons, 1,098 4-persons, 564 5-persons, 184 6-persons, 9 7-or-more-persons.
Size of nonfamily households: 1,139 1-person, 277 2-persons, 67 3-persons, 40 4-persons.
3,045 married couples with children.
773 single-parent households (102 men, 671 women).
79.7% of residents of Ferndale speak English at home.
7.5% of residents speak Spanish at home (72% speak English very well, 9% speak English well, 12% speak English not well, 7% don't speak English at all).
9.9% of residents speak other Indo-European language at home (63% speak English very well, 31% speak English well, 6% speak English not well).
1.6% of residents speak Asian or Pacific Island language at home (30% speak English very well, 37% speak English well, 33% speak English not well).
1.0% of residents speak other language at home (100% speak English very well).
Foreign born population: 2,347 (15.2%)
(75.8% of them are naturalized citizens)
| Here: | 6.2 |
| State: | 6.5 |
| Here: | 3.4 |
| State: | 3.9 |

- Bedrooms in owner-occupied houses and condos in Ferndale, Washington
- 20no bedroom
- 641 bedroom
- 4942 bedrooms
- 1,9583 bedrooms
- 7564 bedrooms
- 2425+ bedrooms

- Bedrooms in renter-occupied apartments in Ferndale, Washington
- 166no bedroom
- 2661 bedroom
- 7662 bedrooms
- 5533 bedrooms
- 624 bedrooms
- 365+ bedrooms

- Cars and other vehicles available in Ferndale in owner-occupied houses/condos
- 68no vehicle
- 6991 vehicle
- 1,3402 vehicles
- 9793 vehicles
- 2854 vehicles
- 1645+ vehicles

- Cars and other vehicles available in Ferndale in renter-occupied apartments
- 330no vehicle
- 5551 vehicle
- 8092 vehicles
- 903 vehicles
- 674 vehicles
- 05+ vehicles

- Rooms in owner-occupied houses in Ferndale, Washington
- 01 room
- 472 rooms
- 1333 rooms
- 2824 rooms
- 8525 rooms
- 6786 rooms
- 6617 rooms
- 4298 rooms
- 4529+ rooms

- Rooms in renter-occupied apartments in Ferndale, Washington
- 1661 room
- 1702 rooms
- 5523 rooms
- 2604 rooms
- 4915 rooms
- 886 rooms
- 337 rooms
- 248 rooms
- 679+ rooms


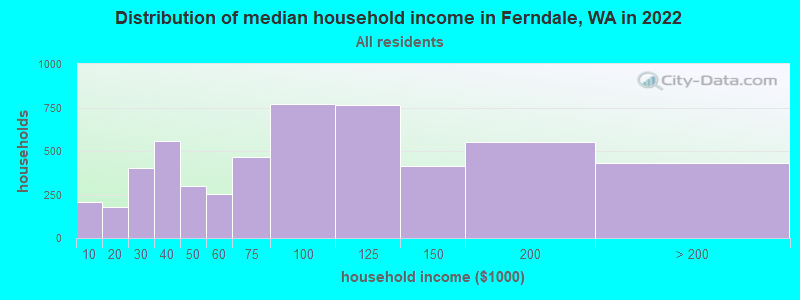
Ferndale, WA household income distribution

- 205Less than $10,000
- 178$10,000 to $19,999
- 404$20,000 to $29,999
- 559$30,000 to $39,999
- 297$40,000 to $49,999
- 254$50,000 to $59,999
- 467$60,000 to $74,999
- 769$75,000 to $99,999
- 766$100,000 to $124,999
- 414$125,000 to $149,999
- 550$150,000 to $199,999
- 431$200,000 or more
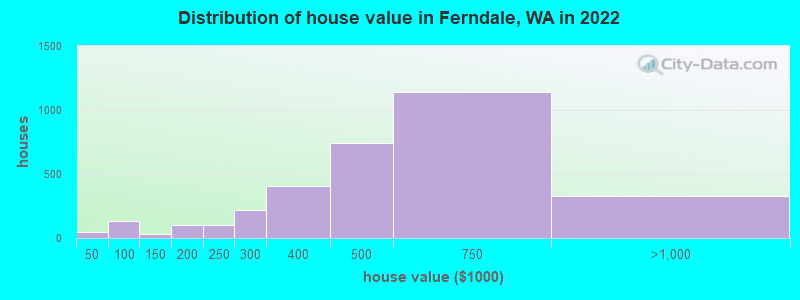
Home value of owner - occupied houses in 2022 in Ferndale, WA
-
- 22$30,000 to $34,999
- 21$40,000 to $49,999
- 18$50,000 to $59,999
- 25$60,000 to $69,999
- 13$70,000 to $79,999
- 30$80,000 to $89,999
- 24$90,000 to $99,999
- 30$125,000 to $149,999
- 62$150,000 to $174,999
- 42$175,000 to $199,999
- 98$200,000 to $249,999
- 220$250,000 to $299,999
- 410$300,000 to $399,999
- 743$400,000 to $499,999
- 1,138$500,000 to $749,999
- 312$750,000 to $999,999
- 13$1,000,000 to $1,499,999
Rent paid by renters in 2022 in Ferndale, WA
-
- 49$400 to $449
- 6$550 to $599
- 19$650 to $699
- 70$700 to $749
- 33$750 to $799
- 40$800 to $899
- 128$900 to $999
- 454$1,000 to $1,249
- 405$1,250 to $1,499
- 266$1,500 to $1,999
- 59$2,000 to $2,499
- 15$2,500 to $2,999
- 27$3,000 to $3,499
- 128$3,500 or more
- 31No cash rent


Percentage of workers working in this county: 95.4%
Number of people working at home: 1,002 (13.6% of all workers)
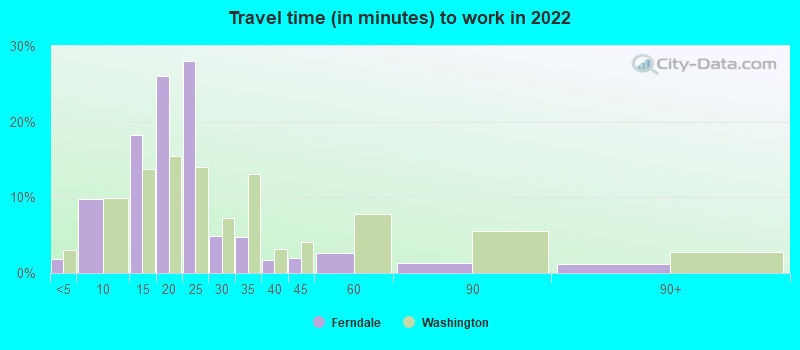
Travel time to work (commute)
- Less than 5 minutes: 110
- 5 to 9 minutes: 530
- 10 to 14 minutes: 1,060
- 15 to 19 minutes: 1,699
- 20 to 24 minutes: 1,852
- 25 to 29 minutes: 329
- 30 to 34 minutes: 313
- 35 to 39 minutes: 275
- 40 to 44 minutes: 7
- 45 to 59 minutes: 117
- 60 to 89 minutes: 144
- 90 or more minutes: 161
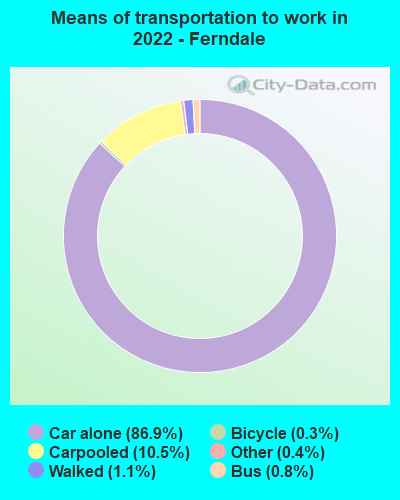
Means of transportation to work:
- Drove a car alone: 5,587 (73.6%)
- Carpooled: 754 (9.9%)
- Bus: 36 (0.5%)
- Taxi: 24 (0.3%)
- Bicycle: 16 (0.2%)
- Walked: 95 (1.3%)
- Worked at home: 1,002 (13.2%)

- Unemployment by race in 2022
- Unemployment rate for White non-Hispanic residents
- 3.6%Males
- 2.2%Females
- Unemployment rate for American Indian and Alaska Native residents
- 23.6%Females

- Year of entry for the foreign-born population in Ferndale, Washington
- 8592010 or later
- 4922000 to 2009
- 4171990 to 1999
- 4031980 to 1989
- 811970 to 1979
- 175Before 1970

First ancestries reported:
- German: 1,110 (16.2%)
- European: 473 (6.9%)
- English: 421 (6.1%)
- American: 280 (4.1%)
- Scottish: 215 (3.1%)
- Irish: 214 (3.1%)
- Norwegian: 193 (2.8%)
- Lebanese: 187 (2.7%)
- Russian: 165 (2.4%)
- Icelander: 164 (2.4%)
- Dutch: 141 (2.1%)
- Italian: 130 (1.9%)
- Afghan: 100 (1.5%)
- Polish: 92 (1.3%)
- Canadian: 77 (1.1%)
- Northern European: 77 (1.1%)
- Iranian: 63 (0.9%)
- French Canadian: 51 (0.7%)
- Palestinian: 50 (0.7%)
- Scotch-Irish: 45 (0.7%)
- Scandinavian: 29 (0.4%)
- Macedonian: 27 (0.4%)
- French: 26 (0.4%)
- Welsh: 21 (0.3%)
- Belgian: 19 (0.3%)
- Swedish: 17 (0.2%)
- Finnish: 14 (0.2%)
- Danish: 14 (0.2%)
- Portuguese: 13 (0.2%)
- Ethiopian: 13 (0.2%)
- Czech: 11 (0.2%)
- Lithuanian: 11 (0.2%)
- Eastern European: 8 (0.1%)
- British: 6 (0.09%)
Most common places of birth for foreign-born residents (%):
| Ferndale: | 13.2% (299) |
| Washington: | 8.9% (101,353) |
| Ferndale: | 9.5% (214) |
| Washington: | 0.2% (2,424) |
| Ferndale: | 8.4% (191) |
| Washington: | 1.9% (21,540) |
| Ferndale: | 8.2% (185) |
| Washington: | 21.1% (241,655) |
| Ferndale: | 6.8% (153) |
| Washington: | 1.2% (13,855) |
| Ferndale: | 6.5% (147) |
| Washington: | 4.1% (47,238) |
| Ferndale: | 5.8% (131) |
| Washington: | 5.4% (62,003) |
| Ferndale: | 5.7% (130) |
| Washington: | 0.6% (6,500) |
| Ferndale: | 5.4% (121) |
| Washington: | 0.6% (6,294) |
| Ferndale: | 5.0% (114) |
| Washington: | 0.5% (5,851) |
| Ferndale: | 3.3% (74) |
| Washington: | 0.2% (2,031) |
| Ferndale: | 2.8% (64) |
| Washington: | 0.9% (10,499) |
| Ferndale: | 1.9% (43) |
| Washington: | 0.4% (4,951) |
Place of birth for U.S.-born residents:
- This state: 8,647
- Other state: 4,052
- Northeast: 504
- Midwest: 674
- South: 345
- West: 2,507
89.7% of Ferndale residents lived in the same house 1 years ago.
Out of people who lived in different houses, 43.7% lived in this county.
Out of people who lived in different counties, 14.8% lived in Washington.
| Ferndale: | 89.7% |
| State average: | 85.2% |
Education attainment for males 25 years and older:
- No schooling: 112
- Nursery to 4th grade: 0
- 5th and 6th grade: 75
- 7th and 8th grade: 0
- 9th grade: 6
- 10th grade: 48
- 11th grade: 17
- 12th grade, no diploma: 28
- High school graduate (or equivalency): 1,106
- Less than 1 year of college: 345
- Some college more than 1 year, no degree: 754
- Associate degree: 490
- Bachelor's degree: 1,218
- Master's degree: 372
- Professional school degree: 41
- Doctorate degree: 15

Education attainment for females 25 years and older:
- No schooling: 57
- Nursery to 4th grade: 0
- 5th and 6th grade: 160
- 7th and 8th grade: 0
- 9th grade: 0
- 10th grade: 35
- 11th grade: 39
- 12th grade, no diploma: 24
- High school graduate (or equivalency): 1,039
- Less than 1 year of college: 685
- Some college more than 1 year, no degree: 1,060
- Associate degree: 379
- Bachelor's degree: 1,053
- Master's degree: 784
- Professional school degree: 20
- Doctorate degree: 203


Housing units in structures:
- One, detached: 3,662
- One, attached: 182
- Two: 59
- 3 or 4: 379
- 5 to 9: 263
- 10 to 19: 77
- 20 to 49: 751
- 50 or more: 159
- Mobile homes: 274
Median worth of mobile homes: $170,170
House/condo owner moved in on average 8 years ago
Renter moved in on average 3 years ago

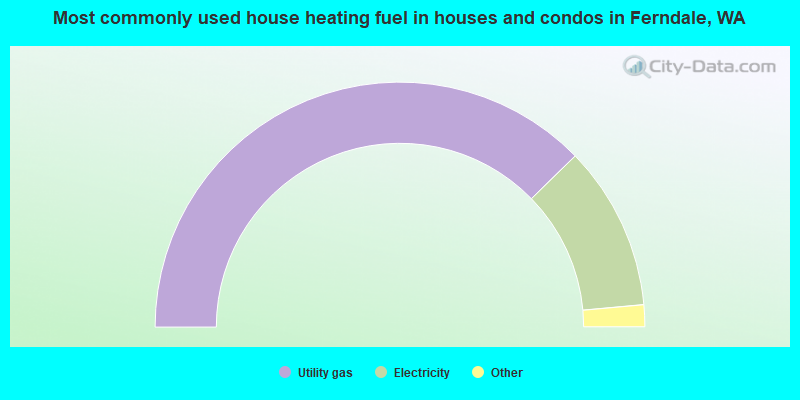
- 75.4%Utility gas
- 21.7%Electricity
- 1.8%Bottled, tank, or LP gas
- 0.4%Solar energy
- 0.4%Wood
- 0.3%No fuel used
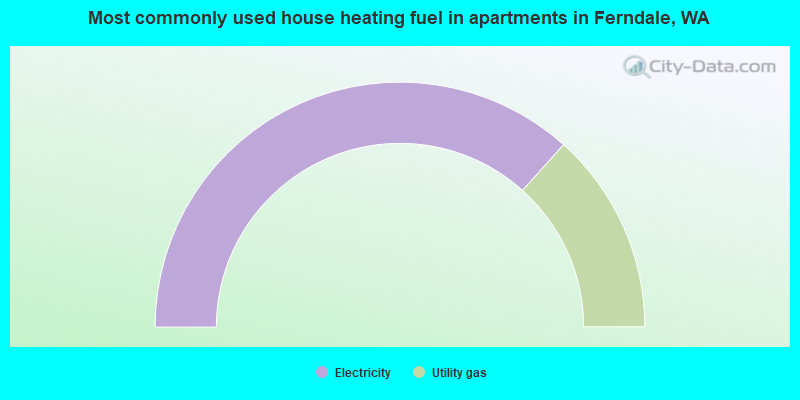
- 73.3%Electricity
- 26.7%Utility gas
Private vs. public school enrollment:
| Here: | 24.4% |
| Washington: | 12.4% |
| Here: | 5.7% |
| Washington: | 9.2% |
| Here: | 5.5% |
| Washington: | 16.5% |


