Median price asked for vacant for-sale houses and condos in 2022 in this county: $203,919.
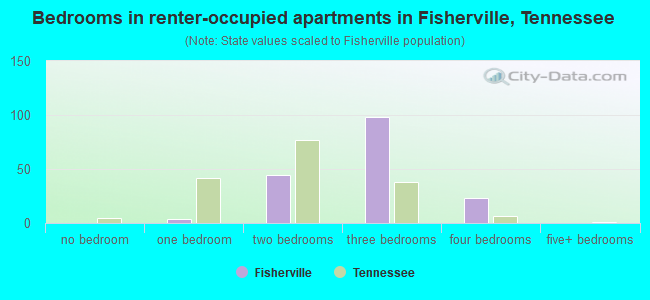
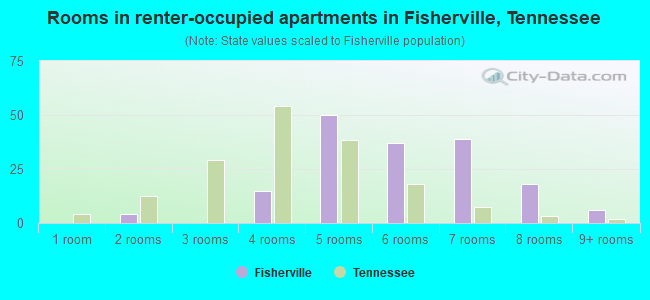
Median contract rent in 2022: $619 (lower quartile is $571, upper quartile is $1,001)
Median rent asked for vacant for-rent units in 2022: $980
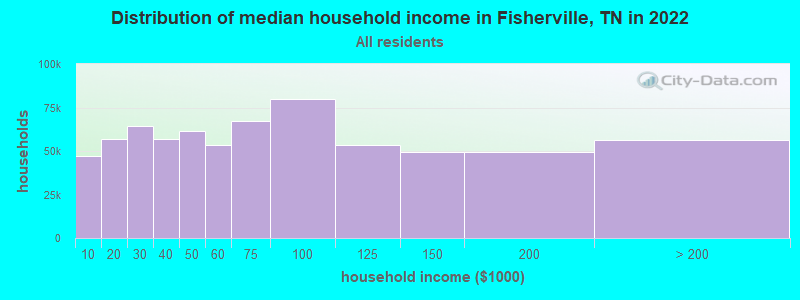
Median gross rent in Fisherville, TN in 2022: $1,001
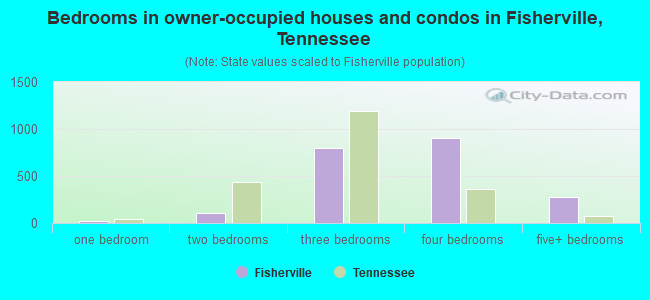
Housing units in Fisherville with a mortgage: 1,533 (201 second mortgage, 199 home equity loan, 0 both second mortgage and home equity loan) Houses without a mortgage: 327
Compare current foreclosures near Fisherville, TN:
In family households: 763,349 (130,277 male householders, 101,130 female householders)
135,865 spouses, 288,562 children (268,691 natural, 6,442 adopted, 13,429 stepchildren), 34,868 grandchildren, 15,859 brothers or sisters, 9,522 parents, foster children, 20,027 other relatives, 22,996 non-relatives
In nonfamily households: 145,966 (55,407 male householders (43,999 living alone)), 64,157 female householders (55,496 living alone)), 26,402 nonrelatives
In group quarters: 18,329 (11,592 institutionalized population)
126,592 married couples with children.
88,773 single-parent households (11,723 men, 77,050 women).
94.4% of residents of Fisherville speak English at home.
1.9% of residents speak Spanish at home (93% speak English very well, 7% speak English well).
2.2% of residents speak other Indo-European language at home (68% speak English very well, 32% speak English well).
1.5% of residents speak Asian or Pacific Island language at home (39% speak English very well, 43% speak English well, 8% speak English not well, 10% don't speak English at all).
Foreign born population: 331 (4.8%)
(52.0% of them are naturalized citizens)
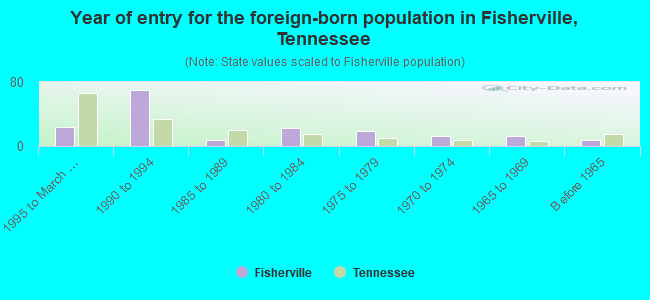
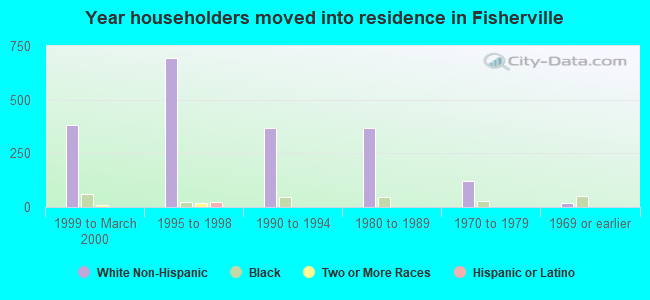
Year of entry for the foreign-born population in Fisherville, Tennessee
241995 to March 2000
701990 to 1994
71985 to 1989
221980 to 1984
191975 to 1979
121970 to 1974
121965 to 1969
7Before 1965
Most common places of birth for foreign-born residents (%):
Cambodia
Fisherville:
19.1% (33)
Tennessee:
0.7% (1,046)
China, excluding Hong Kong and Taiwan
Fisherville:
15.6% (27)
Tennessee:
2.7% (4,288)
United Kingdom
Fisherville:
12.1% (21)
Tennessee:
3.6% (5,726)
Poland
Fisherville:
9.8% (17)
Tennessee:
0.6% (1,012)
Mexico
Fisherville:
9.2% (16)
Tennessee:
28.1% (44,682)
Iran
Fisherville:
8.7% (15)
Tennessee:
1.1% (1,694)
Netherlands
Fisherville:
6.9% (12)
Tennessee:
0.4% (599)
Czechoslovakia (includes Czech Republic and Slovakia)
Fisherville:
5.8% (10)
Tennessee:
0.3% (504)
Russia
Fisherville:
5.2% (9)
Tennessee:
1.1% (1,705)
Brazil
Fisherville:
4.0% (7)
Tennessee:
0.5% (766)
Germany
Fisherville:
3.5% (6)
Tennessee:
5.2% (8,316)
Place of birth for U.S.-born residents:
This state: 4,131
Other state: 2,407
Northeast: 220
Midwest: 505
South: 1,445
West: 237
50% of Fisherville residents lived in the same house 5 years ago. Out of people who lived in different houses, 69% lived in this county. Out of people who lived in different counties, 21% lived in Tennessee.
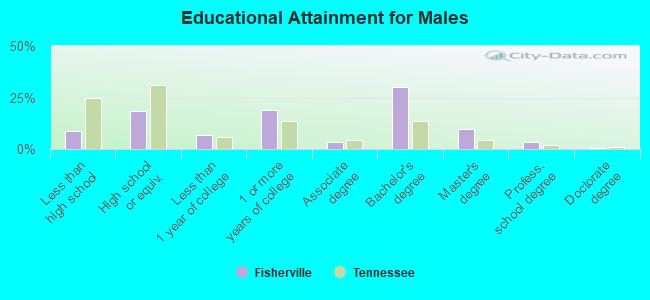
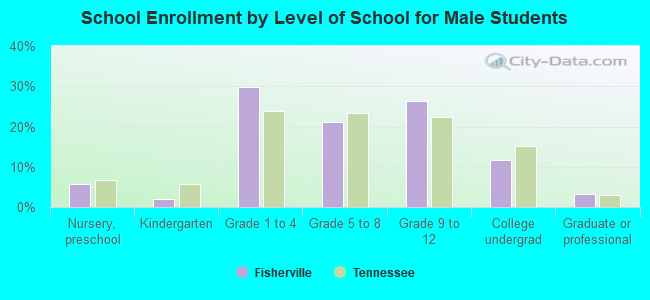
Education attainment for males 25 years and older:
No schooling: 8
Nursery to 4th grade: 0
5th and 6th grade: 23
7th and 8th grade: 57
9th grade: 11
10th grade: 41
11th grade: 26
12th grade, no diploma: 21
High school graduate (or equivalency): 387
Less than 1 year of college: 146
Some college more than 1 year, no degree: 396
Associate degree: 71
Bachelor's degree: 626
Master's degree: 199
Professional school degree: 72
Doctorate degree: 11
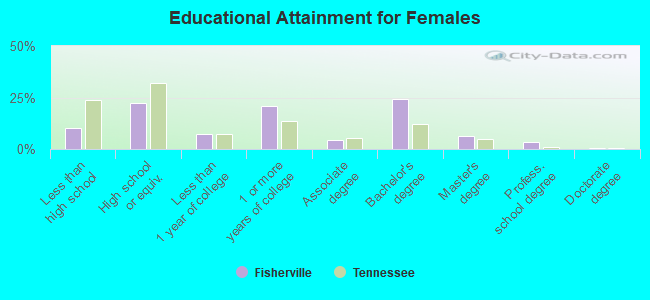
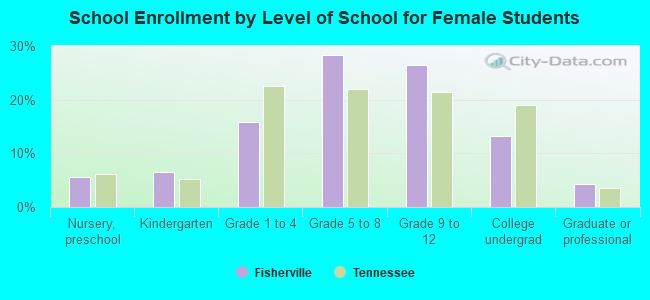
Education attainment for females 25 years and older:
No schooling: 7
Nursery to 4th grade: 7
5th and 6th grade: 0
7th and 8th grade: 49
9th grade: 9
10th grade: 76
11th grade: 31
12th grade, no diploma: 51
High school graduate (or equivalency): 503
Less than 1 year of college: 159
Some college more than 1 year, no degree: 473
Associate degree: 95
Bachelor's degree: 549
Master's degree: 146
Professional school degree: 79
Doctorate degree: 15
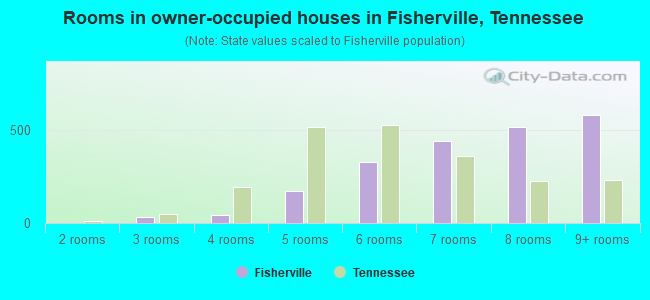
Housing units in structures:
One, detached: 2,375
One, attached: 29
Mobile homes: 28
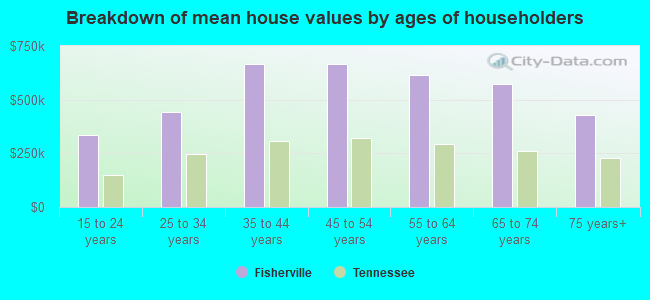
Median worth of mobile homes: $488,490
Housing units lacking complete plumbing facilities: 0.2%
Housing units lacking complete kitchen facilities: 0.2%