Forest Oaks, NC (North Carolina) Houses and Residents
| Forest Oaks: | $315,867 |
| North Carolina: | $280,600 |
Mean price in 2022:
Detached houses: $346,311
Here: $346,311 State: $375,326 Townhouses or other attached units: $349,898
Here: $349,898 State: $317,935
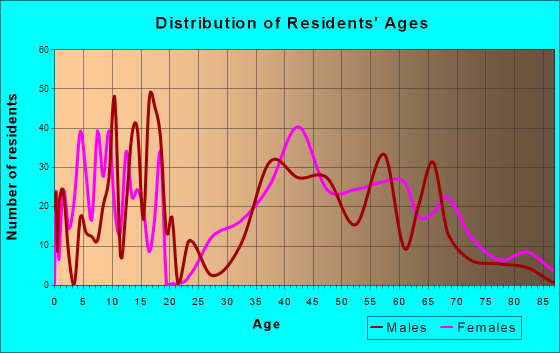
Total population: 3,890 (Urban population: 2,283, Rural population: 913 (all nonfarm))
Houses: 1,606 (1,569 occupied: 1,450 owner occupied, 146 renter occupied)
| % of renters here: | 9% |
| State: | 33% |
Housing density: 317 houses/condos per square mile
Median price asked for vacant for-sale houses and condos in 2022 in this county: $274,337.
Median contract rent in 2022: $1,695
Median gross rent in Forest Oaks, NC in 2022: $1,757
Housing units in Forest Oaks with a mortgage: 916 (185 second mortgage, 0 home equity loan, 192 both second mortgage and home equity loan)
Houses without a mortgage: 67
Median household income for houses/condos with a mortgage: $119,921
Median household income for apartments without a mortgage: $97,893
Median monthly housing costs: $1,347
Compare current foreclosures near Forest Oaks, NC:
| Photo | Address | Area | Beds / Baths | Price | Details |
|---|---|---|---|---|---|

|
#1
Waldridge Ct
Greensboro, NC 27406
|
2,496 sq. feet
|
3 baths 4 beds |
show details | |

|
#2
Rotherwood Rd
Greensboro, NC 27406
|
1,763 sq. feet
|
2 baths 2 beds |
show details | |

|
#3
Friendly Chapel Rd
Greensboro, NC 27406
|
1,704 sq. feet
|
2 baths 3 beds |
show details | |

|
#4
Spring St
Greensboro, NC 27405
|
1,064 sq. feet
|
1 baths 3 beds |
show details | |

|
#5
Village Ln Unit K
Greensboro, NC 27409
|
1,156 sq. feet
|
1 baths 2 beds |
show details | |

|
#6
Maple Branch Dr
High Point, NC 27265
|
3,450 sq. feet
|
3 baths 4 beds |
show details | |

|
#7
Spicewood Dr
Greensboro, NC 27405
|
1,188 sq. feet
|
1 baths 3 beds |
show details | |

|
#8
Elmwood Dr
Greensboro, NC 27408
|
2,370 sq. feet
|
2 baths 4 beds |
show details | |

|
#9
Larson St
Greensboro, NC 27407
|
800 sq. feet
|
1 baths 2 beds |
show details | |

|
#10
Walker Ave
Greensboro, NC 27403
|
1,568 sq. feet
|
2 baths 3 beds |
show details |
| Photo | Address | Area | Beds / Baths | Price | Details |
|---|---|---|---|---|---|

|
#11
Oakville Ct
Mc Leansville, NC 27301
|
2,840 sq. feet
|
3 baths 5 beds |
show details | |

|
#12
Circleview Dr
Greensboro, NC 27406
|
2,052 sq. feet
|
2 baths 3 beds |
show details | |

|
#13
Blazingwood Ct
Greensboro, NC 27406
|
1,189 sq. feet
|
2 baths 3 beds |
show details | |

|
#14
Millcroft Rd
Pleasant Garden, NC 27313
|
3,571 sq. feet
|
4 baths 5 beds |
show details | |

|
#15
Running Mead Rd
Pleasant Garden, NC 27313
|
1,710 sq. feet
|
2 baths 3 beds |
show details | |

|
#16
Hiddenlake Dr
Browns Summit, NC 27214
|
2,160 sq. feet
|
2 baths 3 beds |
show details | |

|
#17
Hunt Chase Dr
Greensboro, NC 27407
|
1,319 sq. feet
|
2 baths 3 beds |
show details | |

|
#18
Nevit Ln
Franklinville, NC 27248
|
1,864 sq. feet
|
2 baths 3 beds |
show details | |

|
#19
Hillside Dr
Burlington, NC 27215
|
800 sq. feet
|
1 baths 2 beds |
show details | |

|
#20
Sagamore Dr
Greensboro, NC 27410
|
2,370 sq. feet
|
2 baths 4 beds |
show details |
| Photo | Address | Area | Beds / Baths | Price | Details |
|---|---|---|---|---|---|

|
#21
Dukes Hollow Ct
High Point, NC 27265
|
3,086 sq. feet
|
3 baths 4 beds |
show details | |

|
#22
E Lexington Ave
High Point, NC 27262
|
1,008 sq. feet
|
2 baths 3 beds |
show details | |

|
#23
Briar Run Dr
Greensboro, NC 27405
|
2,243 sq. feet
|
2 baths 4 beds |
show details | |

|
#24
Wakerobin Ct
Greensboro, NC 27407
|
1,484 sq. feet
|
2 baths 3 beds |
show details | |

|
#25
Flowering Path Ln
Greensboro, NC 27405
|
1,738 sq. feet
|
2 baths 4 beds |
show details | |

|
#26
Hawthorn Ridge Dr
Whitsett, NC 27377
|
2,062 sq. feet
|
2 baths 4 beds |
show details | |

|
#27
Sherwood Dr
Burlington, NC 27215
|
1,531 sq. feet
|
1 baths 3 beds |
show details | |

|
#28
Dolphin Rd
Greensboro, NC 27406
|
1,520 sq. feet
|
1 baths 3 beds |
show details | |

|
#29
Hines Chapel Rd
Mc Leansville, NC 27301
|
1,262 sq. feet
|
2 baths 4 beds |
show details | |

|
#30
Boulding Ave
High Point, NC 27265
|
1,140 sq. feet
|
2 baths 3 beds |
show details |
| Photo | Address | Area | Beds / Baths | Price | Details |
|---|---|---|---|---|---|

|
#31
Holders Rd
Greensboro, NC 27405
|
1,700 sq. feet
|
2 baths 3 beds |
show details | |

|
#32
Blue Rock Ct
Greensboro, NC 27405
|
1,456 sq. feet
|
2 baths 4 beds |
show details | |

|
#33
Heritage Creek Way
Greensboro, NC 27405
|
1,696 sq. feet
|
2 baths 3 beds |
show details | |

|
#34
Waterstone Loop
High Point, NC 27265
|
1,176 sq. feet
|
2 baths 2 beds |
show details | |

|
#35
Lucas Ave
Greensboro, NC 27405
|
924 sq. feet
|
1 baths 1 beds |
show details | |

|
#36
Whitley Way
Greensboro, NC 27407
|
1,274 sq. feet
|
2 baths 3 beds |
show details | |

|
#37
Saddlegate Ct
Greensboro, NC 27407
|
1,339 sq. feet
|
2 baths 3 beds |
show details | |

|
#38
Irving Park Ln
Greensboro, NC 27455
|
2,000 sq. feet
|
2 baths 3 beds |
show details | |

|
#39
Shadygrove Ln
Greensboro, NC 27407
|
3,388 sq. feet
|
3 baths 3 beds |
show details | |

|
#40
Bruin Ct
Greensboro, NC 27405
|
1,584 sq. feet
|
2 baths 3 beds |
show details |
| Photo | Address | Area | Beds / Baths | Price | Details |
|---|---|---|---|---|---|

|
#41
Dodson S B
Greensboro, NC 27405
|
1,104 sq. feet
|
2 baths 3 beds |
show details | |

|
#42
Eagle Perch Way
Greensboro, NC 27407
|
1,658 sq. feet
|
2 baths 2 beds |
show details | |

|
#43
Cedar Knoll Dr
Greensboro, NC 27407
|
1,216 sq. feet
|
2 baths 2 beds |
show details | |

|
#44
Wynnewood Dr
Greensboro, NC 27408
|
4,151 sq. feet
|
3 baths 5 beds |
show details | |

|
#45
Bruton Pl S
Greensboro, NC 27410
|
2,538 sq. feet
|
2 baths 3 beds |
show details | |

|
#46
Mountain Brook Rd
Greensboro, NC 27455
|
4,828 sq. feet
|
3 baths 5 beds |
show details | |

|
#47
Saint Simons Sq
Greensboro, NC 27408
|
3,229 sq. feet
|
3 baths 4 beds |
show details | |

|
#48
Panarama Dr
Greensboro, NC 27405
|
2,766 sq. feet
|
2 baths 4 beds |
show details | |

|
#49
Huffine Mill Rd
Mc Leansville, NC 27301
|
1,776 sq. feet
|
1 baths 6 beds |
show details | |

|
Check over 1 million property listings on Foreclosure.com!
|
browse all offers | |||


 | Muirfield Village Vs Forest Oaks Townhomes in Durham (1 reply) |
| Triad’s recent Economic Bonanza likely to make Housing go Boom (15 replies) |
| Houses for Rent (2 replies) |
| Just moved to Greensboro, still house hunting (6 replies) |
| Toyota-Mazda Plant Coming to the Triad? (203 replies) |
| Where To Move To Now? (19 replies) |
Median year apartment built: 1948
Household type by relationship:
Households: 4,194- Male householders: 885 (76 living alone), Female householders: 673 (177 living alone)
1,233 spouses (1,233 opposite-sex spouses), 21 unmarried partners, (21 opposite-sex unmarried partners), 1,114 children (1,024 natural, 90 adopted, 0 stepchildren), 91 grandchildren, 20 brothers or sisters, 61 parents, 0 foster children, 53 other relatives, 39 non-relatives
Size of family households: 699 2-persons, 217 3-persons, 288 4-persons, 84 5-persons, 14 6-persons.
Size of nonfamily households: 262 1-person, 27 2-persons.
674 married couples with children.
11 single-parent households (0 men, 11 women).
98.4% of residents of Forest Oaks speak English at home.
0.4% of residents speak Asian or Pacific Island language at home (100% speak English well).
Foreign born population: 83 (2.0%)
(24.1% of them are naturalized citizens)
| Here: | 8.2 |
| State: | 6.4 |
| Here: | 7.3 |
| State: | 4.4 |

- Bedrooms in owner-occupied houses and condos in Forest Oaks, North Carolina
- 48no bedroom
- 151 bedroom
- 792 bedrooms
- 5693 bedrooms
- 5484 bedrooms
- 1935+ bedrooms

- Bedrooms in renter-occupied apartments in Forest Oaks, North Carolina
- 0no bedroom
- 01 bedroom
- 02 bedrooms
- 1463 bedrooms
- 04 bedrooms
- 05+ bedrooms

- Cars and other vehicles available in Forest Oaks in owner-occupied houses/condos
- 85no vehicle
- 1801 vehicle
- 6352 vehicles
- 3363 vehicles
- 1954 vehicles
- 205+ vehicles

- Cars and other vehicles available in Forest Oaks in renter-occupied apartments
- 0no vehicle
- 1021 vehicle
- 322 vehicles
- 123 vehicles
- 04 vehicles
- 05+ vehicles

- Rooms in owner-occupied houses in Forest Oaks, North Carolina
- 481 room
- 02 rooms
- 153 rooms
- 524 rooms
- 315 rooms
- 1216 rooms
- 3237 rooms
- 1898 rooms
- 6739+ rooms

- Rooms in renter-occupied apartments in Forest Oaks, North Carolina
- 01 room
- 02 rooms
- 03 rooms
- 04 rooms
- 05 rooms
- 126 rooms
- 957 rooms
- 228 rooms
- 179+ rooms


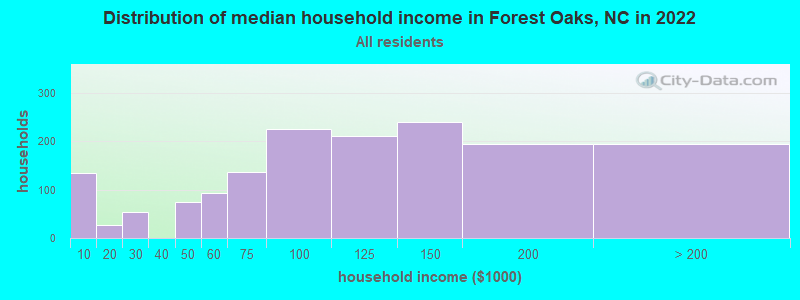
Forest Oaks, NC household income distribution

- 134Less than $10,000
- 26$10,000 to $19,999
- 54$20,000 to $29,999
- 74$40,000 to $49,999
- 93$50,000 to $59,999
- 137$60,000 to $74,999
- 225$75,000 to $99,999
- 211$100,000 to $124,999
- 240$125,000 to $149,999
- 195$150,000 to $199,999
- 195$200,000 or more
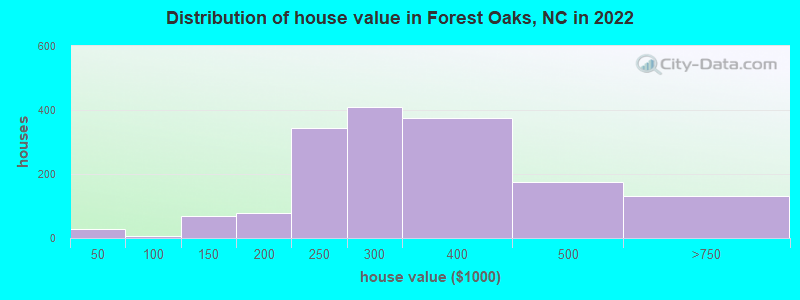
Home value of owner - occupied houses in 2022 in Forest Oaks, NC
-
- 27$25,000 to $29,999
- 6$50,000 to $59,999
- 48$100,000 to $124,999
- 21$125,000 to $149,999
- 53$150,000 to $174,999
- 23$175,000 to $199,999
- 343$200,000 to $249,999
- 410$250,000 to $299,999
- 373$300,000 to $399,999
- 175$400,000 to $499,999
- 130$500,000 to $749,999
Rent paid by renters in 2022 in Forest Oaks, NC
-
- 27$200 to $249
- 14$1,000 to $1,249
- 27$1,250 to $1,499
- 155$1,500 to $1,999
- 8No cash rent


Percentage of workers working in this county: 81.3%
Number of people working at home: 264 (13.6% of all workers)
Travel time to work (commute)
- Less than 5 minutes: 0
- 5 to 9 minutes: 257
- 10 to 14 minutes: 191
- 15 to 19 minutes: 34
- 20 to 24 minutes: 362
- 25 to 29 minutes: 335
- 30 to 34 minutes: 364
- 35 to 39 minutes: 33
- 40 to 44 minutes: 14
- 45 to 59 minutes: 87
- 60 to 89 minutes: 0
- 90 or more minutes: 0
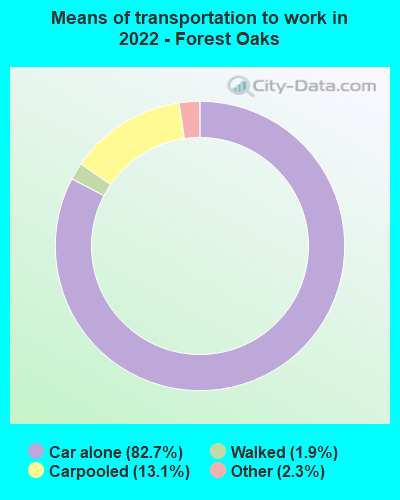
Means of transportation to work:
- Drove a car alone: 544 (62.3%)
- Carpooled: 74 (8.5%)
- Taxi: 21 (2.4%)
- Walked: 13 (1.5%)
- Worked at home: 512 (58.6%)


- Year of entry for the foreign-born population in Forest Oaks, North Carolina
- 42010 or later
- 212000 to 2009
- 551990 to 1999
- 111980 to 1989
- 01970 to 1979
- 34Before 1970

First ancestries reported:
- American: 516 (24.6%)
- English: 373 (17.8%)
- Irish: 150 (7.2%)
- German: 100 (4.8%)
- French: 63 (3.0%)
- Scotch-Irish: 60 (2.9%)
- European: 42 (2.0%)
- African: 35 (1.7%)
- British: 34 (1.6%)
- Eastern European: 34 (1.6%)
- French Canadian: 30 (1.4%)
- Welsh: 23 (1.1%)
- Italian: 16 (0.8%)
- Norwegian: 14 (0.7%)
- Scottish: 14 (0.7%)
- Polish: 12 (0.6%)
Most common places of birth for foreign-born residents (%):
| Forest Oaks: | 65.1% (56) |
| North Carolina: | 1.2% (10,140) |
| Forest Oaks: | 15.1% (13) |
| North Carolina: | 0.2% (1,923) |
| Forest Oaks: | 11.6% (10) |
| North Carolina: | 1.8% (15,988) |
| Forest Oaks: | 4.7% (4) |
| North Carolina: | 3.2% (27,477) |
Place of birth for U.S.-born residents:
- This state: 2,136
- Other state: 1,943
- Northeast: 620
- Midwest: 383
- South: 835
- West: 99
89.6% of Forest Oaks residents lived in the same house 1 years ago.
Out of people who lived in different houses, 25.5% lived in this county.
Out of people who lived in different counties, 26.5% lived in North Carolina.
| Forest Oaks: | 89.6% |
| State average: | 87.3% |
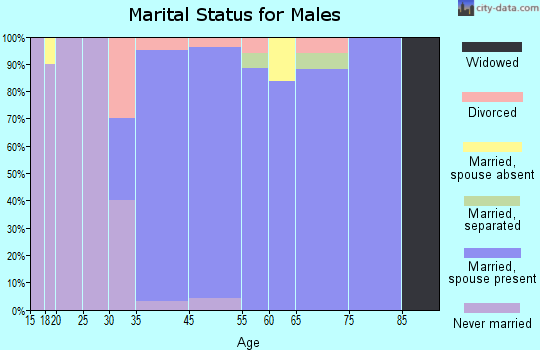
Education attainment for males 25 years and older:
- No schooling: 0
- Nursery to 4th grade: 0
- 5th and 6th grade: 0
- 7th and 8th grade: 0
- 9th grade: 0
- 10th grade: 9
- 11th grade: 0
- 12th grade, no diploma: 0
- High school graduate (or equivalency): 245
- Less than 1 year of college: 83
- Some college more than 1 year, no degree: 197
- Associate degree: 201
- Bachelor's degree: 475
- Master's degree: 143
- Professional school degree: 80
- Doctorate degree: 33

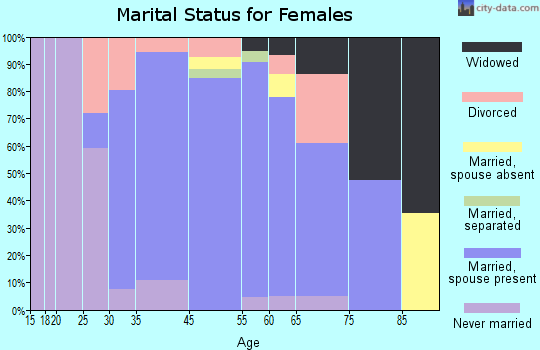
Education attainment for females 25 years and older:
- No schooling: 0
- Nursery to 4th grade: 0
- 5th and 6th grade: 0
- 7th and 8th grade: 0
- 9th grade: 0
- 10th grade: 0
- 11th grade: 13
- 12th grade, no diploma: 9
- High school graduate (or equivalency): 287
- Less than 1 year of college: 119
- Some college more than 1 year, no degree: 199
- Associate degree: 183
- Bachelor's degree: 567
- Master's degree: 251
- Professional school degree: 88
- Doctorate degree: 0

Housing units in structures:
- One, detached: 1,448
- One, attached: 157
House/condo owner moved in on average 14 years ago
Renter moved in on average 6 years ago

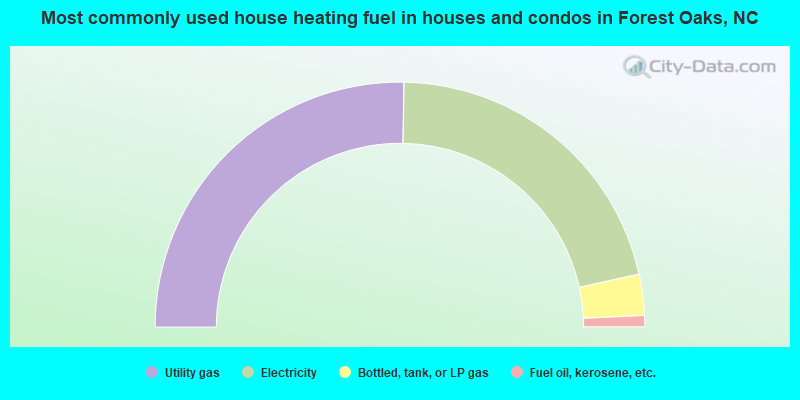
- 50.5%Utility gas
- 42.5%Electricity
- 5.4%Bottled, tank, or LP gas
- 1.5%Fuel oil, kerosene, etc.
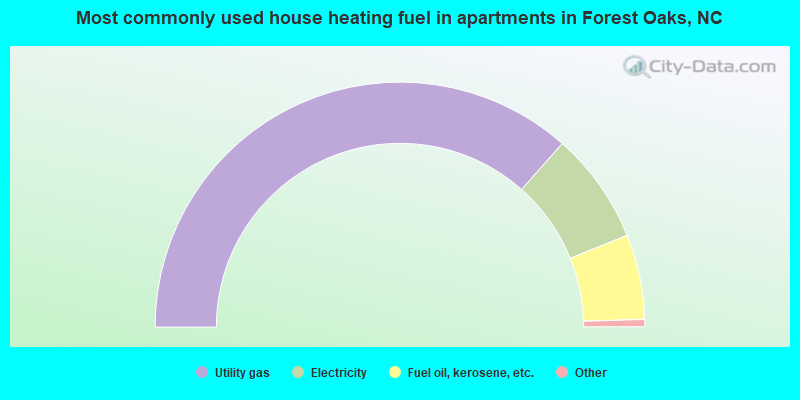
- 73.8%Utility gas
- 14.9%Electricity
- 11.3%Fuel oil, kerosene, etc.
Private vs. public school enrollment:
| Here: | 32.2% |
| North Carolina: | 13.8% |
| Here: | 12.8% |
| North Carolina: | 11.9% |
| Here: | 0.0% |
| North Carolina: | 19.3% |


