Housing density: 254 houses/condos per square mile
Median price asked for vacant for-sale houses and condos in 2022 in this county: $170,846.
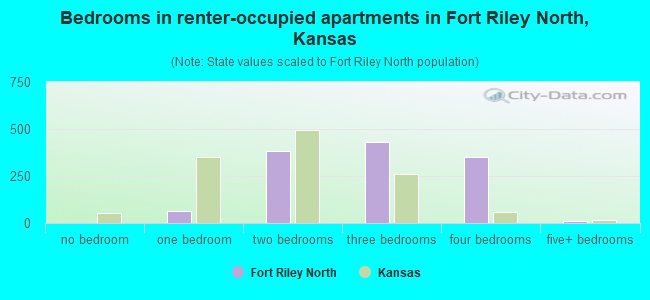
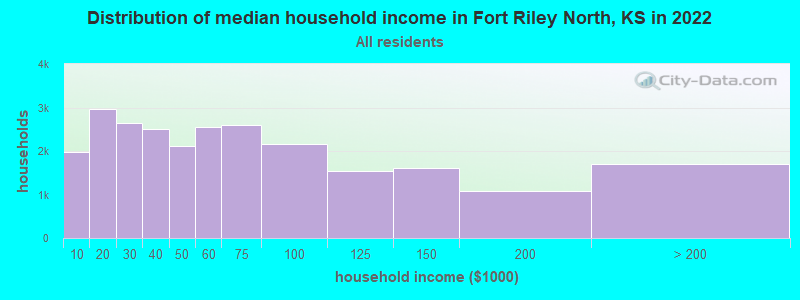
Median contract rent in 2022: $891 (lower quartile is $868, upper quartile is $1,025)
Median rent asked for vacant for-rent units in 2022: $1,233
Median gross rent in Fort Riley North, KS in 2022: $925
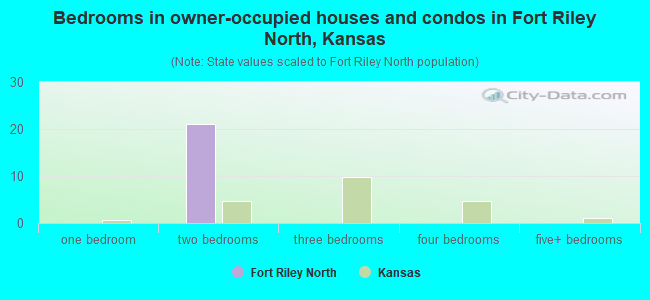
Housing units in Fort Riley North with a mortgage: 0 (0 second mortgage, 0 home equity loan, 0 both second mortgage and home equity loan) Houses without a mortgage: 7
Compare current foreclosures near Fort Riley North, KS:
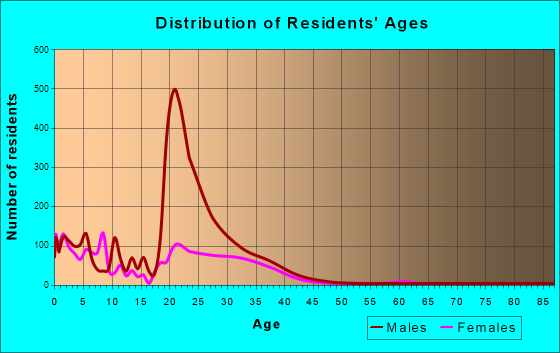
In family households: 42,024 (9,815 male householders, 4,195 female householders)
10,823 spouses, 14,296 children (13,010 natural, 386 adopted, 900 stepchildren), 452 grandchildren, 580 brothers or sisters, 229 parents, foster children, 368 other relatives, 1,088 non-relatives
In nonfamily households: 19,964 (6,096 male householders (3,441 living alone)), 5,690 female householders (3,640 living alone)), 8,178 nonrelatives
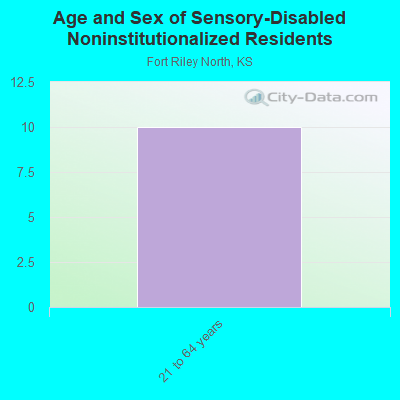
In group quarters: 9,127 (450 institutionalized population)
9,321 married couples with children.
1,922 single-parent households (342 men, 1,580 women).
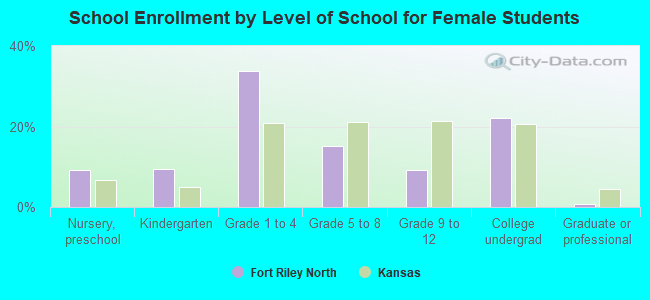
81.3% of residents of Fort Riley North speak English at home.
10.9% of residents speak Spanish at home (78% speak English very well, 18% speak English well, 3% speak English not well, 1% don't speak English at all).
5.9% of residents speak other Indo-European language at home (85% speak English very well, 6% speak English well, 9% speak English not well).
1.6% of residents speak Asian or Pacific Island language at home (49% speak English very well, 51% speak English well).
0.2% of residents speak other language at home (100% speak English very well).
Foreign born population: 628 (7.0%)
(30.4% of them are naturalized citizens)
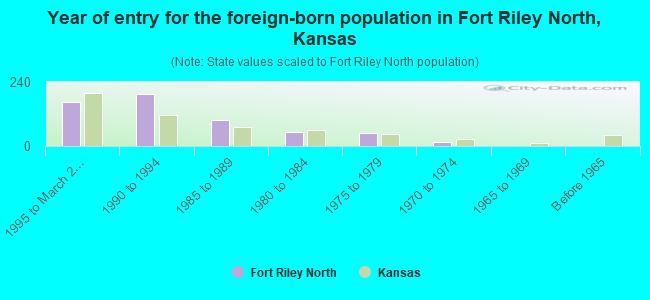
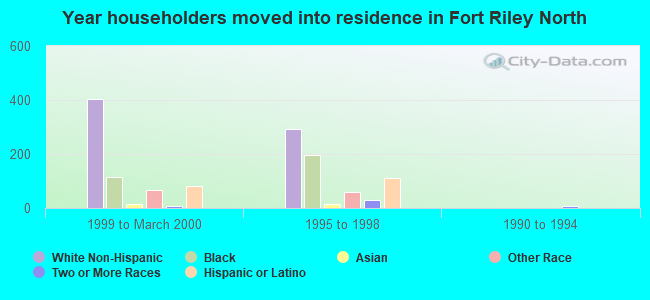
Year of entry for the foreign-born population in Fort Riley North, Kansas
1651995 to March 2000
1961990 to 1994
991985 to 1989
521980 to 1984
471975 to 1979
161970 to 1974
01965 to 1969
0Before 1965
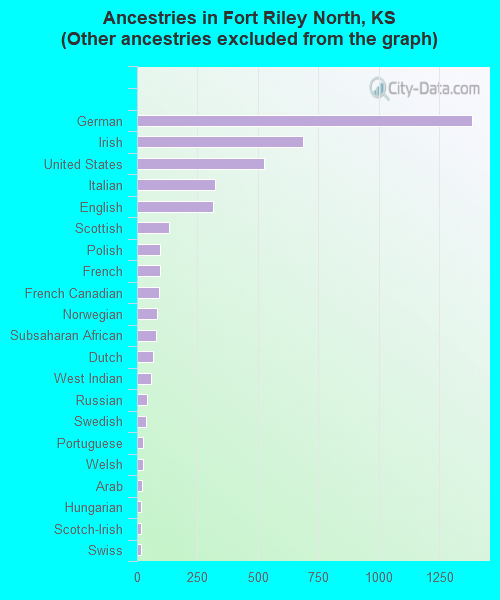
First ancestries reported:
Other: 3,559 (46.1%)
German: 1,386 (18.0%)
Irish: 688 (8.9%)
United States: 523 (6.8%)
Italian: 322 (4.2%)
English: 314 (4.1%)
Scottish: 131 (1.7%)
Polish: 95 (1.2%)
French: 94 (1.2%)
French Canadian: 91 (1.2%)
Norwegian: 82 (1.1%)
Subsaharan African: 80 (1.0%)
Dutch: 65 (0.8%)
West Indian: 58 (0.8%)
Russian: 43 (0.6%)
Swedish: 36 (0.5%)
Portuguese: 26 (0.3%)
Welsh: 23 (0.3%)
Arab: 20 (0.3%)
Hungarian: 18 (0.2%)
Scotch-Irish: 18 (0.2%)
Swiss: 18 (0.2%)
Greek: 10 (0.1%)
Czech: 9 (0.1%)
Ukrainian: 9 (0.1%)
Most common places of birth for foreign-born residents (%):
Germany
Fort Riley North:
36.9% (212)
Kansas:
3.7% (4,953)
Mexico
Fort Riley North:
13.4% (77)
Kansas:
47.0% (63,358)
Philippines
Fort Riley North:
9.9% (57)
Kansas:
2.0% (2,717)
Korea
Fort Riley North:
5.2% (30)
Kansas:
2.6% (3,553)
Peru
Fort Riley North:
5.0% (29)
Kansas:
0.4% (538)
United Kingdom
Fort Riley North:
3.3% (19)
Kansas:
2.1% (2,849)
El Salvador
Fort Riley North:
3.3% (19)
Kansas:
1.8% (2,378)
Ecuador
Fort Riley North:
3.3% (19)
Kansas:
0.2% (261)
Panama
Fort Riley North:
3.0% (17)
Kansas:
0.3% (419)
Ireland
Fort Riley North:
2.3% (13)
Kansas:
0.3% (348)
Venezuela
Fort Riley North:
1.9% (11)
Kansas:
0.2% (335)
Vietnam
Fort Riley North:
1.6% (9)
Kansas:
6.8% (9,105)
Trinidad and Tobago
Fort Riley North:
1.6% (9)
Kansas:
0.1% (145)
Other Caribbean
Fort Riley North:
1.6% (9)
Kansas:
0.1% (127)
Place of birth for U.S.-born residents:
This state: 626
Other state: 6,177
Northeast: 691
Midwest: 1,538
South: 2,725
West: 1,223
11% of Fort Riley North residents lived in the same house 5 years ago. Out of people who lived in different houses, 1% lived in this county. Out of people who lived in different counties, 6% lived in Kansas.
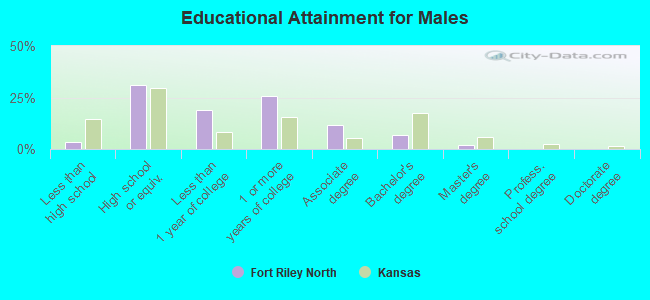
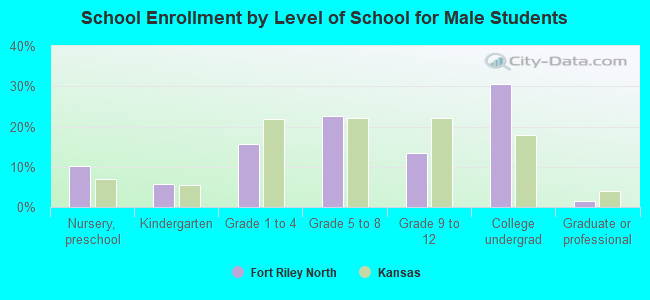
Education attainment for males 25 years and older:
No schooling: 10
Nursery to 4th grade: 0
5th and 6th grade: 0
7th and 8th grade: 0
9th grade: 0
10th grade: 0
11th grade: 5
12th grade, no diploma: 46
High school graduate (or equivalency): 537
Less than 1 year of college: 328
Some college more than 1 year, no degree: 449
Associate degree: 205
Bachelor's degree: 121
Master's degree: 34
Professional school degree: 0
Doctorate degree: 0
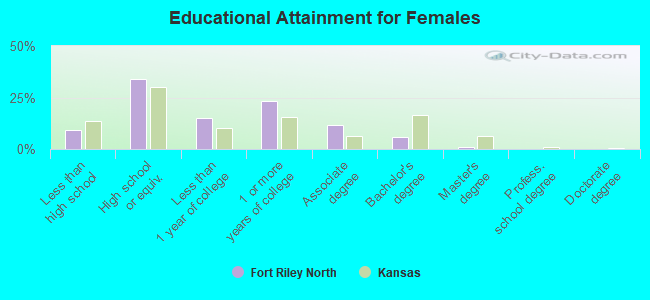
Education attainment for females 25 years and older:
No schooling: 0
Nursery to 4th grade: 0
5th and 6th grade: 7
7th and 8th grade: 10
9th grade: 9
10th grade: 6
11th grade: 16
12th grade, no diploma: 41
High school graduate (or equivalency): 336
Less than 1 year of college: 149
Some college more than 1 year, no degree: 230
Associate degree: 115
Bachelor's degree: 58
Master's degree: 9
Professional school degree: 0
Doctorate degree: 0
Housing units in structures:
One, detached: 95
One, attached: 537
Two: 36
3 or 4: 127
5 to 9: 485
10 to 19: 14
Mobile homes: 7
Housing units lacking complete plumbing facilities: 0.6%
Housing units lacking complete kitchen facilities: 0.6%