Housing density: 2,193 houses/condos per square mile
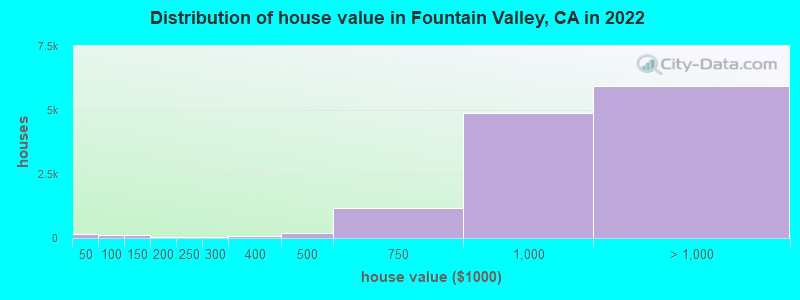
Median price asked for vacant for-sale houses and condos in 2022: $600,887.
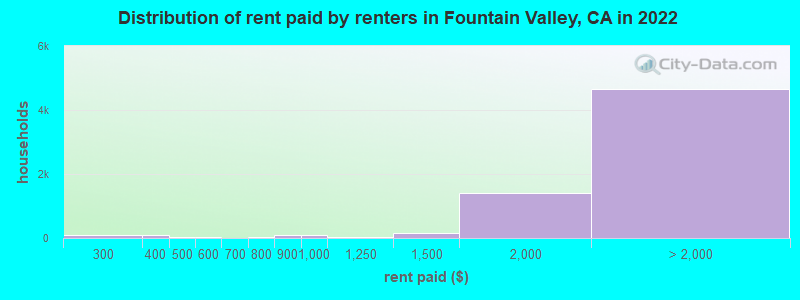
Median contract rent in 2022: over $2,000 (lower quartile is $1,838, upper quartile is over $2,000)
Median rent asked for vacant for-rent units in 2022: $2,818
Median gross rent in Fountain Valley, CA in 2022: over $2,000
Housing units in Fountain Valley with a mortgage: 7,497 (977 second mortgage, 28 home equity loan, 839 both second mortgage and home equity loan) Houses without a mortgage: 66
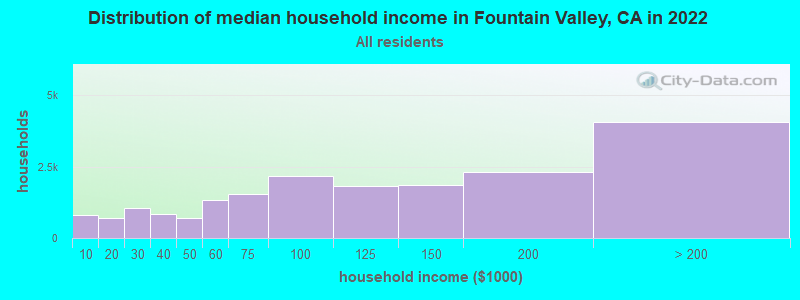
Median household income for houses/condos with a mortgage: $150,110
Median household income for apartments without a mortgage: $103,372
Median monthly housing costs: $2,248
Compare current foreclosures near Fountain Valley, CA:
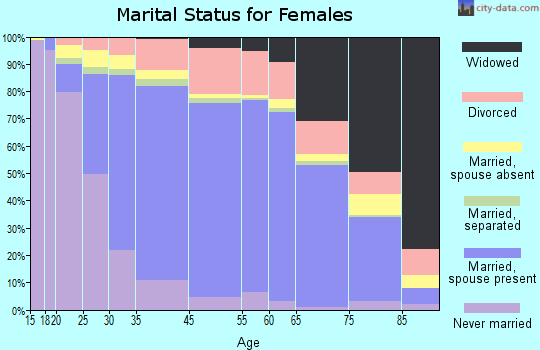
6,502 married couples with children.
1,910 single-parent households (767 men, 1,143 women).
53.7% of residents of Fountain Valley speak English at home.
9.0% of residents speak Spanish at home (76% speak English very well, 15% speak English well, 7% speak English not well, 2% don't speak English at all).
3.1% of residents speak other Indo-European language at home (64% speak English very well, 21% speak English well, 8% speak English not well, 6% don't speak English at all).
31.3% of residents speak Asian or Pacific Island language at home (53% speak English very well, 26% speak English well, 18% speak English not well, 3% don't speak English at all).
2.9% of residents speak other language at home (74% speak English very well, 21% speak English well, 5% speak English not well).
Foreign born population: 18,360 (32.6%)
(74.9% of them are naturalized citizens)
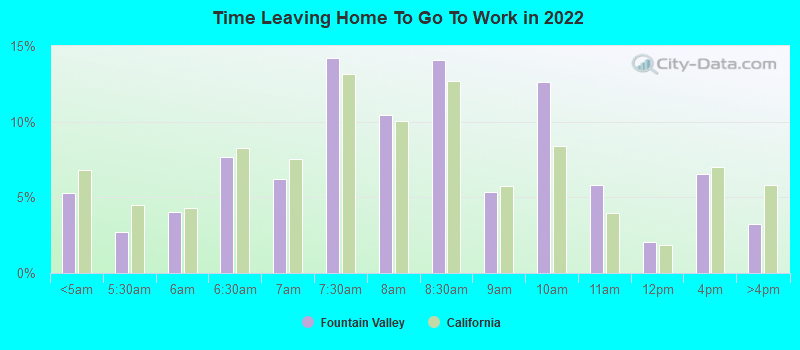
Percentage of workers working in this county: 88.3% Number of people working at home: 3,852 (14.1% of all workers)
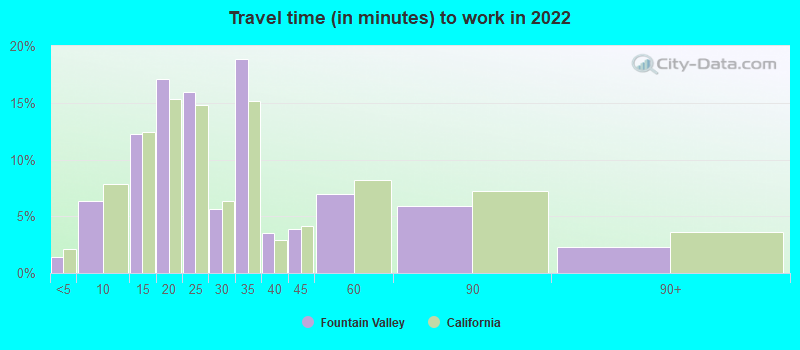
Travel time to work (commute)
Less than 5 minutes: 305
5 to 9 minutes: 1,267
10 to 14 minutes: 3,215
15 to 19 minutes: 4,721
20 to 24 minutes: 4,092
25 to 29 minutes: 1,574
30 to 34 minutes: 4,056
35 to 39 minutes: 700
40 to 44 minutes: 791
45 to 59 minutes: 1,067
60 to 89 minutes: 1,176
90 or more minutes: 348
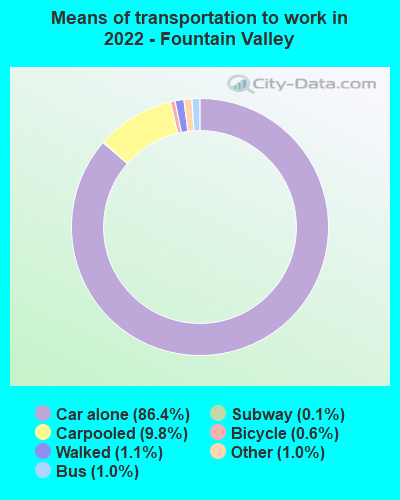
Means of transportation to work:
Drove a car alone: 21,360 (73.6%)
Carpooled: 2,623 (9.0%)
Bus: 231 (0.8%)
Long-distance train or commuter rail: 25 (0.1%)
Taxi: 278 (1.0%)
Bicycle: 167 (0.6%)
Walked: 260 (0.9%)
Worked at home: 3,852 (13.3%)
Unemployment by race in 2022
Unemployment rate for White non-Hispanic residents
5.5%Males
4.9%Females
Unemployment rate for Black residents
48.4%Females
Unemployment rate for Asian residents
6.5%Males
1.6%Females
Unemployment rate for other race residents
2.8%Males
Unemployment rate for two or more race residents
5.8%Males
5.0%Females
Unemployment rate for Hispanic or Latino residents
3.7%Males
2.4%Females
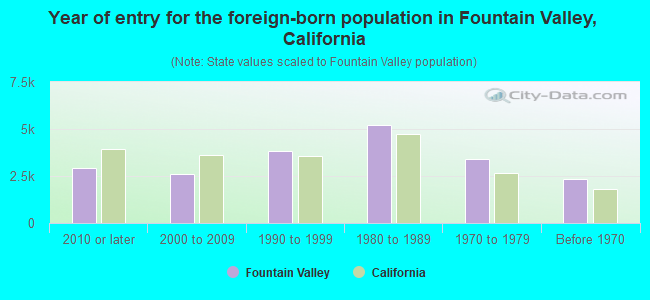
Year of entry for the foreign-born population in Fountain Valley, California
2,9072010 or later
2,5812000 to 2009
3,8411990 to 1999
5,2021980 to 1989
3,4131970 to 1979
2,315Before 1970
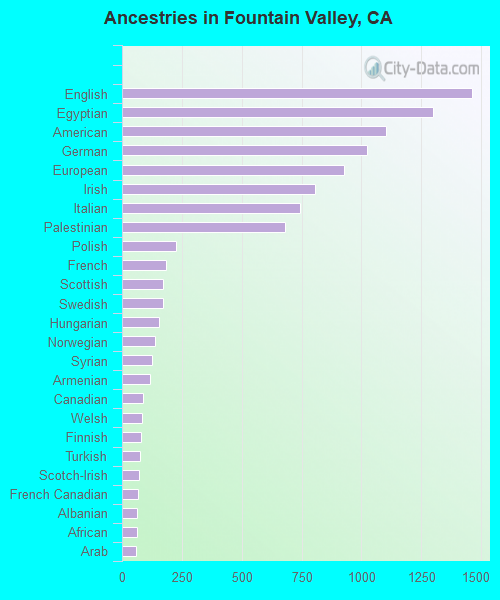
First ancestries reported:
English: 1,460 (4.4%)
Egyptian: 1,301 (3.9%)
American: 1,102 (3.3%)
German: 1,024 (3.1%)
European: 926 (2.8%)
Irish: 805 (2.4%)
Italian: 743 (2.2%)
Palestinian: 682 (2.1%)
Polish: 225 (0.7%)
French: 182 (0.6%)
Scottish: 171 (0.5%)
Swedish: 171 (0.5%)
Hungarian: 153 (0.5%)
Norwegian: 136 (0.4%)
Syrian: 126 (0.4%)
Armenian: 117 (0.4%)
Canadian: 89 (0.3%)
Welsh: 85 (0.3%)
Finnish: 81 (0.2%)
Turkish: 74 (0.2%)
Scotch-Irish: 70 (0.2%)
French Canadian: 65 (0.2%)
Albanian: 64 (0.2%)
African: 61 (0.2%)
Arab: 60 (0.2%)
Afghan: 56 (0.2%)
Eastern European: 48 (0.1%)
Danish: 48 (0.1%)
Estonian: 46 (0.1%)
Austrian: 45 (0.1%)
Ukrainian: 40 (0.1%)
Russian: 38 (0.1%)
Scandinavian: 38 (0.1%)
Assyrian: 37 (0.1%)
British: 34 (0.1%)
Dutch: 34 (0.1%)
Portuguese: 33 (0.10%)
Greek: 31 (0.09%)
Northern European: 30 (0.09%)
Lebanese: 26 (0.08%)
Slovak: 26 (0.08%)
Iranian: 25 (0.08%)
Croatian: 22 (0.07%)
Jordanian: 21 (0.06%)
Moroccan: 20 (0.06%)
Australian: 19 (0.06%)
Israeli: 18 (0.05%)
Macedonian: 16 (0.05%)
Swiss: 16 (0.05%)
Yugoslavian: 13 (0.04%)
Serbian: 11 (0.03%)
Brazilian: 10 (0.03%)
Romanian: 8 (0.02%)
Lithuanian: 5 (0.02%)
Czech: 4 (0.01%)
Most common places of birth for foreign-born residents (%):
Vietnam
Fountain Valley:
47.8% (8,773)
California:
4.9% (512,335)
Mexico
Fountain Valley:
9.0% (1,647)
California:
37.2% (3,881,193)
Egypt
Fountain Valley:
5.1% (931)
California:
0.4% (42,718)
Philippines
Fountain Valley:
4.6% (836)
California:
7.8% (818,297)
Taiwan
Fountain Valley:
3.2% (584)
California:
1.7% (176,274)
Japan
Fountain Valley:
3.2% (583)
California:
1.0% (103,575)
India
Fountain Valley:
3.1% (576)
California:
5.2% (539,184)
Korea
Fountain Valley:
2.8% (516)
California:
3.0% (315,248)
China, excluding Hong Kong and Taiwan
Fountain Valley:
2.5% (457)
California:
6.6% (684,672)
Canada
Fountain Valley:
1.9% (358)
California:
1.2% (127,477)
Place of birth for U.S.-born residents:
This state: 28,094
Other state: 8,714
Northeast: 1,845
Midwest: 2,687
South: 1,617
West: 2,538
90.3% of Fountain Valley residents lived in the same house 1 years ago. Out of people who lived in different houses, 43.9% lived in this county. Out of people who lived in different counties, 60.0% lived in California.
Fountain Valley:
90.3%
State average:
88.9%
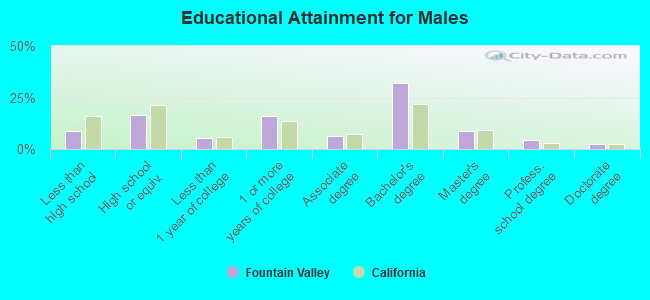
Education attainment for males 25 years and older:
No schooling: 621
Nursery to 4th grade: 137
5th and 6th grade: 118
7th and 8th grade: 154
9th grade: 87
10th grade: 252
11th grade: 102
12th grade, no diploma: 328
High school graduate (or equivalency): 3,299
Less than 1 year of college: 1,036
Some college more than 1 year, no degree: 3,197
Associate degree: 1,306
Bachelor's degree: 6,384
Master's degree: 1,772
Professional school degree: 831
Doctorate degree: 453
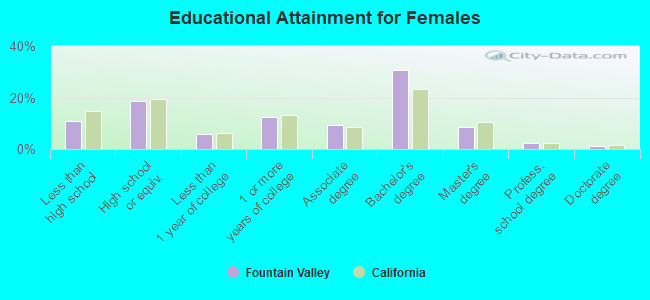
Education attainment for females 25 years and older:
No schooling: 873
Nursery to 4th grade: 115
5th and 6th grade: 145
7th and 8th grade: 196
9th grade: 68
10th grade: 185
11th grade: 191
12th grade, no diploma: 526
High school graduate (or equivalency): 3,929
Less than 1 year of college: 1,235
Some college more than 1 year, no degree: 2,642
Associate degree: 1,938
Bachelor's degree: 6,416
Master's degree: 1,770
Professional school degree: 510
Doctorate degree: 280
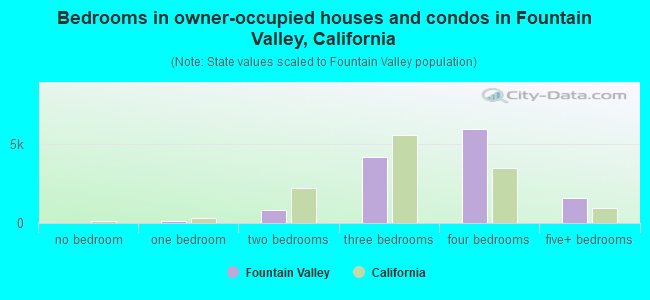
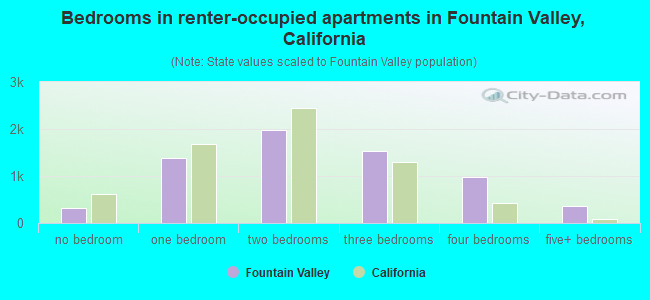
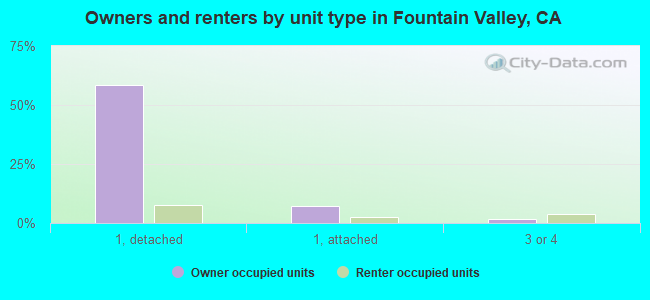
Housing units in structures:
One, detached: 13,291
One, attached: 1,954
Two: 60
3 or 4: 775
5 to 9: 882
10 to 19: 446
20 to 49: 483
50 or more: 1,396
Mobile homes: 234
Boats, RVs, vans, etc.: 22
Median worth of mobile homes: $123,813
Housing units lacking complete plumbing facilities in 2022: 0.4%
Housing units lacking complete kitchen facilities in 2022: 2.4%
House/condo owner moved in on average 18 years ago