Glen Cove, NY (New York) Houses and Residents
| Glen Cove: | $646,028 |
| New York: | $400,400 |
Mean price in 2022:
Detached houses: $856,436
Here: $856,436 State: $476,719 Townhouses or other attached units: $790,809
Here: $790,809 State: $699,270 In 2-unit structures: $575,005
Here: $575,005 State: $713,077 In 3-to-4-unit structures: $464,480
Here: $464,480 State: $764,568 In 5-or-more-unit structures: $303,459
Here: $303,459 State: $912,009 Mobile homes: $953,908
Here: $953,908 State: $88,925
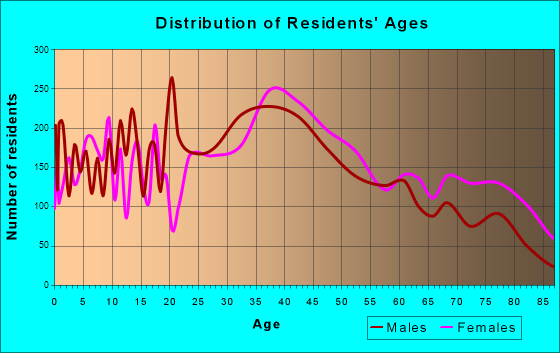
Total population: 27,314 (Urban population: 26,622, Rural population: 0)
Houses: 11,086 (10,741 occupied: 6,068 owner occupied, 4,655 renter occupied)
| % of renters here: | 43% |
| State: | 46% |
Housing density: 1,668 houses/condos per square mile
Median price asked for vacant for-sale houses and condos in 2022: $972,391.
Median contract rent in 2022: $1,870 (lower quartile is $1,415, upper quartile is over $2,000)
Median rent asked for vacant for-rent units in 2022: $2,903
Median gross rent in Glen Cove, NY in 2022: over $2,000
Housing units in Glen Cove with a mortgage: 3,267 (425 second mortgage, 13 home equity loan, 415 both second mortgage and home equity loan)
Houses without a mortgage: 59
Median household income for houses/condos with a mortgage: $145,125
Median household income for apartments without a mortgage: $80,262
Median monthly housing costs: $2,141
Compare current foreclosures near Glen Cove, NY:
| Photo | Address | Area | Beds / Baths | Price | Details |
|---|---|---|---|---|---|

|
#1
Landing Rd
Glen Cove, NY 11542
|
1,376 sq. feet
|
2 baths - beds |
show details | |

|
#2
Coles St
Glen Cove, NY 11542
|
1,472 sq. feet
|
1 baths - beds |
show details | |

|
#3
S Craft Ln # 1
Glen Cove, NY 11542
|
2,765 sq. feet
|
3 baths - beds |
show details | |

|
#4
Jackson St
Glen Cove, NY 11542
|
1,012 sq. feet
|
1 baths - beds |
show details | |

|
#5
Branding Iron Ln
Glen Cove, NY 11542
|
2,249 sq. feet
|
2 baths - beds |
show details | |

|
#6
Barlow Ave
Glen Cove, NY 11542
|
2,139 sq. feet
|
2 baths - beds |
show details | |

|
#7
Highland Rd
Glen Cove, NY 11542
|
4,121 sq. feet
|
4 baths - beds |
show details | |

|
#8
Yale Pl
Glen Cove, NY 11542
|
1,302 sq. feet
|
2 baths - beds |
show details | |

|
#9
Quail Ridge Rd
Glen Cove, NY 11542
|
3,507 sq. feet
|
3 baths - beds |
show details | |

|
#10
Glendale Dr
Glen Cove, NY 11542
|
1,580 sq. feet
|
2 baths - beds |
show details |
| Photo | Address | Area | Beds / Baths | Price | Details |
|---|---|---|---|---|---|

|
#11
Crescent Beach Rd
Glen Cove, NY 11542
|
2,569 sq. feet
|
3 baths - beds |
show details | |

|
#12
Saint Andrews Ln
Glen Cove, NY 11542
|
2,540 sq. feet
|
2 baths - beds |
show details | |

|
#13
Washington St
Glen Cove, NY 11542
|
1,288 sq. feet
|
1 baths - beds |
show details | |

|
#14
Mcloughlin St
Glen Cove, NY 11542
|
1,503 sq. feet
|
2 baths - beds |
show details | |

|
#15
Maple Ave
Glen Cove, NY 11542
|
- sq. feet
|
- baths - beds |
show details | |

|
#16
Capobianco St Apt 1
Glen Cove, NY 11542
|
- sq. feet
|
- baths - beds |
show details | |

|
#17
Putnam Ave
Glen Cove, NY 11542
|
- sq. feet
|
- baths - beds |
show details | |

|
#18
Russell Pl
Glen Cove, NY 11542
|
- sq. feet
|
- baths - beds |
show details | |

|
#19
Sea Isle Ldg
Glen Cove, NY 11542
|
- sq. feet
|
- baths - beds |
show details | |

|
#20
E 221st St
Bronx, NY 10467
|
1,890 sq. feet
|
2 baths 3 beds |
$554,900
|
show details |
| Photo | Address | Area | Beds / Baths | Price | Details |
|---|---|---|---|---|---|

|
#21
Belmont Pkwy
Hempstead, NY 11550
|
1,348 sq. feet
|
1 baths 3 beds |
$659,900
|
show details |

|
#22
90th St Apt 5d
Jackson Heights, NY 11372
|
1,000 sq. feet
|
1 baths 2 beds |
$269,900
|
show details |

|
#23
Bellport Ave
Wantagh, NY 11793
|
1,785 sq. feet
|
3 baths 5 beds |
$700,000
|
show details |

|
#24
E Marshall St
Hempstead, NY 11550
|
1,210 sq. feet
|
2 baths 4 beds |
$479,900
|
show details |

|
#25
Midland Ave Apt 4h
Bronxville, NY 10708
|
900 sq. feet
|
1 baths 1 beds |
$184,000
|
show details |

|
#26
Grand Concourse Apt 3c
Bronx, NY 10452
|
700 sq. feet
|
1 baths 1 beds |
$184,500
|
show details |

|
#27
Olinville Ave Apt 11c
Bronx, NY 10467
|
1,000 sq. feet
|
2 baths 3 beds |
$385,000
|
show details |

|
#28
Merle Ave
Oceanside, NY 11572
|
885 sq. feet
|
1 baths 2 beds |
$450,000
|
show details |

|
#29
Oceanside Pkwy
Oceanside, NY 11572
|
1,650 sq. feet
|
2 baths 2 beds |
$545,000
|
show details |

|
#30
Davenport Ave Apt 1b
New Rochelle, NY 10805
|
750 sq. feet
|
1 baths 1 beds |
$159,900
|
show details |
| Photo | Address | Area | Beds / Baths | Price | Details |
|---|---|---|---|---|---|

|
#31
W Sidney Ave
Mount Vernon, NY 10550
|
2,800 sq. feet
|
3 baths 8 beds |
$454,900
|
show details |

|
#32
Ford Dr N
Massapequa, NY 11758
|
2,000 sq. feet
|
2 baths 5 beds |
$799,900
|
show details |

|
#33
Dartmouth St
Westbury, NY 11590
|
1,772 sq. feet
|
1 baths 4 beds |
$499,200
|
show details |

|
#34
Franklin St
Elmont, NY 11003
|
1,116 sq. feet
|
2 baths 2 beds |
$679,900
|
show details |

|
#35
Francis Lewis Blvd
Queens Village, NY 11429
|
844 sq. feet
|
1 baths 2 beds |
$589,900
|
show details |

|
#36
6th Ave Apt A
Huntington Station, NY 11746
|
3,300 sq. feet
|
4 baths 7 beds |
$999,900
|
show details |

|
#37
177th St
Jamaica, NY 11433
|
1,156 sq. feet
|
1 baths 3 beds |
$450,000
|
show details |

|
#38
N Broadway Apt A6
Yonkers, NY 10701
|
950 sq. feet
|
2 baths 2 beds |
$219,900
|
show details |

|
#39
Harbor Rd
Hewlett, NY 11557
|
4,549 sq. feet
|
4 baths 5 beds |
$1,155,000
|
show details |

|
#40
Tulip Ave # Gl2
Floral Park, NY 11001
|
1,200 sq. feet
|
1 baths 2 beds |
$409,900
|
show details |
| Photo | Address | Area | Beds / Baths | Price | Details |
|---|---|---|---|---|---|

|
#41
Limerick St
Stamford, CT 06902
|
1,382 sq. feet
|
4 baths 5 beds |
$919,900
|
show details |

|
#42
17th Ave 1st Floor
Whitestone, NY 11357
|
610 sq. feet
|
1 baths 1 beds |
$229,900
|
show details |

|
#43
Martin Ave
Hempstead, NY 11550
|
1,479 sq. feet
|
2 baths 4 beds |
$669,900
|
show details |

|
#44
Edcris Ln
Huntington, NY 11743
|
1,450 sq. feet
|
2 baths 3 beds |
$550,000
|
show details |

|
#45
Crane Ave
White Plains, NY 10603
|
2,400 sq. feet
|
2 baths 4 beds |
$654,500
|
show details |

|
#46
237th Street
Elmont, NY 11003
|
1,323 sq. feet
|
2 baths 4 beds |
$468,000
|
show details |

|
#47
Fordham Hill Oval
Bronx, NY 10468
|
700 sq. feet
|
1 baths 1 beds |
$154,900
|
show details |

|
#48
Riverdale Ave
Port Chester, NY 10573
|
1,616 sq. feet
|
1 baths 3 beds |
$659,900
|
show details |

|
#49
Evans Ave
Elmont, NY 11003
|
1,352 sq. feet
|
2 baths 3 beds |
$719,900
|
show details |

|
Check over 1 million property listings on Foreclosure.com!
|
browse all offers | |||


 | Condos in Jericho, Glen Cove, Syosset (5 replies) |
| Multi-Family Housing Coming Near You Soon! (504 replies) |
| Anyone know about Cove Landing condos in Glen Cove? (2 replies) |
| Glen Cove makes Money's Best Places to Live (4 replies) |
| Searching for homes in LI (51 replies) |
| Looking for Nassau or Suffolk County townhome/condo - help (33 replies) |
Median year apartment built: 1969
Household type by relationship:
Households: 28,021- Male householders: 4,826 (1,098 living alone), Female householders: 5,823 (1,743 living alone)
4,812 spouses (4,774 opposite-sex spouses), 939 unmarried partners, (908 opposite-sex unmarried partners), 7,869 children (7,653 natural, 32 adopted, 182 stepchildren), 238 grandchildren, 371 brothers or sisters, 903 parents, 14 foster children, 641 other relatives, 884 non-relatives
- In group quarters: 698
Size of family households: 2,776 2-persons, 1,442 3-persons, 1,865 4-persons, 729 5-persons, 180 6-persons, 65 7-or-more-persons.
Size of nonfamily households: 2,963 1-person, 634 2-persons, 81 3-persons, 32 5-persons.
2,570 married couples with children.
2,118 single-parent households (546 men, 1,572 women).
59.9% of residents of Glen Cove speak English at home.
24.8% of residents speak Spanish at home (52% speak English very well, 24% speak English well, 19% speak English not well, 5% don't speak English at all).
11.4% of residents speak other Indo-European language at home (72% speak English very well, 14% speak English well, 10% speak English not well, 4% don't speak English at all).
2.8% of residents speak Asian or Pacific Island language at home (41% speak English very well, 36% speak English well, 17% speak English not well, 6% don't speak English at all).
0.8% of residents speak other language at home (82% speak English very well, 18% speak English well).
Foreign born population: 8,276 (29.5%)
(50.5% of them are naturalized citizens)
| Here: | 6.8 |
| State: | 6.3 |
| Here: | 3.8 |
| State: | 3.8 |

- Bedrooms in owner-occupied houses and condos in Glen Cove, New York
- 28no bedroom
- 3011 bedroom
- 6552 bedrooms
- 2,6603 bedrooms
- 1,7964 bedrooms
- 6285+ bedrooms

- Bedrooms in renter-occupied apartments in Glen Cove, New York
- 379no bedroom
- 1,4591 bedroom
- 1,4702 bedrooms
- 1,1223 bedrooms
- 1304 bedrooms
- 935+ bedrooms

- Cars and other vehicles available in Glen Cove in owner-occupied houses/condos
- 356no vehicle
- 1,7561 vehicle
- 2,2532 vehicles
- 1,0173 vehicles
- 4054 vehicles
- 2815+ vehicles

- Cars and other vehicles available in Glen Cove in renter-occupied apartments
- 883no vehicle
- 2,2151 vehicle
- 1,1372 vehicles
- 3133 vehicles
- 504 vehicles
- 575+ vehicles

- Rooms in owner-occupied houses in Glen Cove, New York
- 281 room
- 572 rooms
- 1593 rooms
- 3084 rooms
- 8415 rooms
- 1,2756 rooms
- 9987 rooms
- 9638 rooms
- 1,4399+ rooms

- Rooms in renter-occupied apartments in Glen Cove, New York
- 2711 room
- 6342 rooms
- 9603 rooms
- 1,0464 rooms
- 7805 rooms
- 5876 rooms
- 1497 rooms
- 1898 rooms
- 399+ rooms


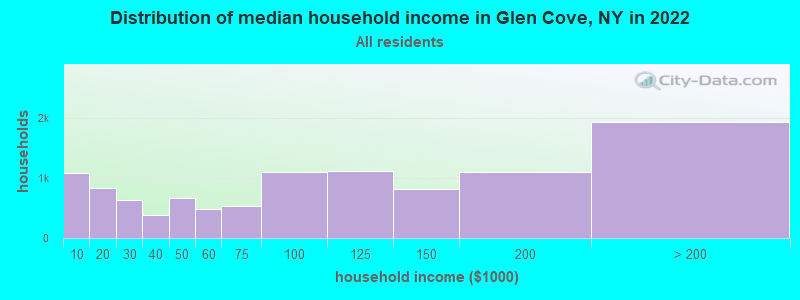
Glen Cove, NY household income distribution

- 1,090Less than $10,000
- 836$10,000 to $19,999
- 628$20,000 to $29,999
- 387$30,000 to $39,999
- 669$40,000 to $49,999
- 488$50,000 to $59,999
- 528$60,000 to $74,999
- 1,112$75,000 to $99,999
- 1,120$100,000 to $124,999
- 826$125,000 to $149,999
- 1,100$150,000 to $199,999
- 1,940$200,000 or more
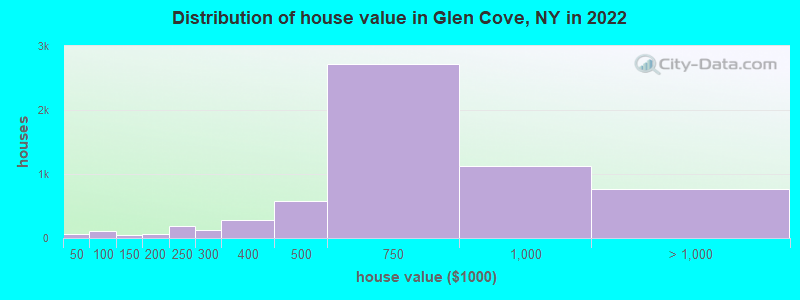
Home value of owner - occupied houses in 2022 in Glen Cove, NY
-
- 41Less than $10,000
- 23$30,000 to $34,999
- 29$50,000 to $59,999
- 13$60,000 to $69,999
- 27$70,000 to $79,999
- 19$80,000 to $89,999
- 14$90,000 to $99,999
- 45$100,000 to $124,999
- 31$150,000 to $174,999
- 33$175,000 to $199,999
- 181$200,000 to $249,999
- 131$250,000 to $299,999
- 280$300,000 to $399,999
- 576$400,000 to $499,999
- 2,715$500,000 to $749,999
- 1,123$750,000 to $999,999
- 463$1,000,000 to $1,499,999
- 126$1,500,000 to $1,999,999
- 169$2,000,000 or more
Rent paid by renters in 2022 in Glen Cove, NY
-
- 110$150 to $199
- 66$200 to $249
- 5$250 to $299
- 45$300 to $349
- 71$350 to $399
- 27$400 to $449
- 22$500 to $549
- 11$550 to $599
- 13$600 to $649
- 58$700 to $749
- 24$750 to $799
- 154$800 to $899
- 95$900 to $999
- 302$1,000 to $1,249
- 252$1,250 to $1,499
- 1,409$1,500 to $1,999
- 410$2,000 to $2,499
- 990$2,500 to $2,999
- 552$3,000 to $3,499
- 213$3,500 or more
- 77No cash rent


Percentage of workers working in this county: 75.3%
Number of people working at home: 1,391 (10.2% of all workers)
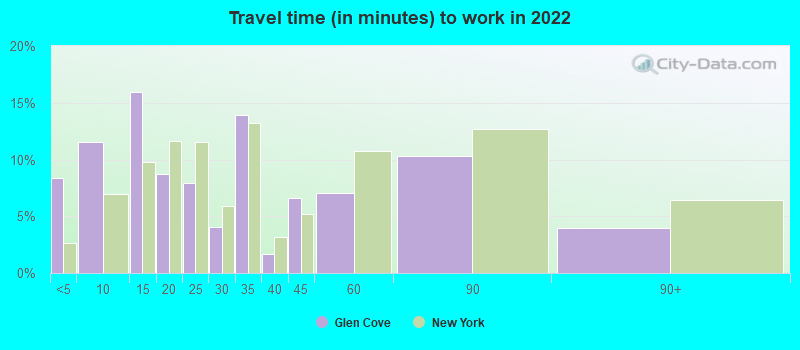
Travel time to work (commute)
- Less than 5 minutes: 813
- 5 to 9 minutes: 1,603
- 10 to 14 minutes: 1,587
- 15 to 19 minutes: 927
- 20 to 24 minutes: 1,418
- 25 to 29 minutes: 480
- 30 to 34 minutes: 1,313
- 35 to 39 minutes: 282
- 40 to 44 minutes: 454
- 45 to 59 minutes: 634
- 60 to 89 minutes: 1,390
- 90 or more minutes: 1,095
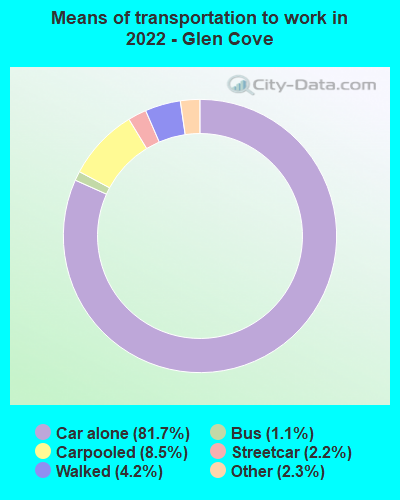
Means of transportation to work:
- Drove a car alone: 8,245 (70.9%)
- Carpooled: 833 (7.2%)
- Bus: 110 (0.9%)
- Subway or elevated rail: 196 (1.7%)
- Taxi: 329 (2.8%)
- Walked: 459 (3.9%)
- Worked at home: 1,391 (12.0%)

- Unemployment by race in 2022
- Unemployment rate for White non-Hispanic residents
- 3.8%Males
- 3.2%Females
- Unemployment rate for American Indian and Alaska Native residents
- 13.0%Males
- Unemployment rate for Asian residents
- 3.1%Females
- Unemployment rate for two or more race residents
- 3.9%Males
- Unemployment rate for Hispanic or Latino residents
- 3.7%Males
- 1.4%Females

- Year of entry for the foreign-born population in Glen Cove, New York
- 1,7902010 or later
- 2,1932000 to 2009
- 1,4501990 to 1999
- 1,8211980 to 1989
- 1,1511970 to 1979
- 1,684Before 1970
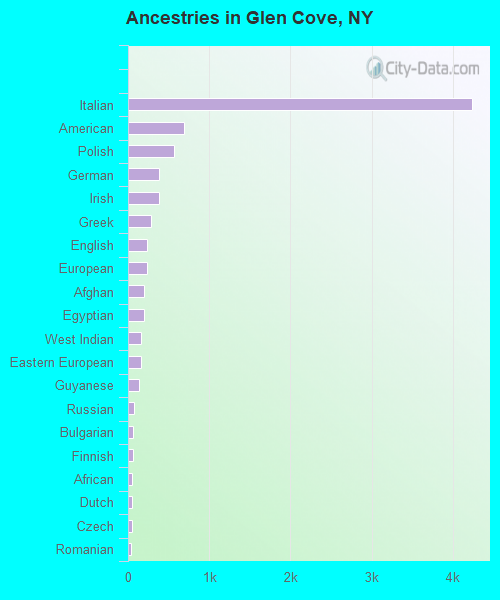
First ancestries reported:
- Italian: 4,232 (25.5%)
- American: 685 (4.1%)
- Polish: 571 (3.4%)
- German: 385 (2.3%)
- Irish: 381 (2.3%)
- Greek: 289 (1.7%)
- English: 235 (1.4%)
- European: 233 (1.4%)
- Afghan: 194 (1.2%)
- Egyptian: 192 (1.2%)
- West Indian: 163 (1.0%)
- Eastern European: 156 (0.9%)
- Guyanese: 134 (0.8%)
- Russian: 72 (0.4%)
- Bulgarian: 66 (0.4%)
- Finnish: 65 (0.4%)
- African: 54 (0.3%)
- Dutch: 50 (0.3%)
- Czech: 46 (0.3%)
- Romanian: 39 (0.2%)
- Hungarian: 29 (0.2%)
- Jamaican: 27 (0.2%)
- Norwegian: 25 (0.2%)
- Austrian: 23 (0.1%)
- Portuguese: 20 (0.1%)
- Iraqi: 18 (0.1%)
- Canadian: 18 (0.1%)
- Trinidadian and Tobagonian: 18 (0.1%)
- Jordanian: 17 (0.1%)
- Ghanaian: 17 (0.1%)
- Lithuanian: 16 (0.10%)
- Syrian: 14 (0.08%)
- Czechoslovakian: 14 (0.08%)
- Iranian: 13 (0.08%)
- Scottish: 13 (0.08%)
- Ukrainian: 13 (0.08%)
- Israeli: 12 (0.07%)
- Northern European: 12 (0.07%)
- French: 9 (0.05%)
- Danish: 9 (0.05%)
- Cypriot: 8 (0.05%)
- Serbian: 8 (0.05%)
- Palestinian: 7 (0.04%)
- Scandinavian: 7 (0.04%)
- Lebanese: 6 (0.04%)
- Slovak: 6 (0.04%)
- Haitian: 6 (0.04%)
- Macedonian: 5 (0.03%)
Most common places of birth for foreign-born residents (%):
| Glen Cove: | 31.7% (2,536) |
| New York: | 2.4% (108,067) |
| Glen Cove: | 14.3% (1,148) |
| New York: | 1.8% (81,374) |
| Glen Cove: | 5.7% (458) |
| New York: | 1.2% (54,759) |
| Glen Cove: | 5.0% (403) |
| New York: | 9.1% (410,910) |
| Glen Cove: | 4.2% (340) |
| New York: | 0.6% (27,385) |
| Glen Cove: | 2.8% (225) |
| New York: | 3.8% (172,129) |
| Glen Cove: | 2.7% (220) |
| New York: | 1.4% (61,245) |
| Glen Cove: | 2.5% (204) |
| New York: | 11.1% (501,040) |
| Glen Cove: | 2.1% (171) |
| New York: | 1.4% (65,102) |
| Glen Cove: | 2.0% (163) |
| New York: | 0.6% (28,604) |
Place of birth for U.S.-born residents:
- This state: 16,748
- Other state: 2,506
- Northeast: 781
- Midwest: 594
- South: 783
- West: 373
86.9% of Glen Cove residents lived in the same house 1 years ago.
Out of people who lived in different houses, 36.2% lived in this county.
Out of people who lived in different counties, 86.3% lived in New York.
| Glen Cove: | 86.9% |
| State average: | 89.6% |
Education attainment for males 25 years and older:
- No schooling: 563
- Nursery to 4th grade: 126
- 5th and 6th grade: 104
- 7th and 8th grade: 94
- 9th grade: 96
- 10th grade: 18
- 11th grade: 92
- 12th grade, no diploma: 243
- High school graduate (or equivalency): 2,172
- Less than 1 year of college: 434
- Some college more than 1 year, no degree: 761
- Associate degree: 541
- Bachelor's degree: 2,485
- Master's degree: 724
- Professional school degree: 528
- Doctorate degree: 175

Education attainment for females 25 years and older:
- No schooling: 1,170
- Nursery to 4th grade: 222
- 5th and 6th grade: 61
- 7th and 8th grade: 179
- 9th grade: 31
- 10th grade: 74
- 11th grade: 44
- 12th grade, no diploma: 232
- High school graduate (or equivalency): 2,568
- Less than 1 year of college: 581
- Some college more than 1 year, no degree: 1,096
- Associate degree: 469
- Bachelor's degree: 2,467
- Master's degree: 1,693
- Professional school degree: 244
- Doctorate degree: 264

Housing units in structures:
- One, detached: 5,872
- One, attached: 584
- Two: 1,445
- 3 or 4: 654
- 5 to 9: 320
- 10 to 19: 216
- 20 to 49: 641
- 50 or more: 1,315
- Mobile homes: 36
Housing units lacking complete kitchen facilities in 2022: 2.1%
House/condo owner moved in on average 16 years ago
Renter moved in on average 2 years ago

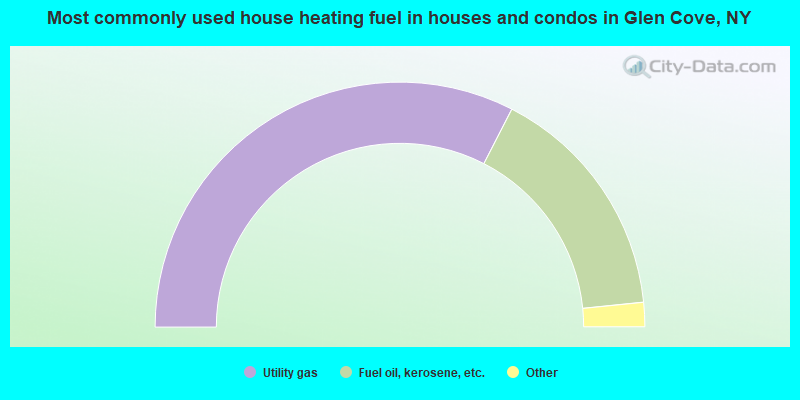
- 65.1%Utility gas
- 31.7%Fuel oil, kerosene, etc.
- 1.7%Electricity
- 0.8%Other fuel
- 0.4%Bottled, tank, or LP gas
- 0.2%Wood
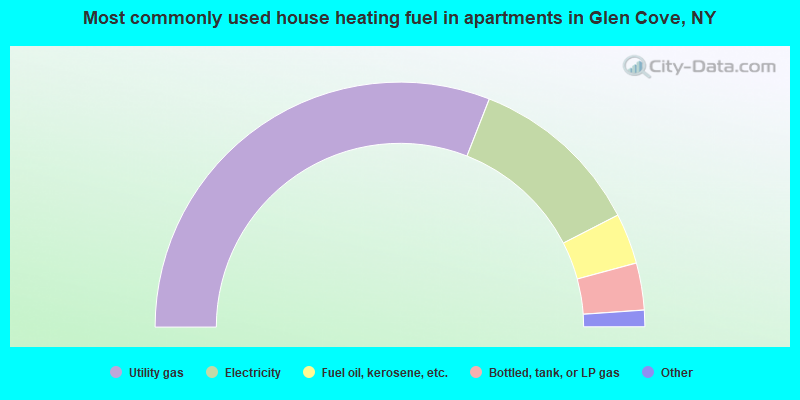
- 61.9%Utility gas
- 23.0%Electricity
- 6.7%Fuel oil, kerosene, etc.
- 6.2%Bottled, tank, or LP gas
- 1.4%No fuel used
- 0.8%Other fuel
Private vs. public school enrollment:
| Here: | 13.0% |
| New York: | 15.6% |
| Here: | 21.4% |
| New York: | 15.0% |
| Here: | 36.9% |
| New York: | 39.2% |


