Gloverville, SC (South Carolina) Houses and Residents
| Gloverville: | $86,572 |
| South Carolina: | $254,600 |
Mean price in 2022:
Detached houses: $159,082
Here: $159,082 State: $368,255 Mobile homes: $57,368
Here: $57,368 State: $102,531
Total population: 2,831 (Urban population: 2,321, Rural population: 402 (all nonfarm))
Houses: 1,333 (1,117 occupied: 663 owner occupied, 476 renter occupied)
| % of renters here: | 42% |
| State: | 28% |
Housing density: 381 houses/condos per square mile
Median price asked for vacant for-sale houses and condos in 2022 in this county: $311,670.
Median contract rent in 2022: $706 (lower quartile is $522, upper quartile is $869)
Median rent asked for vacant for-rent units in 2022: $701
Median gross rent in Gloverville, SC in 2022: $1,061
Housing units in Gloverville with a mortgage: 143 (8 second mortgage, 17 home equity loan, 0 both second mortgage and home equity loan)
Houses without a mortgage: 0
Median household income for houses/condos with a mortgage: $105,167
Median household income for apartments without a mortgage: $44,366
Median monthly housing costs: $665
Compare current foreclosures near Gloverville, SC:
| Photo | Address | Area | Beds / Baths | Price | Details |
|---|---|---|---|---|---|

|
#1
Lawana Dr Apt 103
Gloverville, SC 29828
|
- sq. feet
|
- baths - beds |
show details | |

|
#2
Hubert St
Gloverville, SC 29828
|
1,456 sq. feet
|
- baths - beds |
show details | |

|
#3
Goldfinch Dr
Augusta, GA 30906
|
1,318 sq. feet
|
2 baths 4 beds |
$165,000
|
show details |

|
#4
Heath St
Augusta, GA 30904
|
1,349 sq. feet
|
2 baths 3 beds |
$244,900
|
show details |

|
#5
Hill St
North Augusta, SC 29841
|
1,375 sq. feet
|
2 baths 3 beds |
show details | |

|
#6
Edisto Ave
Aiken, SC 29801
|
1,994 sq. feet
|
2 baths 3 beds |
show details | |

|
#7
Rosemont Dr
Aiken, SC 29801
|
1,341 sq. feet
|
1 baths 3 beds |
show details | |

|
#8
Nokesville Cir
Aiken, SC 29803
|
2,140 sq. feet
|
3 baths 3 beds |
show details | |

|
#9
Blueberry Dr
Augusta, GA 30906
|
2,069 sq. feet
|
3 baths 4 beds |
show details | |

|
#10
Holly Haven Dr
Augusta, GA 30907
|
2,180 sq. feet
|
4 baths 4 beds |
show details |
| Photo | Address | Area | Beds / Baths | Price | Details |
|---|---|---|---|---|---|

|
#11
Redd Dr
Augusta, GA 30906
|
2,952 sq. feet
|
3 baths 3 beds |
show details | |

|
#12
White Owl Forest Dr
Augusta, GA 30909
|
1,705 sq. feet
|
2 baths 3 beds |
show details | |

|
#13
Piper Rd
Aiken, SC 29805
|
1,782 sq. feet
|
2 baths 3 beds |
show details | |

|
#14
Redd Dr
Augusta, GA 30906
|
975 sq. feet
|
1 baths 2 beds |
show details | |

|
#15
Coronet Dr
North Augusta, SC 29860
|
1,880 sq. feet
|
3 baths 1 beds |
show details | |

|
#16
Oakdale Dr
Beech Island, SC 29842
|
1,253 sq. feet
|
1 baths 3 beds |
show details | |

|
#17
Strutter Trl
Aiken, SC 29801
|
1,176 sq. feet
|
2 baths 2 beds |
show details | |

|
#18
Burnaby Ct
Aiken, SC 29801
|
2,216 sq. feet
|
3 baths 5 beds |
show details | |

|
#19
Sapphire Dr
Graniteville, SC 29829
|
3,416 sq. feet
|
4 baths 5 beds |
show details | |

|
#20
Round Stone Dr
Graniteville, SC 29829
|
2,569 sq. feet
|
3 baths 5 beds |
show details |
| Photo | Address | Area | Beds / Baths | Price | Details |
|---|---|---|---|---|---|

|
#21
Bunting Dr
North Augusta, SC 29841
|
1,701 sq. feet
|
2 baths 3 beds |
show details | |

|
#22
Faircrest Ave
Augusta, GA 30906
|
1,704 sq. feet
|
2 baths 4 beds |
show details | |

|
#23
Cozy Knl
Graniteville, SC 29829
|
1,845 sq. feet
|
3 baths 3 beds |
show details | |

|
#24
Graylyn Lakes Dr
Aiken, SC 29803
|
3,572 sq. feet
|
3 baths 5 beds |
show details | |

|
#25
Sandpiper Ln
Augusta, GA 30907
|
2,235 sq. feet
|
2 baths 3 beds |
show details | |

|
#26
Woodcrest Dr
Beech Island, SC 29842
|
1,298 sq. feet
|
2 baths 3 beds |
show details | |

|
#27
Martinique Dr
Augusta, GA 30909
|
2,816 sq. feet
|
3 baths 5 beds |
show details | |

|
#28
Orchard Way
North Augusta, SC 29860
|
1,232 sq. feet
|
2 baths 2 beds |
show details | |

|
#29
Wedgewood Dr
Augusta, GA 30909
|
1,342 sq. feet
|
2 baths 3 beds |
show details | |

|
#30
Shadow Rock Dr
North Augusta, SC 29860
|
4,670 sq. feet
|
5 baths 4 beds |
show details |
| Photo | Address | Area | Beds / Baths | Price | Details |
|---|---|---|---|---|---|

|
#31
Farrington Way
North Augusta, SC 29860
|
4,257 sq. feet
|
4 baths 4 beds |
show details | |

|
#32
Sierra Dr
Aiken, SC 29803
|
1,482 sq. feet
|
2 baths 3 beds |
show details | |

|
#33
Mill Branch Way
North Augusta, SC 29860
|
1,935 sq. feet
|
2 baths 3 beds |
show details | |

|
#34
Overlook Rd
Augusta, GA 30906
|
1,400 sq. feet
|
1 baths 3 beds |
show details | |

|
#35
Edisto Ave
Beech Island, SC 29842
|
1,508 sq. feet
|
2 baths 3 beds |
show details | |

|
#36
Chesterfield St N
Aiken, SC 29801
|
1,250 sq. feet
|
2 baths 3 beds |
show details | |

|
#37
Lively St
Augusta, GA 30906
|
1,164 sq. feet
|
1 baths 3 beds |
show details | |

|
#38
Southbank Dr
Aiken, SC 29803
|
1,565 sq. feet
|
2 baths 3 beds |
show details | |

|
#39
Lott Rd
Johnston, SC 29832
|
2,960 sq. feet
|
2 baths 2 beds |
show details | |

|
#40
Belmont Ct
North Augusta, SC 29841
|
1,804 sq. feet
|
2 baths 3 beds |
show details |
| Photo | Address | Area | Beds / Baths | Price | Details |
|---|---|---|---|---|---|

|
#41
Cactus Ct
Augusta, GA 30906
|
1,612 sq. feet
|
2 baths 3 beds |
show details | |

|
#42
Highberry Ct
Aiken, SC 29803
|
2,780 sq. feet
|
3 baths 4 beds |
show details | |

|
#43
Monterey Ave
North Augusta, SC 29841
|
1,000 sq. feet
|
2 baths 3 beds |
show details | |

|
#44
Turning Crest Ln
Graniteville, SC 29829
|
1,532 sq. feet
|
2 baths 3 beds |
show details | |

|
#45
Coventry Cir
North Augusta, SC 29860
|
2,487 sq. feet
|
3 baths 4 beds |
show details | |

|
#46
Three Runs Plantation Dr
Aiken, SC 29803
|
2,767 sq. feet
|
3 baths 4 beds |
show details | |

|
#47
Grayson Dr
Graniteville, SC 29829
|
2,103 sq. feet
|
3 baths 4 beds |
show details | |

|
#48
Overton Rd
Augusta, GA 30904
|
2,514 sq. feet
|
3 baths 4 beds |
show details | |

|
#49
Shetland Dr
Jackson, SC 29831
|
1,388 sq. feet
|
2 baths 3 beds |
show details | |

|
Check over 1 million property listings on Foreclosure.com!
|
browse all offers | |||

Latest news about housing in Gloverville, SC collected exclusively by city-data.com from local newspapers, TV, and radio stations

 | Whitmire vs Gloverville vs Pacolet vs Timmonsville (8 replies) |
| Aiken SC? (17 replies) |
| Small historic towns? (21 replies) |

Median year apartment built: 1989
Household type by relationship:
Households: 3,177- Male householders: 417 (154 living alone), Female householders: 694 (175 living alone)
297 spouses (297 opposite-sex spouses), 25 unmarried partners, (6 opposite-sex unmarried partners), 899 children (755 natural, 130 adopted, 13 stepchildren), 471 grandchildren, 186 brothers or sisters, 43 parents, 0 foster children, 95 other relatives, 42 non-relatives
- In group quarters: 5
Size of family households: 364 2-persons, 224 3-persons, 50 4-persons, 51 5-persons, 78 6-persons, 61 7-or-more-persons.
Size of nonfamily households: 323 1-person, 10 2-persons.
42 married couples with children.
344 single-parent households (24 men, 320 women).
95.9% of residents of Gloverville speak English at home.
3.6% of residents speak Spanish at home (43% speak English very well, 28% speak English well, 28% speak English not well).
Foreign born population: 42 (1.3%)
(0.0% of them are naturalized citizens)
| Here: | 5.1 |
| State: | 6.4 |
| Here: | 4.2 |
| State: | 4.5 |

- Bedrooms in owner-occupied houses and condos in Gloverville, South Carolina
- 0no bedroom
- 01 bedroom
- 1232 bedrooms
- 5213 bedrooms
- 194 bedrooms
- 05+ bedrooms

- Bedrooms in renter-occupied apartments in Gloverville, South Carolina
- 0no bedroom
- 551 bedroom
- 2282 bedrooms
- 1173 bedrooms
- 224 bedrooms
- 555+ bedrooms

- Cars and other vehicles available in Gloverville in owner-occupied houses/condos
- 52no vehicle
- 1301 vehicle
- 3572 vehicles
- 613 vehicles
- 564 vehicles
- 75+ vehicles

- Cars and other vehicles available in Gloverville in renter-occupied apartments
- 87no vehicle
- 2451 vehicle
- 622 vehicles
- 823 vehicles
- 04 vehicles
- 05+ vehicles

- Rooms in owner-occupied houses in Gloverville, South Carolina
- 01 room
- 02 rooms
- 03 rooms
- 1144 rooms
- 3675 rooms
- 486 rooms
- 787 rooms
- 418 rooms
- 169+ rooms

- Rooms in renter-occupied apartments in Gloverville, South Carolina
- 01 room
- 02 rooms
- 1253 rooms
- 1644 rooms
- 525 rooms
- 116 rooms
- 697 rooms
- 258 rooms
- 309+ rooms


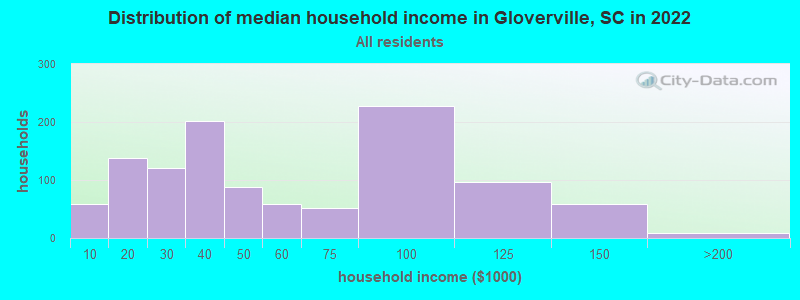
Gloverville, SC household income distribution

- 58Less than $10,000
- 138$10,000 to $19,999
- 120$20,000 to $29,999
- 201$30,000 to $39,999
- 88$40,000 to $49,999
- 58$50,000 to $59,999
- 51$60,000 to $74,999
- 227$75,000 to $99,999
- 96$100,000 to $124,999
- 58$125,000 to $149,999
- 8$150,000 to $199,999
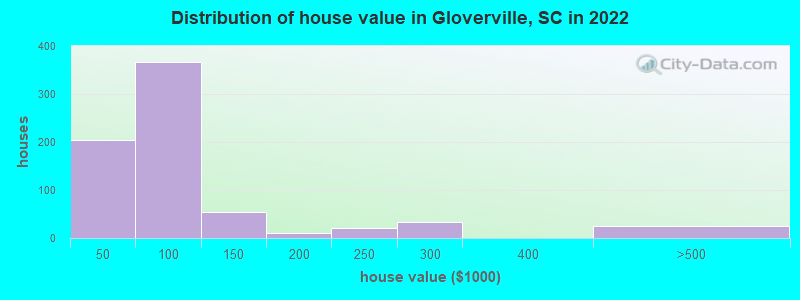
Home value of owner - occupied houses in 2022 in Gloverville, SC
-
- 92$10,000 to $14,999
- 22$15,000 to $19,999
- 5$20,000 to $24,999
- 26$30,000 to $34,999
- 56$40,000 to $49,999
- 31$50,000 to $59,999
- 7$60,000 to $69,999
- 233$70,000 to $79,999
- 23$80,000 to $89,999
- 12$90,000 to $99,999
- 10$100,000 to $124,999
- 43$125,000 to $149,999
- 10$175,000 to $199,999
- 20$200,000 to $249,999
- 32$250,000 to $299,999
- 25$400,000 to $499,999
Rent paid by renters in 2022 in Gloverville, SC
-
- 12$350 to $399
- 71$400 to $449
- 8$450 to $499
- 41$500 to $549
- 5$550 to $599
- 40$600 to $649
- 25$650 to $699
- 34$750 to $799
- 60$800 to $899
- 81$900 to $999
- 66No cash rent


Percentage of workers working in this county: 75.5%
Number of people working at home: 211 (17.0% of all workers)
Travel time to work (commute)
- Less than 5 minutes: 25
- 5 to 9 minutes: 166
- 10 to 14 minutes: 83
- 15 to 19 minutes: 99
- 20 to 24 minutes: 267
- 25 to 29 minutes: 127
- 30 to 34 minutes: 151
- 35 to 39 minutes: 0
- 40 to 44 minutes: 0
- 45 to 59 minutes: 60
- 60 to 89 minutes: 30
- 90 or more minutes: 0
Means of transportation to work:
- Drove a car alone: 793 (74.8%)
- Carpooled: 233 (22.0%)
- Bus or trolley bus: 11 (1.0%)
- Walked: 14 (1.3%)
- Worked at home: 9 (0.8%)

- Unemployment by race in 2022
- Unemployment rate for White non-Hispanic residents
- 4.9%Males
- 4.4%Females
- Unemployment rate for Black residents
- 96.1%Males

- Year of entry for the foreign-born population in Gloverville, South Carolina
- 252010 or later
- 02000 to 2009
- 271990 to 1999
- 01980 to 1989
- 01970 to 1979
- 8Before 1970

First ancestries reported:
- American: 695 (34.5%)
- German: 369 (18.3%)
- Irish: 242 (12.0%)
- English: 133 (6.6%)
- European: 32 (1.6%)
- Italian: 25 (1.2%)
- French: 7 (0.3%)
Most common places of birth for foreign-born residents (%):
| Gloverville: | 92.5% (49) |
| South Carolina: | 22.5% (60,774) |
Place of birth for U.S.-born residents:
- This state: 1,606
- Other state: 1,472
- Northeast: 206
- Midwest: 107
- South: 1,140
- West: 20
85.8% of Gloverville residents lived in the same house 1 years ago.
Out of people who lived in different houses, 42.8% lived in this county.
Out of people who lived in different counties, 53.6% lived in South Carolina.
| Gloverville: | 85.8% |
| State average: | 86.5% |
Education attainment for males 25 years and older:
- No schooling: 25
- Nursery to 4th grade: 0
- 5th and 6th grade: 21
- 7th and 8th grade: 47
- 9th grade: 0
- 10th grade: 0
- 11th grade: 0
- 12th grade, no diploma: 16
- High school graduate (or equivalency): 501
- Less than 1 year of college: 39
- Some college more than 1 year, no degree: 37
- Associate degree: 0
- Bachelor's degree: 43
- Master's degree: 26
- Professional school degree: 0
- Doctorate degree: 0

Education attainment for females 25 years and older:
- No schooling: 5
- Nursery to 4th grade: 71
- 5th and 6th grade: 58
- 7th and 8th grade: 15
- 9th grade: 6
- 10th grade: 15
- 11th grade: 30
- 12th grade, no diploma: 63
- High school graduate (or equivalency): 599
- Less than 1 year of college: 25
- Some college more than 1 year, no degree: 47
- Associate degree: 208
- Bachelor's degree: 74
- Master's degree: 0
- Professional school degree: 0
- Doctorate degree: 1


Housing units in structures:
- One, detached: 603
- 3 or 4: 43
- 20 to 49: 78
- Mobile homes: 608
Median worth of mobile homes: $72,923
Housing units lacking complete kitchen facilities in 2022: 7.7%
House/condo owner moved in on average 8 years ago
Renter moved in on average 9 years ago

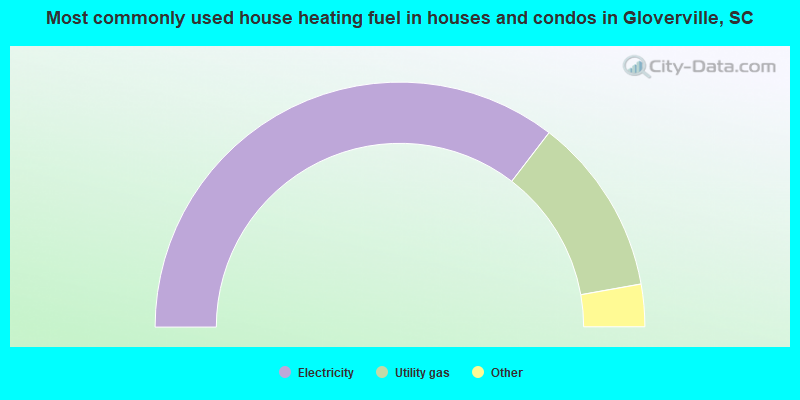
- 71.0%Electricity
- 23.6%Utility gas
- 3.0%Wood
- 2.4%Bottled, tank, or LP gas
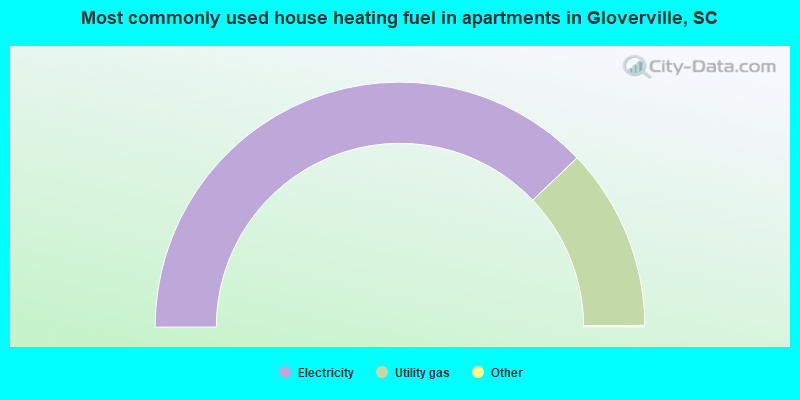
- 75.9%Electricity
- 24.1%Utility gas
Private vs. public school enrollment:
| Here: | 4.7% |
| South Carolina: | 14.4% |
| Here: | 0.0% |
| South Carolina: | 11.1% |
| Here: | 0.0% |
| South Carolina: | 21.9% |


