Grayville, IL (Illinois) Houses and Residents
| Grayville: | $73,344 |
| Illinois: | $251,600 |
Mean price in 2022:
Detached houses: $95,422
Here: $95,422 State: $310,164 Mobile homes: $66,640
Here: $66,640 State: $78,855
Total population: 1,639 (Urban population: 0, Rural population: 1,733 (all nonfarm))
Houses: 836 (645 occupied: 443 owner occupied, 210 renter occupied)
| % of renters here: | 32% |
| State: | 33% |
Housing density: 561 houses/condos per square mile
Median price asked for vacant for-sale houses and condos in 2022: $42,106.
Median contract rent in 2022: $352 (lower quartile is $302, upper quartile is $396)
Median rent asked for vacant for-rent units in 2022: $674
Median gross rent in Grayville, IL in 2022: $707
Housing units in Grayville with a mortgage: 238 (16 second mortgage, 0 home equity loan, 16 both second mortgage and home equity loan)
Houses without a mortgage: 16
Median household income for houses/condos with a mortgage: $58,684
Median household income for apartments without a mortgage: $55,379
Median monthly housing costs: $649
Compare current foreclosures near Grayville, IL:
| Photo | Address | Area | Beds / Baths | Price | Details |
|---|---|---|---|---|---|

|
#1
N Main St
Grayville, IL 62844
|
- sq. feet
|
- baths - beds |
$17,900
|
show details |

|
#2
Mulberry St
Grayville, IL 62844
|
- sq. feet
|
- baths - beds |
show details | |

|
#3
N 1st St
Grayville, IL 62844
|
- sq. feet
|
- baths - beds |
show details | |

|
#4
Wade Rd
Wadesville, IN 47638
|
2,160 sq. feet
|
2 baths 4 beds |
$329,900
|
show details |

|
#5
E Main St
Bone Gap, IL 62815
|
1,300 sq. feet
|
1 baths 3 beds |
$1
|
show details |

|
#6
E Plum St
Grayville, IL 62844
|
- sq. feet
|
- baths - beds |
show details | |

|
#7
Highway 165
Poseyville, IN 47633
|
1,613 sq. feet
|
1 baths 3 beds |
show details | |

|
#8
Highway 66
New Harmony, IN 47631
|
952 sq. feet
|
1 baths 1 beds |
show details | |

|
#9
Harmony Township Rd
New Harmony, IN 47631
|
1,008 sq. feet
|
1 baths 3 beds |
show details | |

|
#10
N Main St
Owensville, IN 47665
|
1,120 sq. feet
|
1 baths 2 beds |
show details |
| Photo | Address | Area | Beds / Baths | Price | Details |
|---|---|---|---|---|---|

|
#11
W 450 S
Owensville, IN 47665
|
1,861 sq. feet
|
1 baths - beds |
show details | |

|
#12
E Poplar St
Owensville, IN 47665
|
- sq. feet
|
- baths - beds |
show details | |

|
#13
Oak St
Carmi, IL 62821
|
- sq. feet
|
- baths - beds |
show details | |

|
#14
E Montgomery St
Owensville, IN 47665
|
- sq. feet
|
- baths - beds |
show details | |

|
#15
Highway 69 N
New Harmony, IN 47631
|
- sq. feet
|
- baths - beds |
show details | |

|
#16
E Brummitt St
Owensville, IN 47665
|
- sq. feet
|
- baths - beds |
show details | |

|
#17
Goad Cemetery Rd E
New Harmony, IN 47631
|
- sq. feet
|
1 baths - beds |
show details | |

|
#18
Gilpin St
Carmi, IL 62821
|
- sq. feet
|
- baths - beds |
show details | |

|
#19
Highway 66
Wadesville, IN 47638
|
- sq. feet
|
- baths - beds |
show details | |

|
#20
North St
Cynthiana, IN 47612
|
- sq. feet
|
- baths - beds |
show details |
| Photo | Address | Area | Beds / Baths | Price | Details |
|---|---|---|---|---|---|

|
#21
N 1st St
Owensville, IN 47665
|
- sq. feet
|
- baths - beds |
show details | |

|
#22
Metz Rd
Wadesville, IN 47638
|
- sq. feet
|
- baths - beds |
show details | |

|
#23
Metz Rd
Wadesville, IN 47638
|
- sq. feet
|
2 baths - beds |
show details | |

|
#24
W 4th St
Mount Carmel, IL 62863
|
- sq. feet
|
- baths - beds |
show details | |

|
#25
Elm St
Carmi, IL 62821
|
- sq. feet
|
- baths - beds |
show details | |

|
#26
N Main St
Owensville, IN 47665
|
- sq. feet
|
- baths - beds |
show details | |

|
#27
Oak St
Carmi, IL 62821
|
- sq. feet
|
- baths - beds |
show details | |

|
#28
Lang Rd
Poseyville, IN 47633
|
- sq. feet
|
1 baths - beds |
show details | |

|
#29
Oak St
Carmi, IL 62821
|
- sq. feet
|
- baths - beds |
show details | |

|
#30
S Church St
Carmi, IL 62821
|
- sq. feet
|
- baths - beds |
show details |
| Photo | Address | Area | Beds / Baths | Price | Details |
|---|---|---|---|---|---|

|
#31
Lee Rd
New Harmony, IN 47631
|
- sq. feet
|
- baths - beds |
show details | |

|
#32
N 3rd St
New Harmony, IN 47631
|
- sq. feet
|
- baths - beds |
show details | |

|
#33
Pumpkin Run Rd
Poseyville, IN 47633
|
- sq. feet
|
2 baths - beds |
show details | |

|
#34
Maple Hill Rd
New Harmony, IN 47631
|
- sq. feet
|
- baths - beds |
show details | |

|
#35
S Koch Dr
Poseyville, IN 47633
|
- sq. feet
|
- baths - beds |
show details | |

|
#36
S Highway 65
Owensville, IN 47665
|
- sq. feet
|
- baths - beds |
show details | |

|
#37
W Oak St
Poseyville, IN 47633
|
- sq. feet
|
- baths - beds |
show details | |

|
#38
S State Road 165
Owensville, IN 47665
|
- sq. feet
|
- baths - beds |
show details | |

|
#39
Lang Rd
Poseyville, IN 47633
|
- sq. feet
|
2 baths - beds |
show details | |

|
#40
7th St
Carmi, IL 62821
|
- sq. feet
|
- baths - beds |
show details |
| Photo | Address | Area | Beds / Baths | Price | Details |
|---|---|---|---|---|---|

|
#41
W North St
Bone Gap, IL 62815
|
- sq. feet
|
- baths - beds |
show details | |

|
#42
Greathouse Rd
New Harmony, IN 47631
|
- sq. feet
|
- baths - beds |
show details | |

|
#43
S Sharp St
Poseyville, IN 47633
|
- sq. feet
|
- baths - beds |
show details | |

|
#44
S 950 W
Owensville, IN 47665
|
- sq. feet
|
- baths - beds |
show details | |

|
#45
Cedar Hills St
Albion, IL 62806
|
- sq. feet
|
- baths - beds |
show details | |

|
#46
W Elm St
Albion, IL 62806
|
- sq. feet
|
- baths - beds |
show details | |

|
#47
E Pine St
Albion, IL 62806
|
- sq. feet
|
- baths - beds |
show details | |

|
#48
County Road 850 E
Browns, IL 62818
|
- sq. feet
|
- baths - beds |
show details | |

|
#49
W Boren Ave
Poseyville, IN 47633
|
- sq. feet
|
- baths - beds |
show details | |

|
Check over 1 million property listings on Foreclosure.com!
|
browse all offers | |||

Latest news about housing in Grayville, IL collected exclusively by city-data.com from local newspapers, TV, and radio stations


Median year apartment built: 1958
Household type by relationship:
Households: 1,520- Male householders: 209 (74 living alone), Female householders: 425 (133 living alone)
252 spouses (243 opposite-sex spouses), 71 unmarried partners, (71 opposite-sex unmarried partners), 428 children (406 natural, 0 adopted, 21 stepchildren), 33 grandchildren, 0 brothers or sisters, 2 parents, 0 foster children, 2 other relatives, 48 non-relatives
- In group quarters: 46
Size of family households: 163 2-persons, 88 3-persons, 73 4-persons, 46 5-persons, 6 6-persons, 6 7-or-more-persons.
Size of nonfamily households: 219 1-person, 47 2-persons, 2 3-persons.
106 married couples with children.
226 single-parent households (50 men, 176 women).
97.9% of residents of Grayville speak English at home.
0.1% of residents speak other Indo-European language at home (100% speak English very well).
0.9% of residents speak Asian or Pacific Island language at home (62% speak English very well, 38% speak English well).
0.7% of residents speak other language at home (100% speak English very well).
Foreign born population: 21 (1.4%)
(23.8% of them are naturalized citizens)
| Here: | 5.8 |
| State: | 6.4 |
| Here: | 4.4 |
| State: | 4.1 |

- Bedrooms in owner-occupied houses and condos in Grayville, Illinois
- 0no bedroom
- 171 bedroom
- 1532 bedrooms
- 2273 bedrooms
- 474 bedrooms
- 05+ bedrooms

- Bedrooms in renter-occupied apartments in Grayville, Illinois
- 1no bedroom
- 321 bedroom
- 992 bedrooms
- 703 bedrooms
- 94 bedrooms
- 05+ bedrooms

- Cars and other vehicles available in Grayville in owner-occupied houses/condos
- 15no vehicle
- 1701 vehicle
- 1582 vehicles
- 573 vehicles
- 324 vehicles
- 125+ vehicles

- Cars and other vehicles available in Grayville in renter-occupied apartments
- 52no vehicle
- 591 vehicle
- 532 vehicles
- 473 vehicles
- 04 vehicles
- 05+ vehicles

- Rooms in owner-occupied houses in Grayville, Illinois
- 01 room
- 02 rooms
- 113 rooms
- 784 rooms
- 1055 rooms
- 796 rooms
- 947 rooms
- 498 rooms
- 279+ rooms

- Rooms in renter-occupied apartments in Grayville, Illinois
- 11 room
- 02 rooms
- 443 rooms
- 624 rooms
- 335 rooms
- 596 rooms
- 97 rooms
- 08 rooms
- 39+ rooms


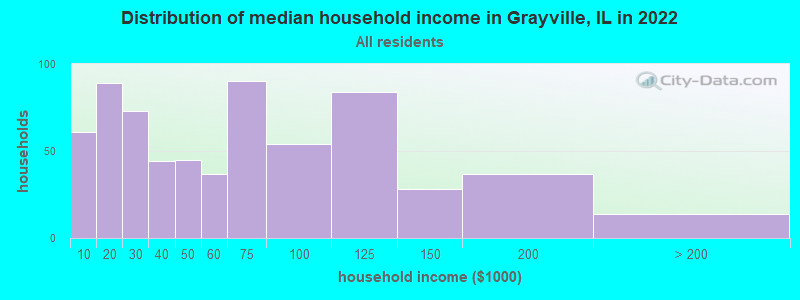
Grayville, IL household income distribution

- 61Less than $10,000
- 89$10,000 to $19,999
- 73$20,000 to $29,999
- 44$30,000 to $39,999
- 45$40,000 to $49,999
- 37$50,000 to $59,999
- 90$60,000 to $74,999
- 54$75,000 to $99,999
- 84$100,000 to $124,999
- 28$125,000 to $149,999
- 37$150,000 to $199,999
- 14$200,000 or more
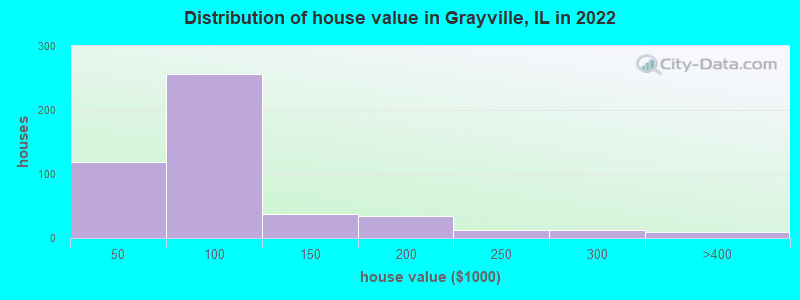
Home value of owner - occupied houses in 2022 in Grayville, IL
-
- 7Less than $10,000
- 4$10,000 to $14,999
- 1$15,000 to $19,999
- 28$20,000 to $24,999
- 7$25,000 to $29,999
- 12$30,000 to $34,999
- 14$35,000 to $39,999
- 43$40,000 to $49,999
- 26$50,000 to $59,999
- 83$60,000 to $69,999
- 36$70,000 to $79,999
- 38$80,000 to $89,999
- 27$90,000 to $99,999
- 25$100,000 to $124,999
- 11$125,000 to $149,999
- 15$150,000 to $174,999
- 19$175,000 to $199,999
- 12$200,000 to $249,999
- 11$250,000 to $299,999
- 9$300,000 to $399,999
Rent paid by renters in 2022 in Grayville, IL
-
- 9Less than $100
- 20$100 to $149
- 7$200 to $249
- 43$300 to $349
- 58$350 to $399
- 16$400 to $449
- 3$450 to $499
- 3$500 to $549
- 9$550 to $599
- 10$600 to $649
- 28No cash rent


Percentage of workers working in this county: 49.3%
Number of people working at home: 95 (13.3% of all workers)
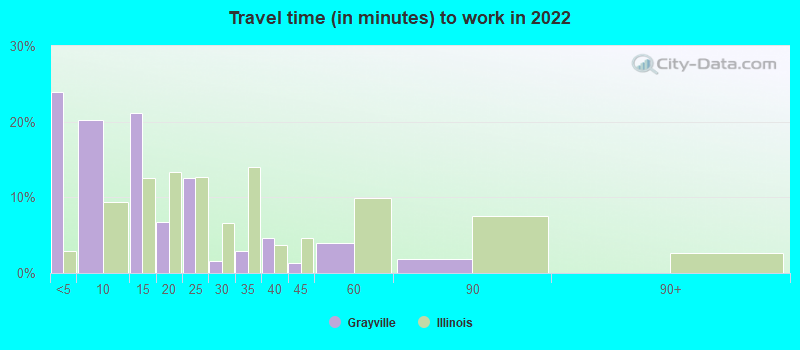
Travel time to work (commute)
- Less than 5 minutes: 118
- 5 to 9 minutes: 94
- 10 to 14 minutes: 35
- 15 to 19 minutes: 63
- 20 to 24 minutes: 13
- 25 to 29 minutes: 16
- 30 to 34 minutes: 95
- 35 to 39 minutes: 23
- 40 to 44 minutes: 24
- 45 to 59 minutes: 72
- 60 to 89 minutes: 46
- 90 or more minutes: 2
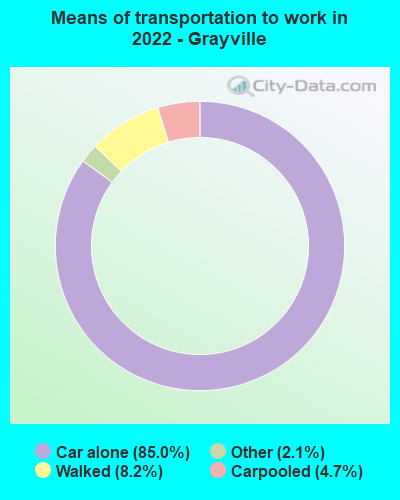
Means of transportation to work:
- Drove a car alone: 423 (71.7%)
- Carpooled: 24 (4.1%)
- Taxi: 11 (1.9%)
- Walked: 41 (6.9%)
- Worked at home: 95 (16.1%)

- Unemployment by race in 2022
- Unemployment rate for White non-Hispanic residents
- 4.9%Males
- 3.7%Females

- Year of entry for the foreign-born population in Grayville, Illinois
- 12010 or later
- 02000 to 2009
- 01990 to 1999
- 31980 to 1989
- 41970 to 1979
- 0Before 1970

First ancestries reported:
- English: 122 (22.0%)
- German: 90 (16.2%)
- American: 89 (16.1%)
- Irish: 65 (11.7%)
- European: 26 (4.7%)
- French: 23 (4.2%)
- Ukrainian: 13 (2.3%)
- African: 10 (1.8%)
- Scotch-Irish: 7 (1.3%)
- Polish: 6 (1.1%)
- Dutch: 5 (0.9%)
- Italian: 1 (0.2%)
Most common places of birth for foreign-born residents (%):
| Grayville: | 66.7% (14) |
| Illinois: | 0.0% (494) |
| Grayville: | 47.6% (10) |
| Illinois: | 0.5% (8,235) |
| Grayville: | 4.8% (1) |
| Illinois: | 0.5% (8,778) |
Place of birth for U.S.-born residents:
- This state: 786
- Other state: 704
- Northeast: 8
- Midwest: 448
- South: 158
- West: 90
89.6% of Grayville residents lived in the same house 1 years ago.
Out of people who lived in different houses, 31.1% lived in this county.
Out of people who lived in different counties, 53.8% lived in Illinois.
| Grayville: | 89.6% |
| State average: | 88.3% |
Education attainment for males 25 years and older:
- No schooling: 0
- Nursery to 4th grade: 10
- 5th and 6th grade: 0
- 7th and 8th grade: 1
- 9th grade: 2
- 10th grade: 7
- 11th grade: 38
- 12th grade, no diploma: 0
- High school graduate (or equivalency): 159
- Less than 1 year of college: 52
- Some college more than 1 year, no degree: 77
- Associate degree: 68
- Bachelor's degree: 47
- Master's degree: 12
- Professional school degree: 1
- Doctorate degree: 0

Education attainment for females 25 years and older:
- No schooling: 8
- Nursery to 4th grade: 0
- 5th and 6th grade: 0
- 7th and 8th grade: 5
- 9th grade: 8
- 10th grade: 13
- 11th grade: 23
- 12th grade, no diploma: 12
- High school graduate (or equivalency): 160
- Less than 1 year of college: 44
- Some college more than 1 year, no degree: 67
- Associate degree: 128
- Bachelor's degree: 57
- Master's degree: 24
- Professional school degree: 1
- Doctorate degree: 0


Housing units in structures:
- One, detached: 634
- One, attached: 8
- Two: 47
- 3 or 4: 33
- 5 to 9: 23
- Mobile homes: 90
Median worth of mobile homes: $79,072
Housing units lacking complete kitchen facilities in 2022: 6.2%
House/condo owner moved in on average 11 years ago
Renter moved in on average 3 years ago

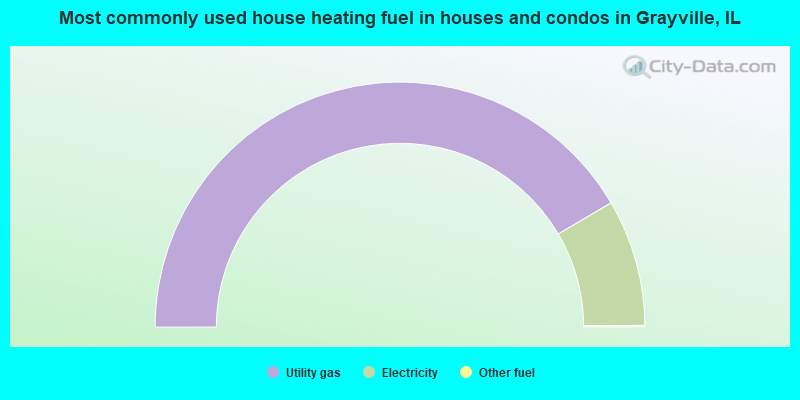
- 83.0%Utility gas
- 16.7%Electricity
- 0.2%Other fuel
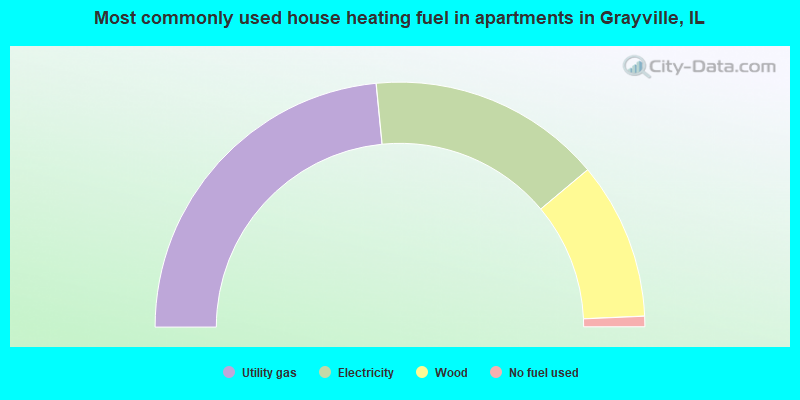
- 46.9%Utility gas
- 30.9%Electricity
- 20.8%Wood
- 1.4%No fuel used
Private vs. public school enrollment:
| Here: | 3.5% |
| Illinois: | 13.3% |
| Here: | 0.0% |
| Illinois: | 9.9% |
| Here: | 0.0% |
| Illinois: | 27.4% |


